. 2023 Nov 18;14(11):756.
doi: 10.1038/s41419-023-06272-3.

Inhibition of PDGFRβ alleviates endothelial cell apoptotic injury caused by DRP-1 overexpression and mitochondria fusion failure after mitophagy

Affiliations

Inhibition of PDGFRβ alleviates endothelial cell apoptotic injury caused by DRP-1 overexpression and mitochondria fusion failure after mitophagy

Xiaohong An et al. Cell Death Dis. .

Abstract

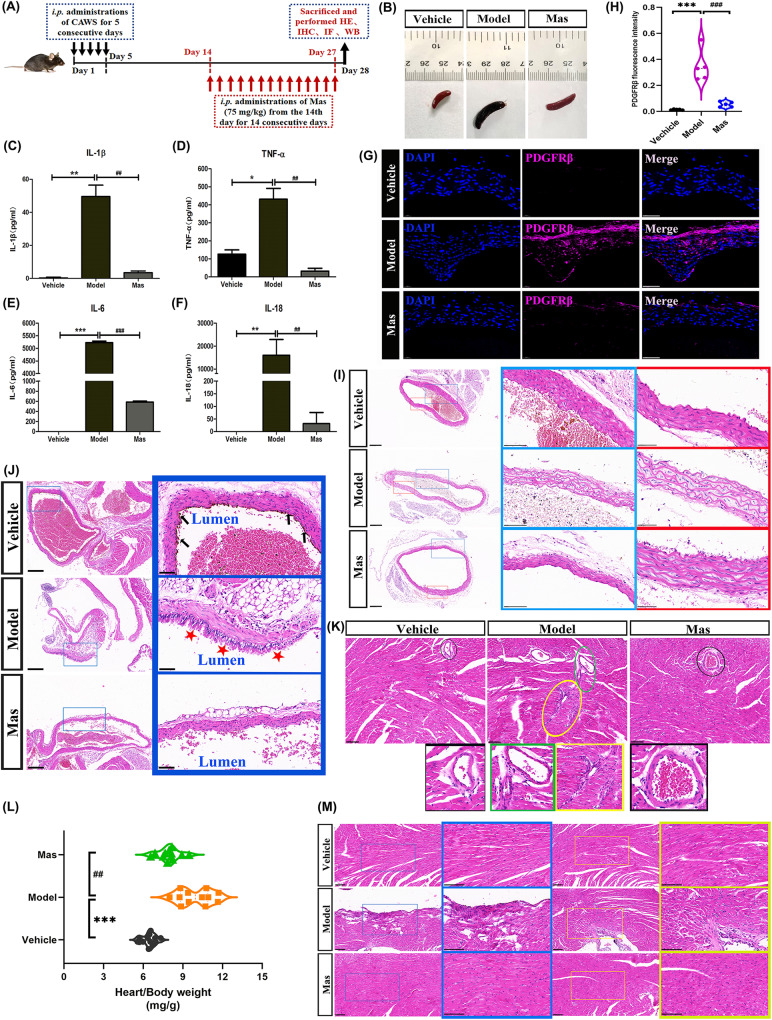
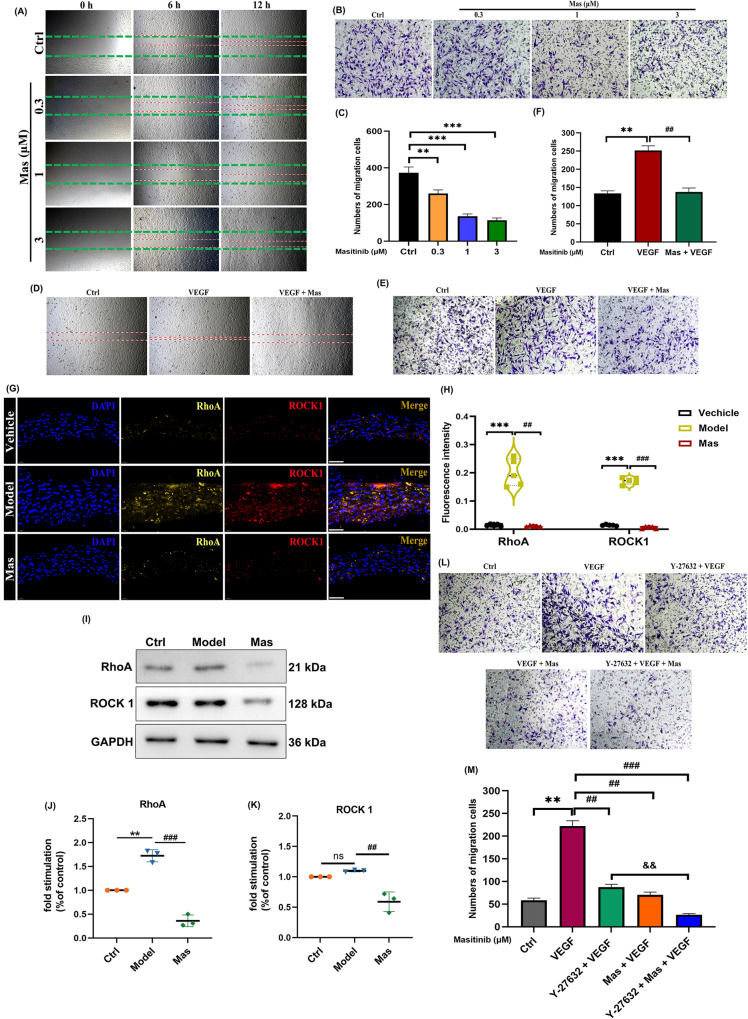
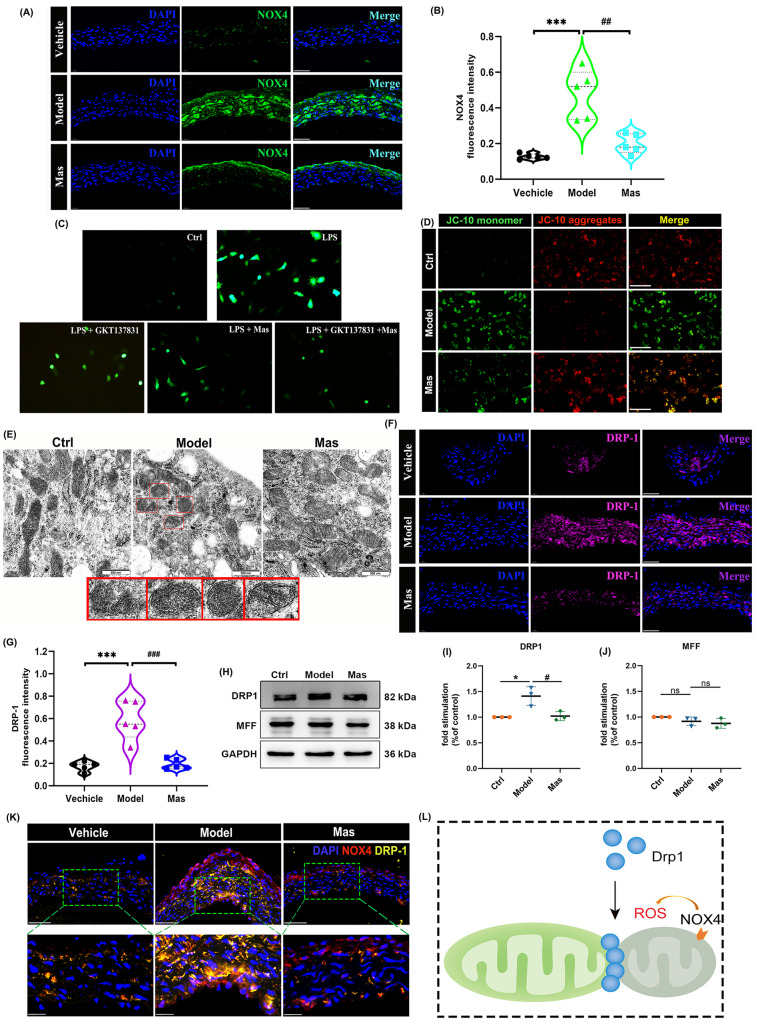
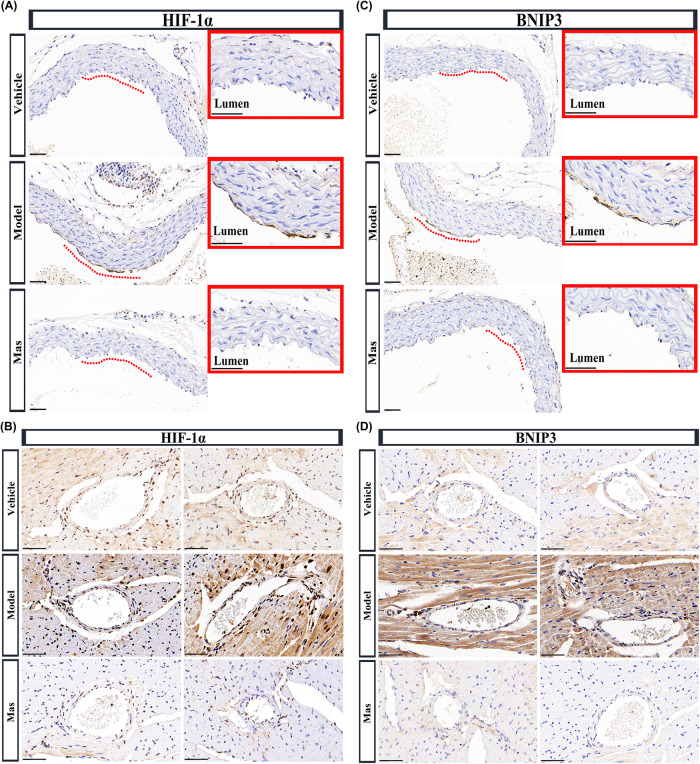
Kawasaki disease (KD), described as "mucocutaneous lymph node syndrome", affects infants and toddlers. Patients with KD suffer from an inflammatory cascade leading to vasculitis with a predilection for coronary arteries. While the symptoms and pathogenesis of KD have received more and more attention, the precise mechanisms are still debated. Researches show that endothelial dysfunction process in KD leads to arterial damage and affect clinical outcome. In this study, we constructed a Candida albicans water soluble fraction (CAWS)-induced KD murine model and penetrated investigating the mechanisms behind endothelial dysfunction. CAWS-induced mice presented remarkably elevated vascular endothelial cell growth factor (VEGF) levels. Abundant expression of VEGF was documented in all vessels that showed edema from acute KD. It has been reported that Platelet-derived growth factor (PDGF) co-expression normalizes VEGF-induced aberrant angiogenesis. Hyperexpression of PDGFRβ was induced in the thickened medial layer and vascular endothelium of KD mice. Masitinib (Mas) is an oral tyrosine kinase inhibitor of numerous targets, which can selectively target PDGFR signaling. We set out to explore whether Mas could regulate coronary pathology in KD. Mas administration significantly reduced the VEGF-induced endothelial cells migration. NOX4 was activated in vascular endothelial cells to produce more ROS. Mitochondrial dysregulated fission and mitophagy caused by DRP-1 overexpression precipitated the arterial endothelial cells injury. Here, mitophagy seemed to work as the driving force of DRP-1/Bak/BNIP3-dependent endothelial cells apoptosis. In summary, how mitophagy is regulated by DRP-1 under pathologic status is critical and complex, which may contribute to the development of specific therapeutic interventions in cardiovascular diseases patients, for example Masatinib, the inhibitor of PDGFRβ. FACTS AND QUESTIONS: Kawasaki disease causing systemic vasculitis, affects infants and toddlers. Coronary artery injury remains the major causes of morbidity and mortality. DRP-1 overexpression induces DRP-1/Bak/BNIP3-dependent endothelial cells apoptosis. PDGFRβ was high-expressed in the thickened medial layer of CAWS-induced KD mice. Inhibition of PDGFRβ signaling alleviates arterial endothelial cells injury.


Conflict of interest statement

The authors declare no competing interests.

Figures

Fig. 1
Fig. 1. Inducement of cardiovascular dysfunction and hyperexpression of PDGFRβ in KD murine model by CAWS.
A Schematic approach of experimental procedure. B Typical photographs of spleen. CF Serum levels of IL-1β, IL-6, IL-18, and TNF-α were examined by Elisa. Every three serum samples of each group are blended into one tube for Elisa examination (n = 12 per group, mixed to formed 4 test samples). G Representative immunofluorescence images for detecting PDGFRβ (magenta) expressions within aorta, DAPI (blue) (n = 5 per group). Scale bar: 50 μm. H PDGFRβ fluorescence intensity. I H&E staining showing the morphological characteristics of mouse aorta (n = 4 per group). Enlarged images of area of interesting (AOI) were indicated with blue and red block diagrams. Scale bar: 200 μm (low magnification), 100 μm (high magnification in blue block diagrams), and 50 μm (high magnification in red block diagrams). J H&E staining showing the morphological characteristics of main coronary artery (n = 4 per group). Enlarged images of area of interesting (AOI) were indicated with blue block diagrams. Scale bar: 200 μm (low magnification), 50 μm (high magnification). K H&E staining showing the morphological characteristics of coronary bifurcation arteritis (n = 4 per group). Enlarged images of area of interesting (AOI) were indicated with oval frames. Scale bar: 100 μm (low magnification). L Heart weight/body weight ratio of each group. Each data point represents a biological replicate. M H&E staining showing the morphological characteristics of myocardium (n = 4 per group). Enlarged images of area of interesting (AOI) were indicated with blue and yellow block diagrams. Scale bar: 100 μm (low magnification) and 50 μm (high magnification). One-way ANOVA was followed by post hoc Tukey’s test. All results are presented as mean ± SEM. *P < 0.05, **P < 0.01, ***P < 0.001 vs vehicle group, ##P < 0.01, ###P < 0.001 vs model group.
Fig. 2
Fig. 2. VSMCs dedifferentiated to macrophage-like switching phenotype.
A Representative immunofluorescence images for detecting α-SMA (red), DAPI (blue) (n = 5 per group). Scale bar: 50 μm. B α-SMA fluorescence intensity. C Representative immunofluorescence images for double-labeling of OPN (green) and PDGFRβ (magenta) of aorta, DAPI (blue) (n = 5 per group). Scale bar: 50 μm. D OPN and PDGFRβ fluorescence intensity. E Representative immunofluorescence images for double-labeling of α-SMA (green) and MOMA (magenta) expressions of aorta, DAPI (blue) (n = 5 per group). Scale bar: 50 μm (low magnification) and 20 μm (high magnification). F α-SMA and MOMA fluorescence intensity. G Representative immunofluorescence images for double-labeling of αSMA (green) and F4/80 (red) expressions of aorta, DAPI (blue) (n = 5 per group). Scale bar: 50 μm (low magnification) and 20 μm (high magnification). H α-SMA and F4/80 fluorescence intensity. One-way ANOVA was followed by post hoc Tukey’s test. All results are presented as mean ± SEM. **P < 0.01,***P < 0.001 vs vehicle group, #P < 0.05, ##P < 0.01, ###P < 0.001, vs model group.
Fig. 3
Fig. 3. Inducement of arterial endothelial injury and VEGF levels increase in artery of KD murine model.
A Representative immunofluorescence images for eNOS (green) expressions of aortic endothelium, DAPI (blue) (n = 5 per group). Scale bar: 50 μm. B eNOS fluorescence intensity. C Representative immunofluorescence images for double-labeling of iNOS (green) and CD31 (red) expressions of aorta, DAPI (blue) (n = 5 per group). Scale bar: 50 μm. D CD31 and iNOS fluorescence intensity. E Representative immumohistochemical images for VEGF expression in aorta (n = 4 per group). Enlarged images of area of interesting (AOI) were indicated with red block diagrams. Scale bar: 50 μm. F Representative immumohistochemical images for VEGF expression in coronary bifurcation arteritis (n = 4 per group). Scale bar: 50 μm. One-way ANOVA was followed by post hoc Tukey’s test. All results are presented as mean ± SEM.***P < 0.001 vs vehicle group, ##P < 0.01, ###P < 0.001 vs model group.
Fig. 4
Fig. 4. Mas inhibits VECs migration through RhoA/ROCK signaling pathway in VECs.
A Representative images of wound healing assays. HUVECs had been exposed to different concentrations of Mas (0.3, 1, 3 μM) for 12 h. B Representative images of migrated HCAECs that had been exposed to different concentrations of Mas (0.3, 1, 3 μM). The migration capacity of HCAECs was determined using a Transwell culture system. C The quantification of migrated cells was counted from 5 different views. D Representative images of wound healing assays. HUVECs had been exposed to VEGF (1 nM), Mas (1 μM) + VEGF (1 nM) for 12 h. E Representative images of migrated HCAECs that had been exposed to VEGF (1 nM), Mas (1 μM) + VEGF (1 nM) for 12 h.The migration capacity of HCAECs was determined using a Transwell culture system. F The quantification of migrated cells was counted from 5 different views. Cells were observed at 40×magnification. G Representative immunofluorescence images for double-labeling of RhoA (yellow) and ROCK1 (red) expressions of aorta, DAPI (blue) (n = 5 per group). Scale bar: 50 μm (low magnification) and 20 μm (high magnification). H RhoA and ROCK1 fluorescence intensity. IK Representative western blot analysis to determine the proteins expression of RhoA and ROCK1 in HUVEC cells. L In the absence or presence of 10 μM of ROCK inhibitor Y-27632, the migration capacity of HCAECs was determined using the Transwell culture system. M The quantification of migrated cells was counted from 5 different views. Cells were observed at 40×magnification. One-way ANOVA was followed by post hoc Tukey’s test. All results are presented as mean ± SEM. **P < 0.01,***P < 0.001 vs ctrl group, ##P < 0.01, ###P < 0.001 vs VEGF group, &&P < 0.01 vs VEGF + Y-27632 group.
Fig. 5
Fig. 5. DRP-1-dependent mitochondrial dysfunction caused by dysregulated fission in the artery of KD murine model.
A Representative immunofluorescence images for detecting NOX4 (green) expressions within aorta, DAPI (blue) (n = 5 per group). Scale bar: 50 μm. B NOX4 fluorescence intensity. C HUVECs were pre-treated with 10 μM of NOX4 inhibitor GKT137831 or Mas for 2 h, then LPS for 24 h. Dihydroethidium (DHE; 10 mM) was added to cells for another 30 min. Pictures were collected. Cells were observed at 100 × magnification. D Mitochondrial membrane potential was measured by using JC-10 dye. Graphical representation of the ratio of JC-1 aggregates to JC-10 monomers. Scale bars, 20 μm. E The appearance of mitochondria was observed by TEM. Mitochondrial fragmentation was shown in enlarge image in red frame. F Representative immunofluorescence images for DRP-1 (magenta) expressions of aortic endothelium, DAPI (blue) (n = 5 per group). Scale bar: 50 μm. G DRP-1 fluorescence intensity. HJ HUVECs were pre-treated with Mas (3 μM) for 2 h and then, LPS was applied to induce inflammatory injury together with Mas for another 48 h. Model group was treated with LPS only for 48 h. Representative western blot analysis to determine the proteins expression of DRP-1 and MFF in HUVEC cells. K Representative immunofluorescence images for double-labeling of NOX4 (red) and DRP-1 (yellow) expressions of aorta, DAPI (blue) (n = 3 per group). Scale bar: 50 μm. L DRP-1-dependent mitochondrial dysfunction was described in a graphical representation. One-way ANOVA was followed by post hoc Tukey’s test. *P < 0.05, vs vehicle group. ***P < 0.001 vs vehicle or Ctrl group, #P < 0.05, ##P < 0.01, ###P < 0.001 vs model group.
Fig. 6
Fig. 6. Activation of HIF-1α/BNIP3 signaling pathway in artery of KD murine model.
A Representative immumohistochemical images for HIF-1α expression in aorta (n = 4 per group). Enlarged images of area of interesting (AOI) were indicated with red block diagrams. Scale bar: 50 μm. B Representative immumohistochemical images for HIF-1α expression in coronary bifurcation arteritis (n = 4 per group). Scale bar: 50 μm. C Representative immumohistochemical images for BNIP3 expression in aorta (n = 4 per group). Enlarged images of area of interesting (AOI) were indicated with red block diagrams. Scale bar: 50 μm. D Representative immumohistochemical images for BNIP3 expression in coronary bifurcation arteritis (n = 4 per group). Scale bar: 50 μm.
Fig. 7
Fig. 7. DRP-1-dependent segregation of damaged mitochondria promotes mitophagy for degradation.
A Representative immunofluorescence images for colocalization of BNIP3 (green) and LC3B (red) expressions of aorta, DAPI (blue) (n = 4 per group). Scale bar: 50 μm. B Representative immunofluorescence images for colocalization of Parkin (green) and LC3B (red) expressions of aorta, DAPI (blue) (n = 4 per group). Scale bar: 50 μm. C Representative immunofluorescence images for double-labeling of p62 (green) and LC3B (red) expressions of aorta, DAPI (blue) (n = 4 per group). Scale bar: 50 μm. D Representative immunofluorescence images for double-labeling of LAMP1 (green) and TOMM20 (red) expressions of aorta, DAPI (blue) (n = 4 per group). Scale bar: 50 μm. EH HUVECs were pre-treated with Mas (3 μM) for 2 h and then, LPS was applied to induce inflammatory injury together with Mas for another 48 h. Model group was treated with LPS only for 48 h. Representative western blot analysis to determine the proteins expression of BNIP3L/Nix, PINK1, and Parkin in HUVEC cells. One-way ANOVA was followed by post hoc Tukey’s test. #P < 0.05, ##P < 0.01, ###P < 0.001, vs model group. I DRP-1-dependent segregation of damaged mitochondria promoting mitophagy for degradation was described in a graphical representation.
Fig. 8
Fig. 8. DRP-1 associates with Bak at mitochondrial fission sites to induce cytochrome c release.
A, B HUVECs were pre-treated with Mas (3 μM) for 2 h and then, LPS was applied to induce inflammatory injury together with Mas for another 48 h. Model group was treated with LPS only for 48 h. Representative western blot analysis to determine the proteins expression of OPA1 in HUVEC cells. C Representative immunofluorescence images for detecting Mfn1/2 (red), DAPI (blue) (n = 4 per group). Scale bar: 50 μm. D Representative immunofluorescence images for colocalization of DRP-1 (green) and Bak (red) expressions of aorta, DAPI (blue) (n = 4 per group). Scale bar: 50 μm. E Representative immunofluorescence images for colocalization of TOMM20 (green) and cytochrome c (red) expressions of aorta, DAPI (blue) (n = 4 per group). Scale bar: 50 μm. FI HUVECs were pre-treated with Mas (3 μM) for 2 h and then, LPS was applied to induce inflammatory injury together with Mas for another 48 h. Model group was treated with LPS only for 48 h. Representative western blot analysis to determine the proteins expression of Bax, cytochrome c and cleaved-caspase 3 in HUVEC cells. J Representative immumohistochemical images for E2F3 expression in aorta (n = 4 per group). Enlarged images of area of interesting (AOI) were indicated with red block diagrams. Scale bar: 50 μm. K Representative immumohistochemical images for E2F3 expression in coronary bifurcation arteritis (n = 4 per group). Scale bar: 50 μm. L Representative immumohistochemical images for p53 expression in aorta (n = 4 per group). Enlarged images of area of interesting (AOI) were indicated with red block diagrams. Scale bar: 50 μm. M Representative immumohistochemical images for p53 expression in coronary bifurcation arteritis (n = 4 per group). Scale bar: 50 μm. N The schematic diagram describes the mitophagy which seems to work as the driving force of DRP-1/Bak/BNIP3-dependent endothelial cells apoptosis. One-way ANOVA was followed by post hoc Tukey’s test. **P < 0.01, ***P < 0.001, vs ctrl group, #P < 0.05, ###P < 0.001, vs model group.

References

    1. Shulman ST, Rowley AH. Advances in Kawasaki disease. Eur J Pediatr. 2004;163:285–91. doi: 10.1007/s00431-004-1431-z. - DOI - PubMed
    1. Burns JC, Glodé MP. Kawasaki syndrome. Lancet. 2004;364:533–44. doi: 10.1016/S0140-6736(04)16814-1. - DOI - PubMed
    1. McCrindle BW, Rowley AH, Newburger JW, Burns JC, Bolger AF, Gewitz M, et al. Diagnosis, treatment, and long-term management of Kawasaki disease: a scientific statement for health professionals from the American Heart Association. Circulation. 2017;135:e927–99. doi: 10.1161/CIR.0000000000000484. - DOI - PubMed
    1. Singh S, Jindal AK, Pilania RK. Diagnosis of Kawasaki disease. Int J Rheum Dis. 2018;21:36–44. doi: 10.1111/1756-185X.13224. - DOI - PMC - PubMed
    1. Pilania RK, Jindal AK, Bhattarai D, Naganur SH, Singh S. Cardiovascular involvement in Kawasaki disease is much more than mere coronary arteritis. Front Pediatr. 2020;8:526969. doi: 10.3389/fped.2020.526969. - DOI - PMC - PubMed

Publication types

Substances