. 2023 Nov 18;14(1):7506.
doi: 10.1038/s41467-023-43058-9.

Nanoscale patterning of collagens in C. elegans apical extracellular matrix

Affiliations

Nanoscale patterning of collagens in C. elegans apical extracellular matrix

Jennifer R G Adams et al. Nat Commun. .

Abstract

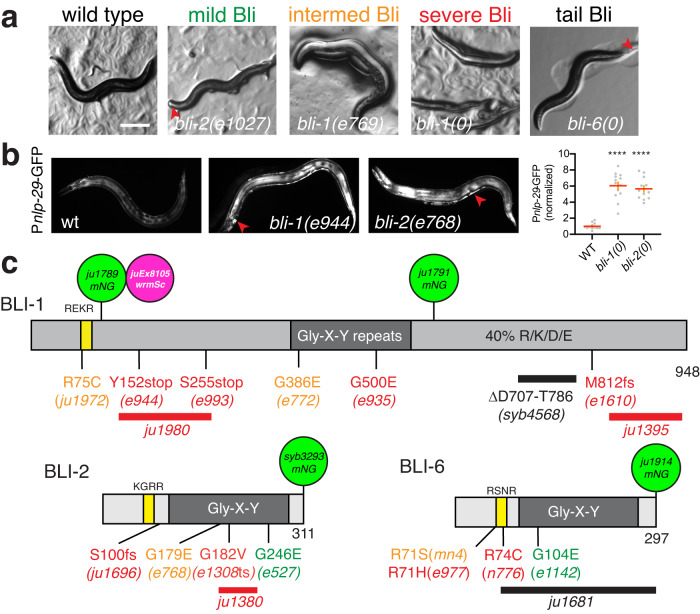
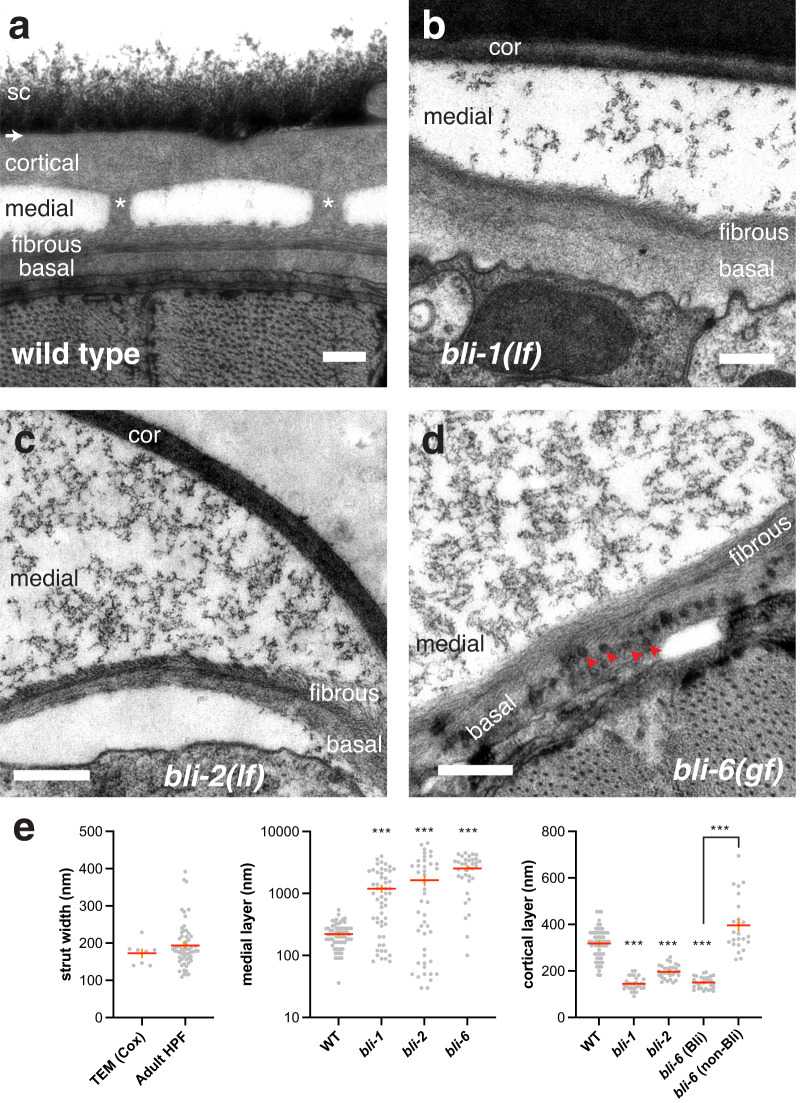
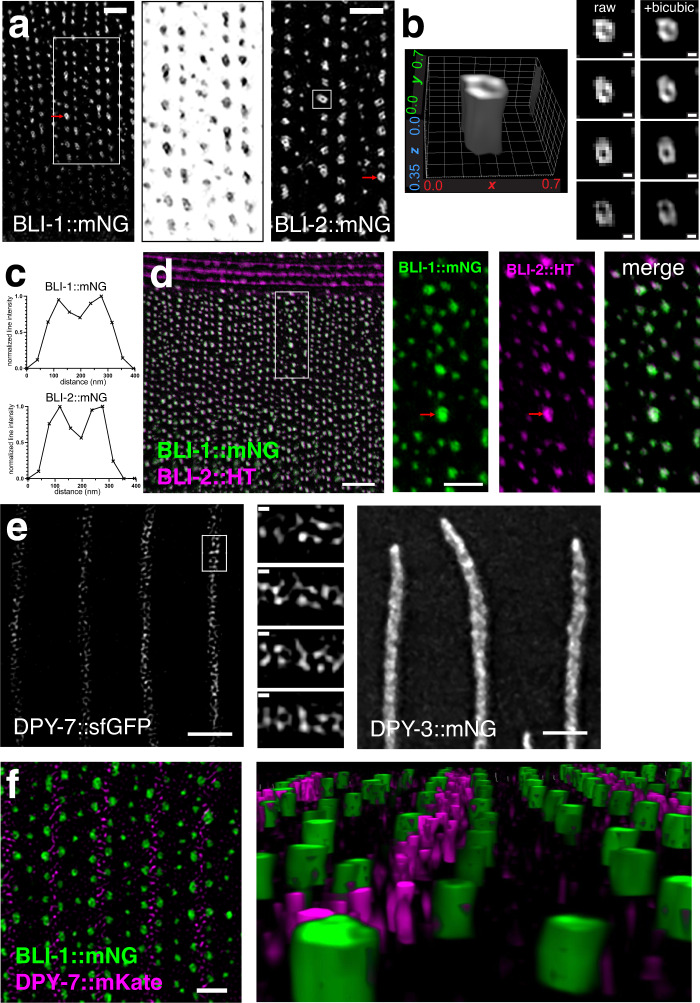
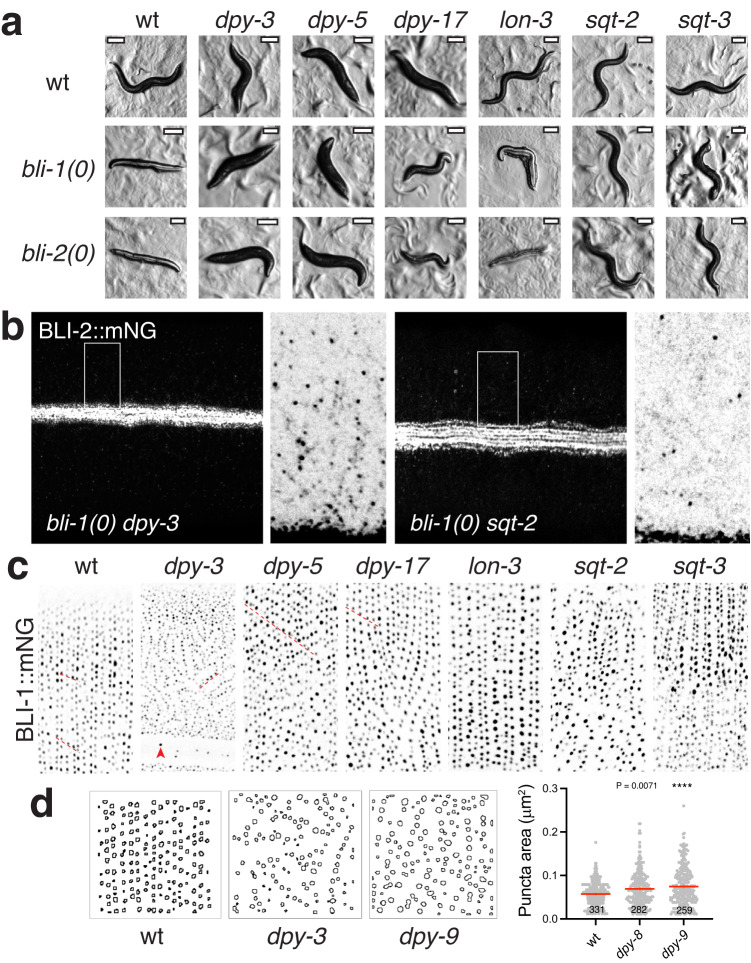
Apical extracellular matrices (aECMs) are complex extracellular compartments that form important interfaces between animals and their environment. In the adult C. elegans cuticle, layers are connected by regularly spaced columnar structures known as struts. Defects in struts result in swelling of the fluid-filled medial cuticle layer ('blistering', Bli). Here we show that three cuticle collagens BLI-1, BLI-2, and BLI-6, play key roles in struts. BLI-1 and BLI-2 are essential for strut formation whereas activating mutations in BLI-6 disrupt strut formation. BLI-1, BLI-2, and BLI-6 precisely colocalize to arrays of puncta in the adult cuticle, corresponding to struts, initially deposited in diffuse stripes adjacent to cuticle furrows. They eventually exhibit tube-like morphology, with the basal ends of BLI-containing struts contact regularly spaced holes in the cuticle. Genetic interaction studies indicate that BLI strut patterning involves interactions with other cuticle components. Our results reveal strut formation as a tractable example of precise aECM patterning at the nanoscale.


Conflict of interest statement

The authors declare no competing interests.

Figures

Fig. 1
Fig. 1. Visible phenotypes of bli mutants and molecular genetics.
a The Bli (Blistered phenotype). Dissection microscope images of representative adult animals: wild type; mild Bli, intermediate Bli, and severe Bli; for definitions see the text. bli-6(0) animals are mostly non-Bli but display small blisters at the tail (red arrowhead). Scale, 100 μm. b Upregulation of epidermal innate immune response in Bli mutants, shown by Pnlp-29-GFP(frIs7). Note GFP leakage into cuticle blisters (red arrowheads). Widefield images of adults within 12 h of L4 stage. Scale 100 μm. Quantitation of Pnlp-29-GFP fluorescence, normalized arbitrary units, showing mean (red lines) and SEM (orange error bars). Statistics, ordinary one-way ANOVA, Dunnett’s post test; ****P < 0.0001. c Predicted protein structure of three BLI collagens, cartoons with N termini to the left. Predicted subtilisin-like cleavage sites (RXXR motif, also known as Homology Box A) are yellow boxes and the Gly-X-Y repeats shown in dark gray. The C-terminal region of BLI-1 is enriched in charged residues (~20% Arg or Lys, ~20% Asp or Glu) but has no other detectable sequence motifs. Mutations causing mild, intermediate, or severe phenotypes are indicated by the color code as in (a). Additional bli mutations are listed in Tables 1–3. Uniprot entries: BLI-1 (Q09457), BLI-2 (O01914), BLI-6 (Q8MXR1).
Fig. 2
Fig. 2. bli collagen mutants are defective in strut formation.
Transmission electron micrographs (high-pressure freeze fixation; see Methods), transverse sections of cuticle of wild type and representative mutants. a Wild-type (N2) adult cuticle showing (from top to bottom) epicuticle (arrow), cortical (cor), medial, fibrous (fib), and basal (bas) layers. Two struts (white asterisks) connect the cortical and fibrous layers. The surface coat (sc) appeared as a variable diffuse layer external to the cortical layer. Image reference: Grid 1/Worm 3/Set 1/Image 155. b bli-1(e944) mutant cuticle with severe Bli phenotype showing expanded medial layer lacking struts, and amorphous electron-dense aggregates. The fibrous and basal layers appeared normal, with the two fibrous sublayers forming a herringbone appearance. Ref. 1/1/2/157. c bli-2(e768) (intermediate Bli) showing expanded medial layer lacking struts; in this image the fibrous layer has separated from underlying epidermis. Ref. 1/2/1/117. d bli-6(n776) (severe Bli) showing an expanded medial layer containing amorphous material; fibrous layer appeared normal; the basal layer contained numerous approximately 30–40 nm diameter vesicle-like structures (red arrowheads). Ref. 1/1/1/79. Scales, 200 nm. e Quantitation of strut width, medial layer thickness, and cortical layer thickness. Mean strut width in our HPF images was 193.61 ± 7.5 nm (n = 61), slightly larger than calculated from in classic TEM data of 172 ± 10.6 nm (mean ± SEM, n = 8; P = 0.37 by two-tailed Mann–Whitney test). Mean medial layer thickness in wild-type adult EM is 221 ± 11 nm (wild type, n = 70) versus > 1100 nm in Bli mutants; ***P < 0.0001 (exact P = 0.0005 for WT vs bli-2), Kruskal–Wallis test and Dunn’s post test. Mean cortical layer thickness was reduced compared to wild type in blistered (Bli) areas of cuticle in bli-1(lf), bli-2(lf), and bli-6(gf) mutants, and was more variable in non-Bli areas of bli-6(gf) mutant cuticle, suggesting reduced cortical layer thickness may be a secondary consequence of blister inflation. Ordinary one-way ANOVA and Šidák’s post test; ***P < 0.0001.
Fig. 3
Fig. 3. BLI collagens localize to adult-specific puncta corresponding to struts.
a BLI-1::mNG (ju1789) knock-in localized to puncta arranged in circumferential rows overlying dorsal and ventral epidermis but largely excluded from lateral alae. Furrows indicated by dashed yellow lines, individual puncta by red arrowheads. Larger puncta (e.g. arrowhead in left panel) tend to be more widely spaced than smaller puncta. b Quantitation of puncta area in BLI-1::mNG(ju1789). Puncta decrease in size along the body axis, comparing anterior body, midbody, and posterior body (Kruskal–Wallis test and Dunn’s post test; number of puncta indicated in dot plot, taken from 3 ROIs per body region, in 3 separate experiments). In the anterior, puncta were similar in size between furrow-flanking and central rows (two-tailed Mann–Whitney test, n > 100 puncta per row type). Mean line in red and SEM in orange. c, d In adult males, BLI-1::mNG(ju1789) localized to regular rows of struts in the anterior body; compared to the anterior hermaphrodite, the central rows were less consistent and the furrow-flanking double rows more prominent. In the adult male tail BLI-1::mNG localized to larger puncta in the posterior tail region and was diffusely localized in the tail fan (outlined). e BLI-2::mNG knock-in (syb3293) colocalized with BLI-1::wrmScarlet (mSc.) (juEx8105) (magenta) and also localized to adult lateral alae (bright green stripe). Double labeling with BLI-1::wrmScarlet and merged image. f BLI-6::mNG knock-in (ju1914) localizes to struts, alae and to cuticle furrows, and partly colocalized with BLI-1::wrmScarlet (juEx8105) (magenta); the ju1914 knock-in caused mild aggregation of BLI-1::wrmScarlet and therefore may affect bli-6 function. Conventional confocal; insets 10 μm wide. g BLI-2::HaloTag puncta (labeled with JF549 staining, magenta) localized to rows adjacent to furrows marked with DPY-9::mNG (green). h BLI-1::wrmScarlet puncta were complementary to gaps in the fibrous layer as shown here by DPY-13::mNG knock-in (see Supplementary Fig. 3f). Top of inset shows merged channels, bottom half is DPY-13::mNG alone. Single focal plane. DPY-9::mNG stripes are in the same focal planes as BLI-1::mSc, whereas DPY-13 was more basal but partly overlapping. All images of young adult animals within 24 h of the L4/Adult molt. Scales 10 μm, insets all 10 μm wide.
Fig. 4
Fig. 4. Development of BLI puncta during L4 stage. (See also Supplementary Movies 1, 2).
a BLI-1::mNG(ju1789) during L4 development, lateral views of midbody. BLI-1 secretion and localization appeared to occur from L4.5-L4.8, i.e. between 5 and 8 h from the beginning of the L4 stage. Beginning in L4.5, BLI-1::mNG localized to single furrow-like bands, followed by double furrow-flanking bands in L4.6, which then became progressively more punctate from L4.7–9. By late L4, BLI-1::mNG puncta in dorsoventral epidermis overlying muscle (dashed red bracket) are generally brighter than those over lateral epidermis. b BLI-2::mNG (syb3293) was first visible in diffuse bands in the middle of furrows, then at furrow-flanking bands, then condensed into puncta approximately at the same stage as BLI-1::mNG. BLI-2::mNG also localized diffusely in seam cells from L4.3 (see Fig. S4b) and subsequently in lateral alae. c BLI-6::mNG(ju1914) was generally fainter than BLI-1::mNG or BLI-2::mNG in L4 stage but also initially appeared at furrows (L4.4), then at furrow-flanking bands (L4.5–6), then in puncta (L4.6–9). In the early L4 stage BLI-6::mNG was more visible in the cuticle overlying lateral epidermis and then spread dorsally and ventrally. Alae expression of BLI-6::mNG becomes prominent at L4.7 stage. Conventional confocal, MIP of 2–4 focal planes. Scales, 10 μm; insets 10 μm wide. d Still images from a 25 μm2 square ROI of Supplementary Movie 1 of BLI-1::mNG(ju1789) every 10 min. Furrow positions are indicated by blue arrows and two nascent puncta are indicated, one early-forming punctum used as fiduciary marker (solid red arrowhead) and a later-forming punctum in a central row (hollow red arrowhead). Brightness has been automatically adjusted and images smoothened from the original video. e Still images as in (d) showing a large punctum (arrowhead) forming by apparent fusion of adjacent puncta at ~35 min. f Quantitation of brightness (arbitrary units) of individual BLI-1::mNG puncta from Supplementary Movie 1 in four representative circular ROIs (area 0.2 μm2) imaged every 2.5 min. Two early-forming puncta (black, gray) and two later-forming puncta (light, dark blue) are plotted. Overt puncta formation (arrows) corresponds to a rapid increase in mean brightness over 5–10 min followed by a slower increase over the subsequent 30–40 min.
Fig. 5
Fig. 5. Nanoscale organization of BLI collagens.
a Cylindrical architecture of struts in 3D-SIM imaging as visualized by BLI-1::mNG(ju1789) and BLI-2::mNG(syb3293). Single focal planes; BLI-1::mNG inset 4 μm wide, inverted grayscale. Scales, 1 μm. Average feature MCNR = 12.2 (BLI-1::mNG) and 13.5 (BLI-2::mNG). b 3D rendering and enlargement of single BLI-2::mNG strut (boxed in panel a) in 4 z-sections (125 nm steps), before and after bicubic interpolation (scales: 100 nm). Grid lines in rendering are spaced at 0.1 μm intervals in x and y axis and 0.05 μm in z. c Representative line scans (subpixel point-to-point measurement, Softworx) across single BLI-1::mNG and BLI-2::mNG struts (marked with red arrows in a). Mean peak-to-peak diameter for struts exhibiting non-fluorescence centers was 161 ± 29 nm for BLI-1::mNG (SD, n = 110 struts) and 150 nm ± 22 nm for BLI-2::mNG (n = 86). d Precise colocalization of BLI-1::mNG (green) and BLI-2:: HaloTag(syb4687) stained with JF549 (magenta) in 3D-SIM. Insets (boxed) are 4 μm wide, Scale 4 μm or 2 μm in inset. Average feature MCNR = 8.2 (BLI-1::mNG), 9.1 (BLI-2::HT). Note that the non-fluorescent strut centers are less evident for BLI-2::mNG due to lower resolution at 588 nm. In some cases BLI-2::HT localized to smaller structures than the BLI-1::mNG rings (red arrows), consistent with the slightly smaller BLI-2::mNG ring width compared to BLI-1::mNG. e Columnar organization of furrow-associated collagens. DPY-7::sfGFP(qxIs722) in furrow regions as visualized in 3D-SIM. Single focal plane (scale 2 μm) and 4 × 125 nm z planes (ROI boxed in left-hand panel), scale 100 nm. Average feature MCNR = 7.3. Comparison image (MIP of z-stack of 8 × 125 nm planes) of DPY-3::mNG showing heterogeneity within furrows, as imaged with OMX widefield and deconvolution; scale 2 μm. f BLI-1::mNG (green) and DPY-7::mKate (magenta) localization in overlapping focal planes of medial layer (cf. Fig. 3g). Single focal plane from 3D-SIM (left) and 3D rendering of DPY-7 columns (magenta) and BLI-1::mNG struts (green). Scale, 2 μm. Average feature MCNR = 11.7 (BLI-1::mNG) and 4.0 (DPY-7::mKate). All images are of young adult animals within 24 h of the L4/Adult molt.
Fig. 6
Fig. 6. Interactions between BLI collagens.
a bli-6(ju1681) enhances blistering in bli-1(0) mutants. Dissection scope images of representative animals between 3 and 48 h post L4/adult molt. bli-1(0) mutants display small blisters (arrows) within 3–5 h of the L4/adult molt and are severely blistered by 9 h. Double mutants display more widespread blisters by 9 h (arrows) and are often dead by 48 h. Similar enhancement was observed between bli-2(0) and bli-6(0); n = 10 animals observed longitudinally per genotype. Scale, 250 μm. b BLI-1::mNG(ju1789) puncta are mostly absent in bli-2(0), but occasional sparse and randomly organized puncta are seen in some regions. Confocal image enhanced relative to wild type to detect fainter puncta. c In bli-6(ju1681), BLI-1::mNG(ju1789) puncta are aberrantly distributed such that the central row puncta are brighter relative to furrow-flanking rows. d In bli-6(mn4), BLI-1::mNG(ju1789) puncta are disorganized and restricted to regions overlying body wall muscles. e In bli-1(0) mutants, BLI-2::mNG localizes to faint bands on either side of blistered areas and to sparse puncta in the central annular row. f In bli-6(0) null mutants the distribution of BLI-2::mNG is altered such that the central row is stronger than lateral (furrow-flanking) rows. g In bli-6(mn4) gain of function mutants, BLI-2::mNG puncta are reduced and disorganized and restricted to areas of cuticle overlying muscle. Exposures of mutant images are enhanced compared with wild type. Maximum intensity projections of confocal z-stacks, scale 10 μm; insets are 10 μm wide. h Quantitation of BLI-1::mNG puncta size in bli-2(0), bli-6(0) and bli-6(gf) mutants. ****P < 0.0001, Kruskal–Wallis test and Dunn’s post test; error bars (orange) are SEM. i In the wild-type BLI-6::mNG(ju1914) localizes to struts and furrows; maximum intensity projection of head cuticle. In bli-1(0) mutants BLI-6::mNG puncta do not form; the remaining BLI-6::mNG localizes to furrow-like bands on the outer (cortical) and inner (basal) surfaces of blisters. Maximum intensity projections of 5–10 surface or deep confocal planes of BLI-6::mNG(ju1914); bli-1(0). Scales 10 μm, insets 10 μm wide. All images are of young adult animals within 24 h of the L4/Adult molt.
Fig. 7
Fig. 7. Genetic interactions between bli and other cuticle collagen mutants.
a Phenotypic interactions between cuticle morphology mutants (see Table S1). dpy-3 and dpy-5 cuticle morphological phenotypes (Dpy) are epistatic to bli-1 and bli-2 null phenotypes such that double mutants are Dpy non-Bli. dpy-17 bli double mutants are severely Dpy and Bli. bli lon-3 double mutants are normal in length and severely Bli. sqt-2 double mutants strongly suppress Bli; sqt-3(ts) double mutants at 20 °C (shown) display partial suppression of Bli. Scales, 200 μm. b Suppression of Bli phenotypes of bli-1(0) by dpy or sqt mutants does not restore BLI-2::mNG(syb3293) puncta. In non-Bli (suppressed) bli dpy-3 or bli sqt-2 double mutants, randomly scattered puncta are visible, similar to BLI-2::mNG in bli-1(0) single mutants (Fig. 6e). BLI-2::mNG localization to alae is normal. Boxes and insets 4 μm wide. c BLI-1::mNG localization in cuticle collagen mutants; representative images of BLI-1::mNG(ju1789). Longitudinal chains of puncta are indicated by red dashed lines. In mutants defective in furrow collagens such as dpy-3(e182), BLI-1 puncta form short rows in variable orientations in the cuticle overlying the lateral epidermal ridge; the cuticle overlying dorsoventral body wall muscle quadrants displays more extensive disorganization. The shorter puncta rows vary in longitudinal spacing and often branch or join. A few ectopic scattered puncta are seen in the lateral alae region (red arrowhead). In mutants such as the annulus collagen dpy-5(e61), circumferential BLI-1::mNG rows are mostly properly oriented but dorsoventral regions display chains of puncta aligned at an angle to the longitudinal axis (underlined with red dashed line). dpy-17 mutants display normal puncta size and distribution with some aberrantly oriented circumferential rows. lon-3 mutants display brighter puncta especially in central rows, correlating with increased annulus width. sqt-2(sc3) and sqt-3(sc63) mutants show widespread disorganization that is more severe laterally; partial circumferential rows are visible (e.g. in sqt-3). Maximum intensity projections of z-stacks, 10 μm wide. d BLI-1::mNG puncta are enlarged in furrow-defective mutants dpy-8 or dpy-9. Puncta measured in midbody as in Fig. 3b; n shown on bar chart. Statistics, Kruskal–Wallis test and Dunn’s post test, ****P < 0.0001; mean and SEM indicated. Images are of young adult animals within 24 h of the L4/Adult molt.

References

    1. Zheng SL, Adams JG, Chisholm AD. Form and function of the apical extracellular matrix: new insights from Caenorhabditis elegans, Drosophila melanogaster, and the vertebrate inner ear. Fac. Rev. 2020;9:27. doi: 10.12703/r/9-27. - DOI - PMC - PubMed
    1. Jayadev R, Sherwood DR. Basement membranes. Curr. Biol. 2017;27:R207–R211. doi: 10.1016/j.cub.2017.02.006. - DOI - PubMed
    1. Fidler, A. L. et al. Collagen IV and basement membrane at the evolutionary dawn of metazoan tissues. Elife10.7554/eLife.24176 (2017). - PMC - PubMed
    1. Jayadev R, et al. A basement membrane discovery pipeline uncovers network complexity, regulators, and human disease associations. Sci. Adv. 2022;8:eabn2265. doi: 10.1126/sciadv.abn2265. - DOI - PMC - PubMed
    1. Lenoir M, Puel JL, Pujol R. Stereocilia and tectorial membrane development in the rat cochlea. A SEM study. Anat. Embryol. 1987;175:477–487. doi: 10.1007/BF00309683. - DOI - PubMed

Publication types

MeSH terms