

Oral microbiota disorder in GC patients revealed by 2b-RAD-M
- PMID: 37980457
- PMCID: PMC10656981
- DOI: 10.1186/s12967-023-04599-1
Oral microbiota disorder in GC patients revealed by 2b-RAD-M
Abstract
Background: Microbiota alterations are linked with gastric cancer (GC). However, the relationship between the oral microbiota (especially oral fungi) and GC is not known. In this study, we aimed to apply 2b-RAD sequencing for Microbiome (2b-RAD-M) to characterize the oral microbiota in patients with GC.
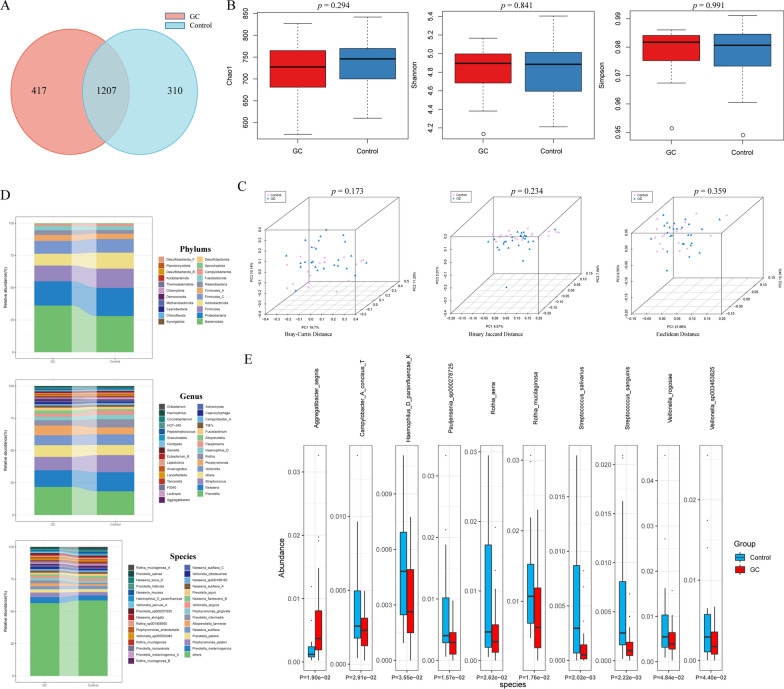
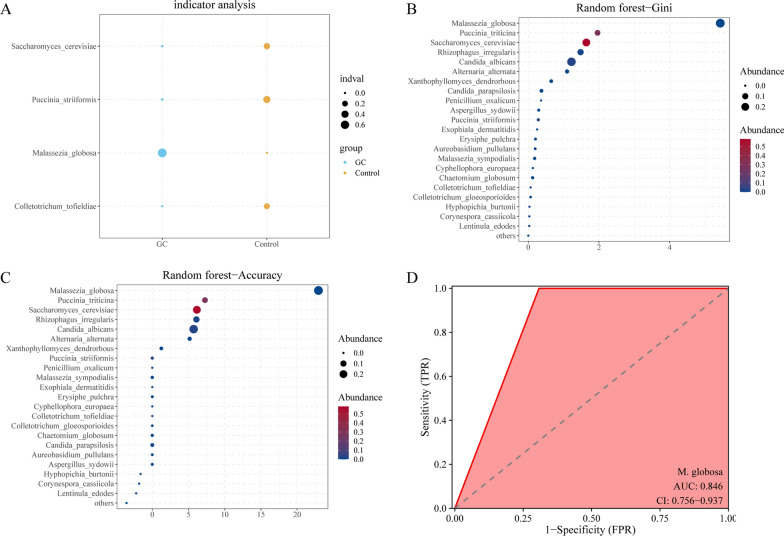
Methods: We performed 2b-RAD-M analysis on the saliva and tongue coating of GC patients and healthy controls. We carried out diversity, relative abundance, and composition analyses of saliva and tongue coating bacteria and fungi in the two groups. In addition, indicator analysis, the Gini index, and the mean decrease accuracy were used to identify oral fungal indicators of GC.
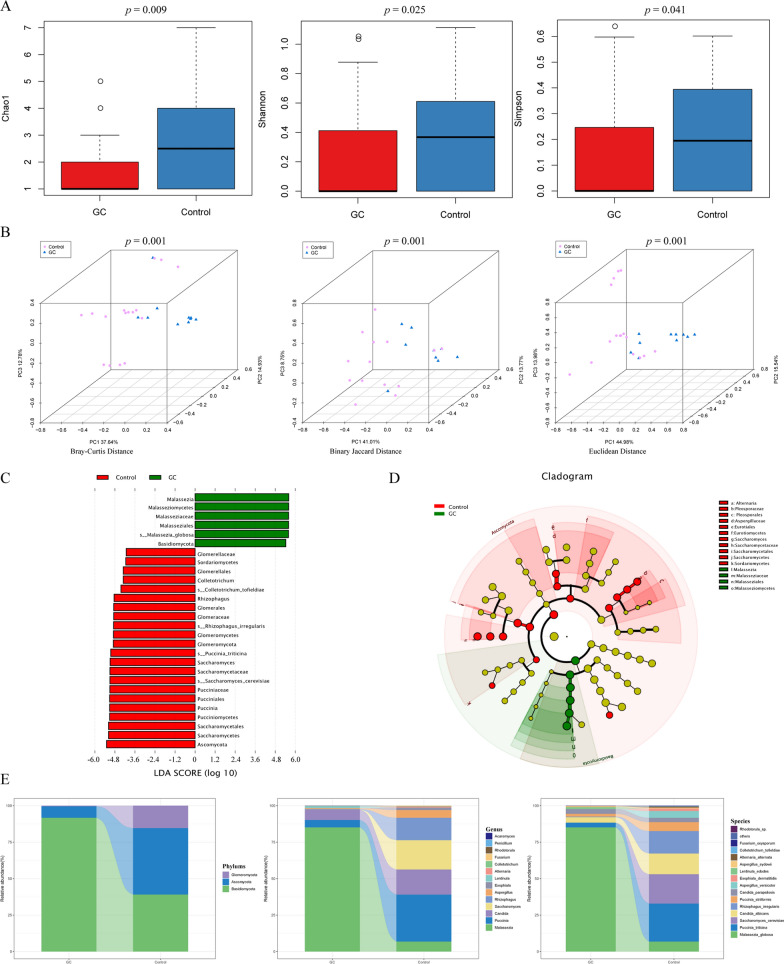
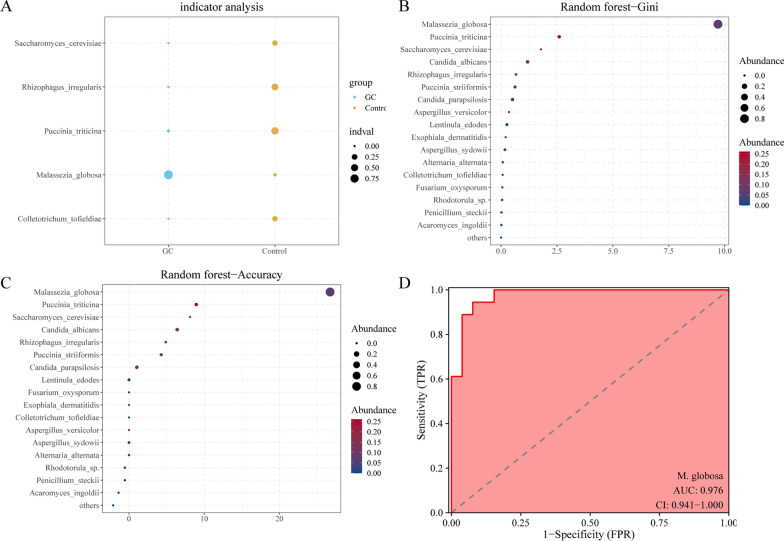
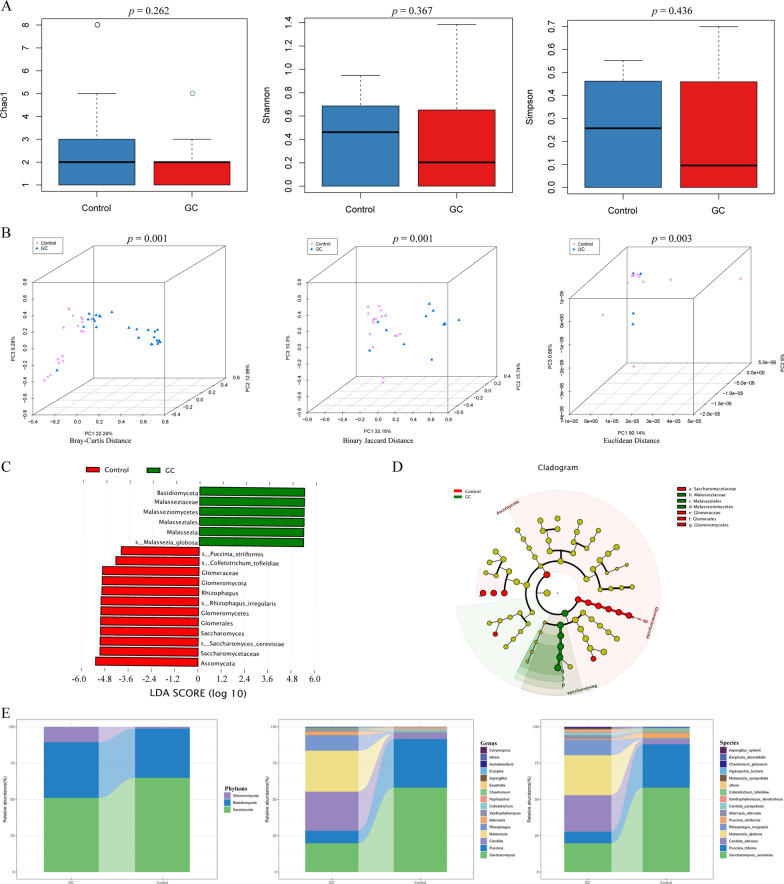
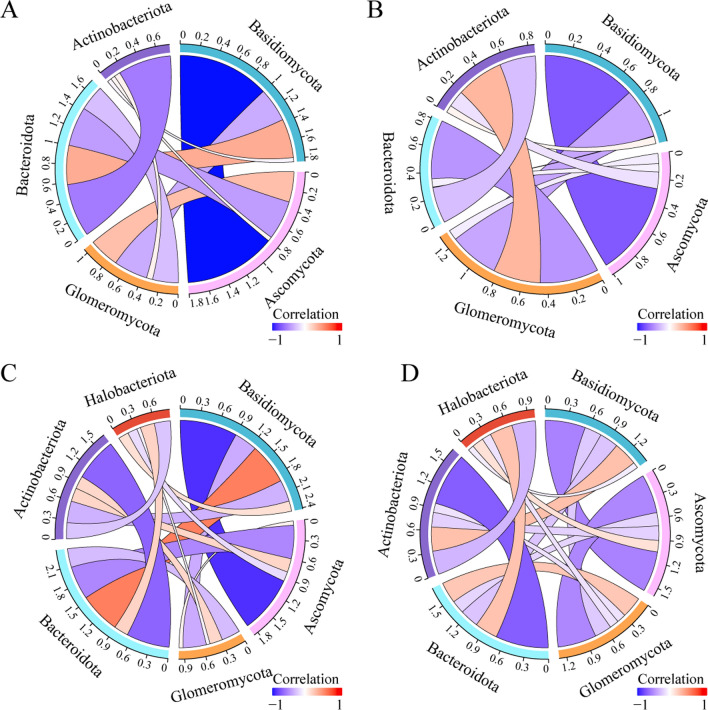
Results: In this study, fungal imbalance in the saliva and tongue coating was observed in the GC group. At the species level, enriched Malassezia globosa (M. globosa) and decreased Saccharomyces cerevisiae (S. cerevisiae) were observed in saliva and tongue coating samples of the GC group. Random forest analysis indicated that M. globosa in saliva and tongue coating samples could serve as biomarkers to diagnose GC. The Gini index and mean decreases in accuracy for M. globosa in saliva and tongue coating samples were the largest. In addition, M. globosa in saliva and tongue coating samples classified GC from the control with areas under the receiver operating curve (AUCs) of 0.976 and 0.846, respectively. Further ecological analysis revealed correlations between oral bacteria and fungi.
Conclusion: For the first time, our data suggested that changes in oral fungi between GC patients and controls may help deepen our understanding of the complex spectrum of the different microbiotas involved in GC development. Although the cohort size was small, this study is the first to use 2b-RAD-M to reveal that oral M. globosa can be a fungal biomarker for detecting GC.
Keywords: 2b-RAD-M; Biomarker; Gastric cancer; Oral fungi.
© 2023. The Author(s).
Conflict of interest statement
The authors declare no competing interest.
Figures
Similar articles
-
Oral microbiota and gastric cancer: recent highlights and knowledge gaps.J Oral Microbiol. 2024 Aug 16;16(1):2391640. doi: 10.1080/20002297.2024.2391640. eCollection 2024. J Oral Microbiol. 2024. PMID: 39161727 Free PMC article. Review.
-
Tongue Coating Bacteria as a Potential Stable Biomarker for Gastric Cancer Independent of Lifestyle.Dig Dis Sci. 2021 Sep;66(9):2964-2980. doi: 10.1007/s10620-020-06637-0. Epub 2020 Oct 12. Dig Dis Sci. 2021. PMID: 33044677
-
Microbial biomarkers of common tongue coatings in patients with gastric cancer.Microb Pathog. 2019 Feb;127:97-105. doi: 10.1016/j.micpath.2018.11.051. Epub 2018 Nov 30. Microb Pathog. 2019. PMID: 30508628
-
Oral bacteriome and mycobiome of patients with idiopathic membranous nephropathy with different tongue coatings treated with a Chinese herbal formula.J Ethnopharmacol. 2024 Sep 15;331:118233. doi: 10.1016/j.jep.2024.118233. Epub 2024 Apr 28. J Ethnopharmacol. 2024. PMID: 38685365
-
Tongue-coating microbiome as a cancer predictor: A scoping review.Arch Oral Biol. 2021 Dec;132:105271. doi: 10.1016/j.archoralbio.2021.105271. Epub 2021 Sep 27. Arch Oral Biol. 2021. PMID: 34610507
Cited by
-
Oral microbiota and gastric cancer: recent highlights and knowledge gaps.J Oral Microbiol. 2024 Aug 16;16(1):2391640. doi: 10.1080/20002297.2024.2391640. eCollection 2024. J Oral Microbiol. 2024. PMID: 39161727 Free PMC article. Review.
-
Microbiota and gastric cancer: from molecular mechanisms to therapeutic strategies.Front Cell Infect Microbiol. 2025 Jun 3;15:1563061. doi: 10.3389/fcimb.2025.1563061. eCollection 2025. Front Cell Infect Microbiol. 2025. PMID: 40529304 Free PMC article. Review.
-
Mycobiome: an underexplored kingdom in cancer.Microbiol Mol Biol Rev. 2025 Jun 25;89(2):e0026124. doi: 10.1128/mmbr.00261-24. Epub 2025 Mar 14. Microbiol Mol Biol Rev. 2025. PMID: 40084887 Review.
-
Metagenomic Characterization and Comparative Analysis of Removable Denture-Wearing and Non-Denture-Wearing Individuals in Healthy and Diseased Periodontal Conditions.Microorganisms. 2024 Jun 13;12(6):1197. doi: 10.3390/microorganisms12061197. Microorganisms. 2024. PMID: 38930579 Free PMC article.
-
Unveiling early-life microbial colonization profile through characterizing low-biomass maternal-infant microbiomes by 2bRAD-M.Front Microbiol. 2025 Jan 24;16:1521108. doi: 10.3389/fmicb.2025.1521108. eCollection 2025. Front Microbiol. 2025. PMID: 39927261 Free PMC article.
References
Publication types
MeSH terms
Grants and funding
- 81973983/National Natural Science Foundation of China
- 82270015/National Natural Science Foundation of China
- 82100017/National Natural Science Foundation of China
- 2021lcxk006/the joint construction project of clinical medicine university and hospital
- 2208085MH264/the Natural Science Foundation in Anhui Province
LinkOut - more resources
Full Text Sources
Medical
Miscellaneous
