. 2023 Nov 18;22(1):199.
doi: 10.1186/s12944-023-01971-4.

Altered fecal bile acid composition in active ulcerative colitis

Affiliations

Altered fecal bile acid composition in active ulcerative colitis

Stefanie Sommersberger et al. Lipids Health Dis. .

Abstract

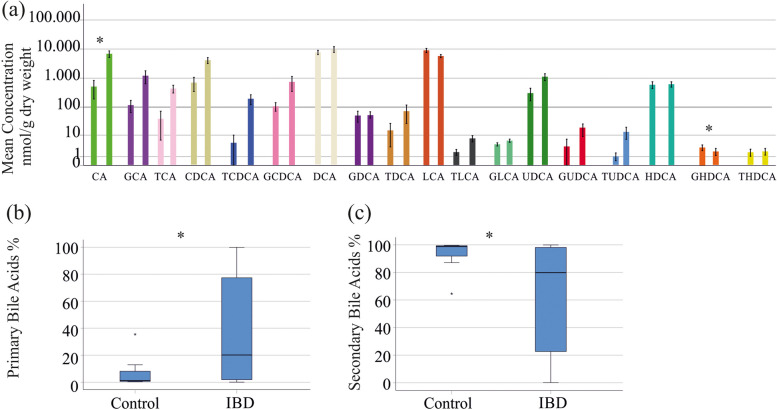
Background: Disturbed bile acid homeostasis associated with a rise of primary and a decline of secondary bile acids is a consistent finding in inflammatory bowel diseases (IBDs). Whether fecal bile acids may emerge as biomarkers for IBD diagnosis and disease severity is less clear. Our study aimed to identify associations of 18 fecal bile acid species with IBD entity and disease activity.

Methods: Stool samples of 62 IBD patients and 17 controls were collected. Eighteen fecal bile acid species were quantified by LC-MS/MS using stable isotope dilution. Lipid levels normalized to a dry weight of the fecal homogenates and ratios of single bile acid species to total bile acid levels were used for calculations.

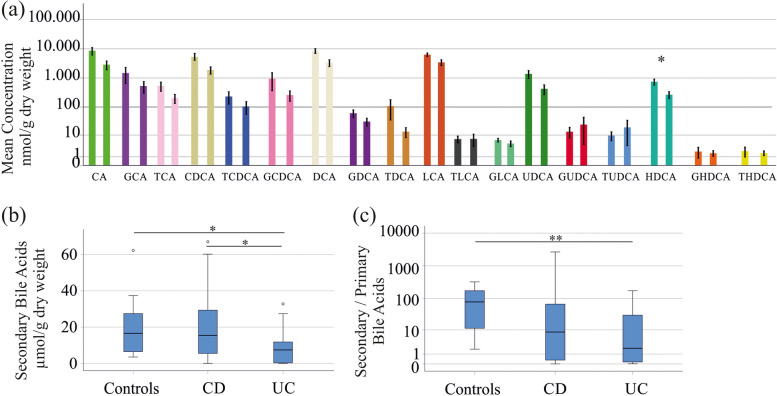
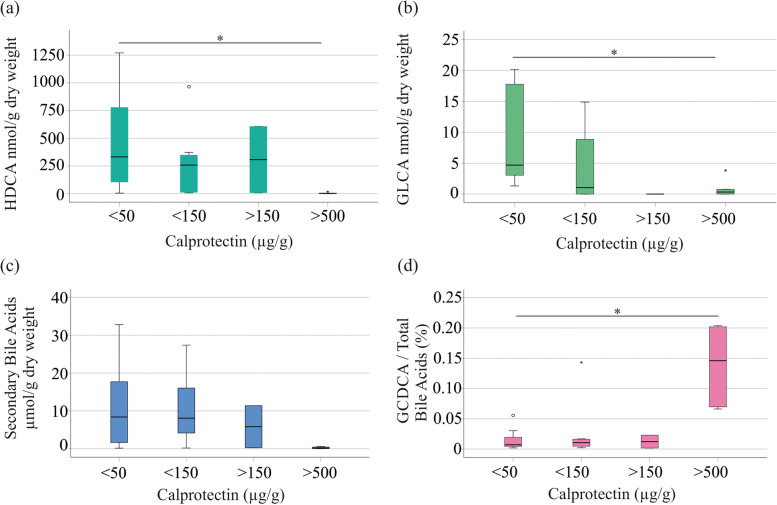
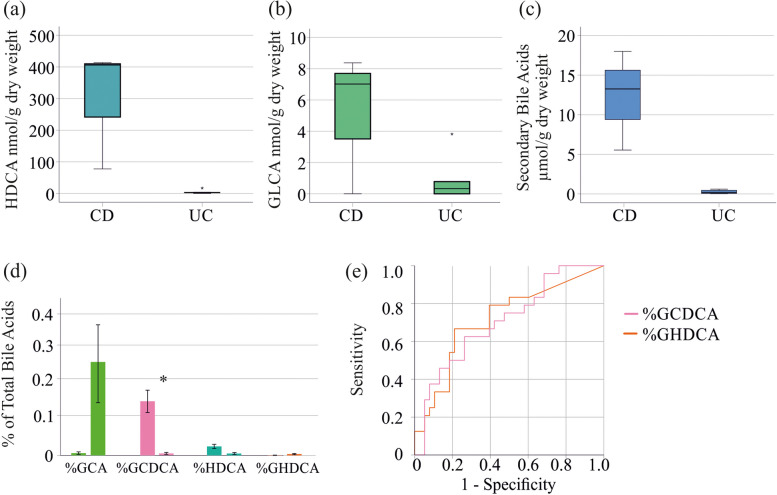
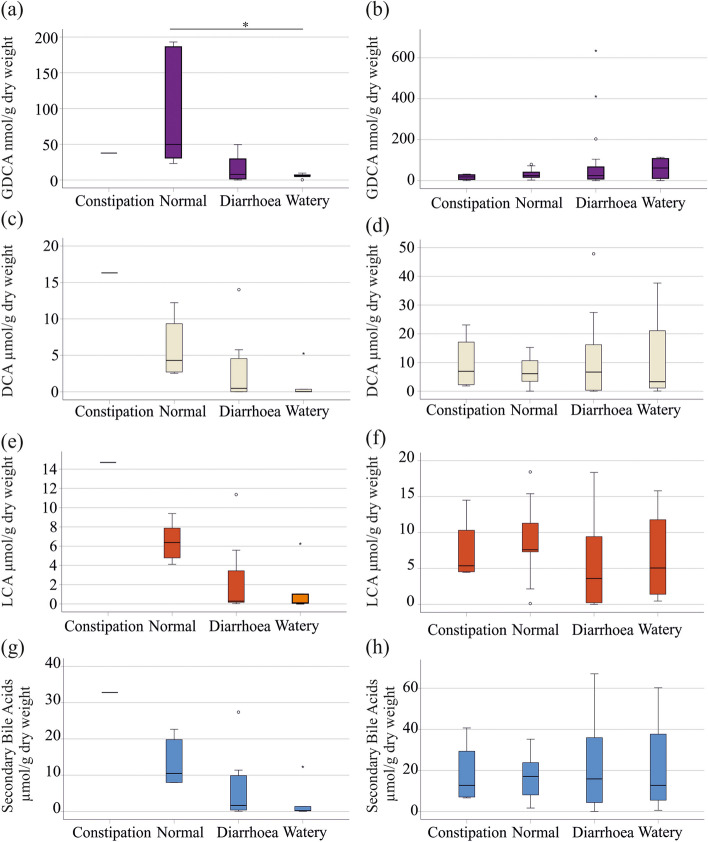
Results: IBD patients exhibited altered primary and secondary bile acid ratios in stool, with notable distinctions between ulcerative colitis (UC) compared to Crohn's disease (CD) and healthy controls. Fecal calprotectin was negatively correlated with glycolithocholic acid (GLCA) and hyodeoxycholic acid (HDCA) in UC. These bile acids were reduced in stool of UC patients with fecal calprotectin levels > 500 µg/g compared to UC patients with low calprotectin levels. Moreover, negative associations of six secondary bile acids with C-reactive protein (CRP) existed in UC. In CD patients, fecal bile acids did not correlate with CRP or fecal calprotectin. Diarrhoea is common in IBD, and UC patients with diarrhoea had reduced deoxycholic acid (DCA), glycine conjugated DCA (GDCA) and lithocholic acid in stool in contrast to patients with normal stool consistency. Fecal bile acid levels were not associated with diarrhoea in CD patients. UC patients treated with mesalazine had increased levels of fecal GDCA whereas no such changes were observed in CD patients. Bile acid levels of CD and UC patients treated with biologicals or corticosteroids did not change. Relative levels of GHDCA (specificity: 79%, sensitivity: 67%) and glycochenodeoxycholic acid (specificity: 74%, sensitivity: 63%) were the most specific to distinguish UC from CD.

Conclusion: Disrupted fecal bile acid homeostasis is associated with disease severity and disease symptoms in UC but not in CD, potentially aiding in distinguishing IBD subtypes and classifying the pathophysiology of diarrhoea in UC.

Keywords: Bile acids; Cholic acid; Crohn´s Disease; Deoxycholic acid; Fecal calprotectin; Ulcerative Colitis.


Conflict of interest statement

The authors declare no competing interests.

Figures

Fig. 1
Fig. 1
Comparison of fecal bile acid levels between patients with IBD and controls. a Concentrations of bile acid species in stool of healthy controls (left bars) and IBD patients (right bars). Data are shown in a logarithmic scale to improve the visualization of low abundant bile acid species; b Levels of primary bile acids relative to total bile acid concentrations of IBD patients and controls; c Levels of secondary bile acids relative to total bile acid concentrations of IBD patients and controls. * P < 0.05
Fig. 2
Fig. 2
Fecal bile acids of CD and UC patients. a Fecal bile acids in stool of CD patients (left bars) and UC patients (right bars). Data are shown in a logarithmic scale to improve the visualization of different levels; b Secondary bile acids in stool of controls, CD and UC patients; c Ratio of secondary to primary bile acids in stool of controls, CD and UC patients. Data are shown in a logarithmic scale to improve the visualization of different levels. * P < 0.05, ** P < 0.01
Fig. 3
Fig. 3
Relationship of fecal bile acids and fecal calprotectin. a HDCA levels in stool of UC patients with fecal calprotectin levels < 50 µg/g (8 patients), < 150 µg/g (8 patients), > 150 µg/g (2 patients) and > 500 µg/g (5 patients). Fecal calprotectin level of one patient was not documented; b GLCA in stool of UC patients categorized according to fecal calprotectin levels; c Secondary bile acids in stool of UC patients categorized according to fecal calprotectin levels; d %GCDCA in feces of UC patients in relation to fecal calprotectin levels. * P < 0.05
Fig. 4
Fig. 4
Bile acid levels of patients with fecal calprotectin levels > 500 µg/g and receiver operating characteristic curve. (a) HDCA; (b) GLCA and (c) Secondary bile acids in feces of CD and UC patients with fecal calprotectin levels > 500 µg/g; (d) %GCA, %GCDCA, %HDCA and %GHDCA of patients with CD (left bars) and UC (right bars), all with fecal calprotectin levels > 500 µg/g; (e) Receiver operating characteristic curve for diagnosis of UC including all IBD patients
Fig. 5
Fig. 5
Relationship of fecal bile acids and stool consistency. a GDCA levels in stool of UC patients with constipation (1 patient), normal stool (6 patients), diarrhoea (12 patients) and watery stool (5 patients); b GDCA levels in stool of CD patients with constipation (4 patients), normal stool (9 patients), diarrhoea (21 patients) and watery stool (4 patients); (c) DCA in stool of UC patients described in a; d DCA in stool of CD patients described in b; e LCA in stool of UC patients described in a; f LCA in stool of CD patients described in b; g Secondary bile acids in stool of UC patients described in a; h Secondary bile acids in stool of CD patients described in b. * P < 0.05
Fig. 6
Fig. 6
Associations of fecal bile acids with mesalazine therapy of UC patients. a GDCA levels of UC patients treated or not treated with mesalazine; b GCA levels relative to total bile acid concentration of UC patients treated or not treated with mesalazine. * P < 0.05

References

    1. Albillos A, de Gottardi A, Rescigno M. The gut-liver axis in liver disease: pathophysiological basis for therapy. J Hepatol. 2020;72:558–577. doi: 10.1016/j.jhep.2019.10.003. - DOI - PubMed
    1. Kriaa A, Mariaule V, Jablaoui A, Rhimi S, Mkaouar H, Hernandez J, Korkmaz B, Lesner A, Maguin E, Aghdassi A, Rhimi M. Bile acids: key players in inflammatory bowel diseases? Cells. 2022;11:901. doi: 10.3390/cells11050901. - DOI - PMC - PubMed
    1. Bock KW. Human UDP-glucuronosyltransferases: feedback loops between substrates and ligands of their transcription factors. Biochem Pharmacol. 2012;84:1000–1006. doi: 10.1016/j.bcp.2012.07.009. - DOI - PubMed
    1. Gnewuch C, Liebisch G, Langmann T, Dieplinger B, Mueller T, Haltmayer M, Dieplinger H, Zahn A, Stremmel W, Rogler G, Schmitz G. Serum bile acid profiling reflects enterohepatic detoxification state and intestinal barrier function in inflammatory bowel disease. World J Gastroenterol. 2009;15:3134–3141. doi: 10.3748/wjg.15.3134. - DOI - PMC - PubMed
    1. Brown SJ, Mayer L. The immune response in inflammatory bowel disease. Am J Gastroenterol. 2007;102:2058–2069. doi: 10.1111/j.1572-0241.2007.01343.x. - DOI - PubMed