

Population impact of fine particulate matter on tuberculosis risk in China: a causal inference
- PMID: 37980514
- PMCID: PMC10657490
- DOI: 10.1186/s12889-023-16934-8
Population impact of fine particulate matter on tuberculosis risk in China: a causal inference
Abstract
Background: Previous studies have suggested the potential association between air pollution and tuberculosis incidence, but this association remains inconclusive and evidence to assess causality is particularly lacking. We aimed to draw causal inference between fine particulate matter less than 2.5 μm in diameter (PM2.5) and tuberculosis in China.
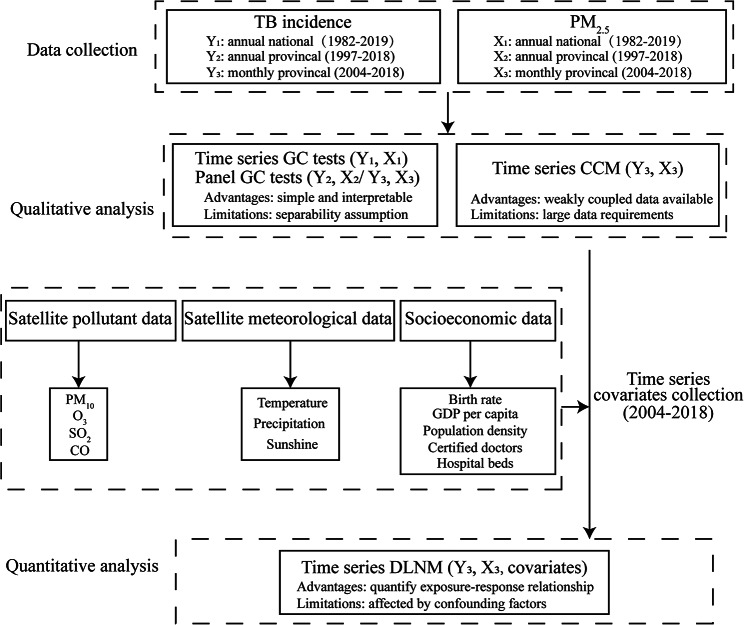
Methods: Granger causality (GC) inference was performed within vector autoregressive models at levels and/or first-differences using annual national aggregated data during 1982-2019, annual provincial aggregated data during 1982-2019 and monthly provincial aggregated data during 2004-2018. Convergent cross-mapping (CCM) approach was used to determine the backbone nonlinear causal association based on the monthly provincial aggregated data during 2004-2018. Moreover, distributed lag nonlinear model (DLNM) was applied to quantify the causal effects.
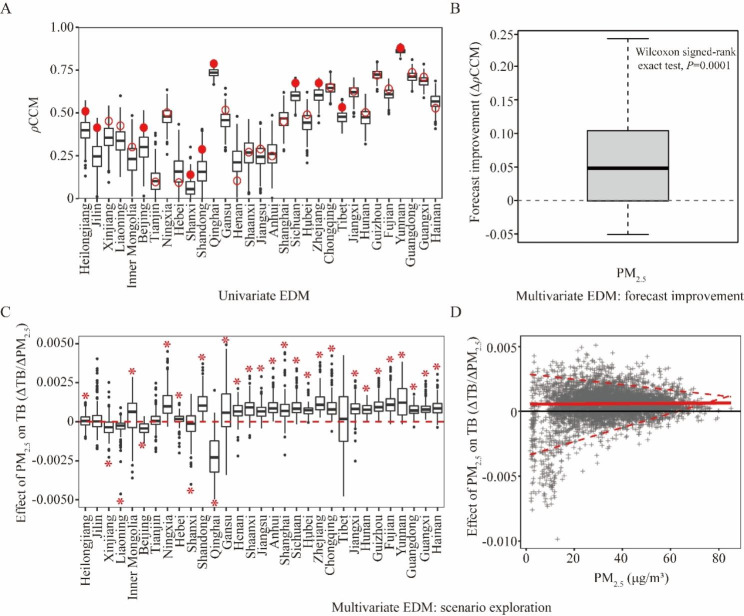
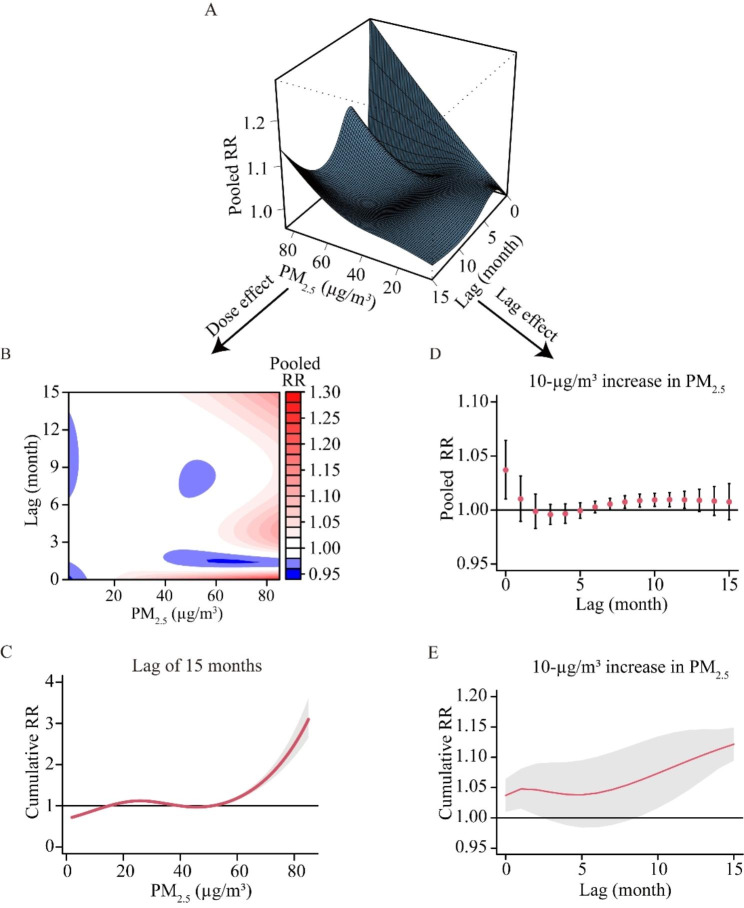
Results: GC tests identified PM2.5 driving tuberculosis dynamics at national and provincial levels in Granger sense. Empirical dynamic modeling provided the CCM causal intensity of PM2.5 effect on tuberculosis at provincial level and demonstrated that PM2.5 had a positive effect on tuberculosis incidence. Then, DLNM estimation demonstrated that the PM2.5 exposure driven tuberculosis risk was concentration- and time-dependent in a nonlinear manner. This result still held in the multi-pollutant model.
Conclusions: Causal inference showed that PM2.5 exposure driving tuberculosis, which showing a concentration gradient change. Air pollutant control may have potential public health benefit of decreasing tuberculosis burden.
Keywords: Causality; Eco-driver; Empirical dynamic modeling; PM2.5; Tuberculosis.
© 2023. The Author(s).
Conflict of interest statement
Gang Qin is an editorial board member of BMC Public Health. The remaining authors have no conflicts of interest to declare.
Figures
References
-
- Chakaya J, Khan M, Ntoumi F, Aklillu E, Fatima R, Mwaba P, Kapata N, Mfinanga S, Hasnain SE, Katoto P, et al. Global Tuberculosis report 2020 - reflections on the global TB burden, treatment and prevention efforts. Int J Infect Dis. 2021;113(Suppl 1):7–S12. doi: 10.1016/j.ijid.2021.02.107. - DOI - PMC - PubMed
-
- Menzies NA, Quaife M, Allwood BW, Byrne AL, Coussens AK, Harries AD, Marx FM, Meghji J, Pedrazzoli D, Salomon JA, et al. Lifetime burden of Disease due to incident Tuberculosis: a global reappraisal including post-tuberculosis sequelae. Lancet Glob Health. 2021;9(12):e1679–87. doi: 10.1016/S2214-109X(21)00367-3. - DOI - PMC - PubMed
-
- Cheng Q, Trangucci R, Nelson KN, Fu W, Collender PA, Head JR, Hoover CM, Skaff NK, Li T, Li X, et al. Prenatal and early-life exposure to the great Chinese famine increased the risk of Tuberculosis in adulthood across two generations. Proc Natl Acad Sci U S A. 2020;117(44):27549–55. doi: 10.1073/pnas.2008336117. - DOI - PMC - PubMed
Publication types
MeSH terms
Substances
Grants and funding
LinkOut - more resources
Full Text Sources
Medical
Miscellaneous
