. 2023 Dec 26;42(12):113434.
doi: 10.1016/j.celrep.2023.113434. Epub 2023 Nov 18.

SERPINB3-MYC axis induces the basal-like/squamous subtype and enhances disease progression in pancreatic cancer

Affiliations

SERPINB3-MYC axis induces the basal-like/squamous subtype and enhances disease progression in pancreatic cancer

Yuuki Ohara et al. Cell Rep. .

Abstract

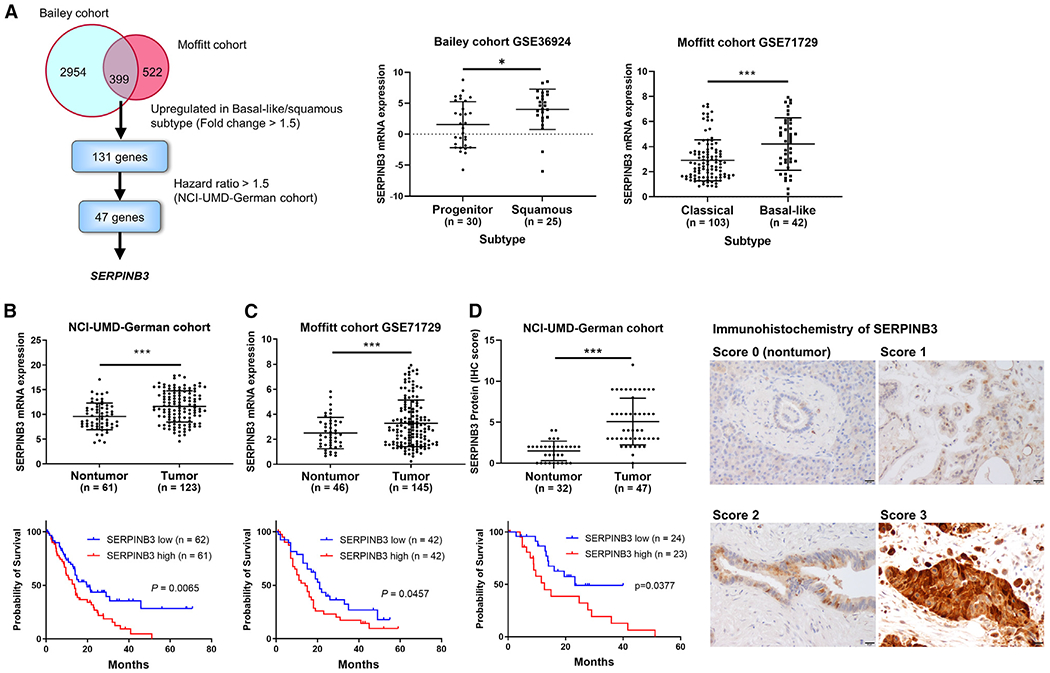
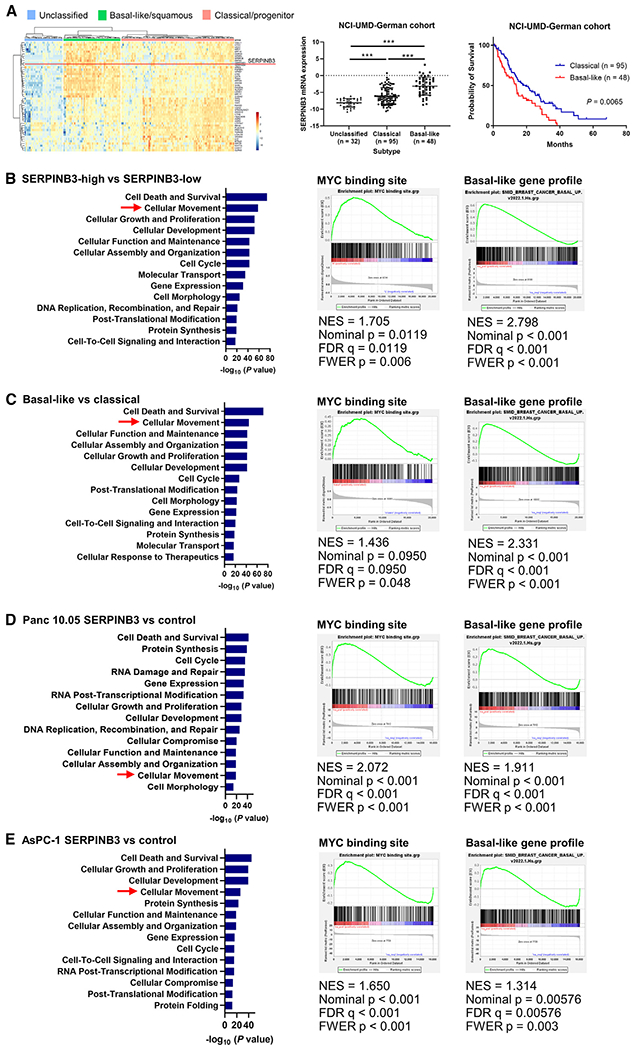
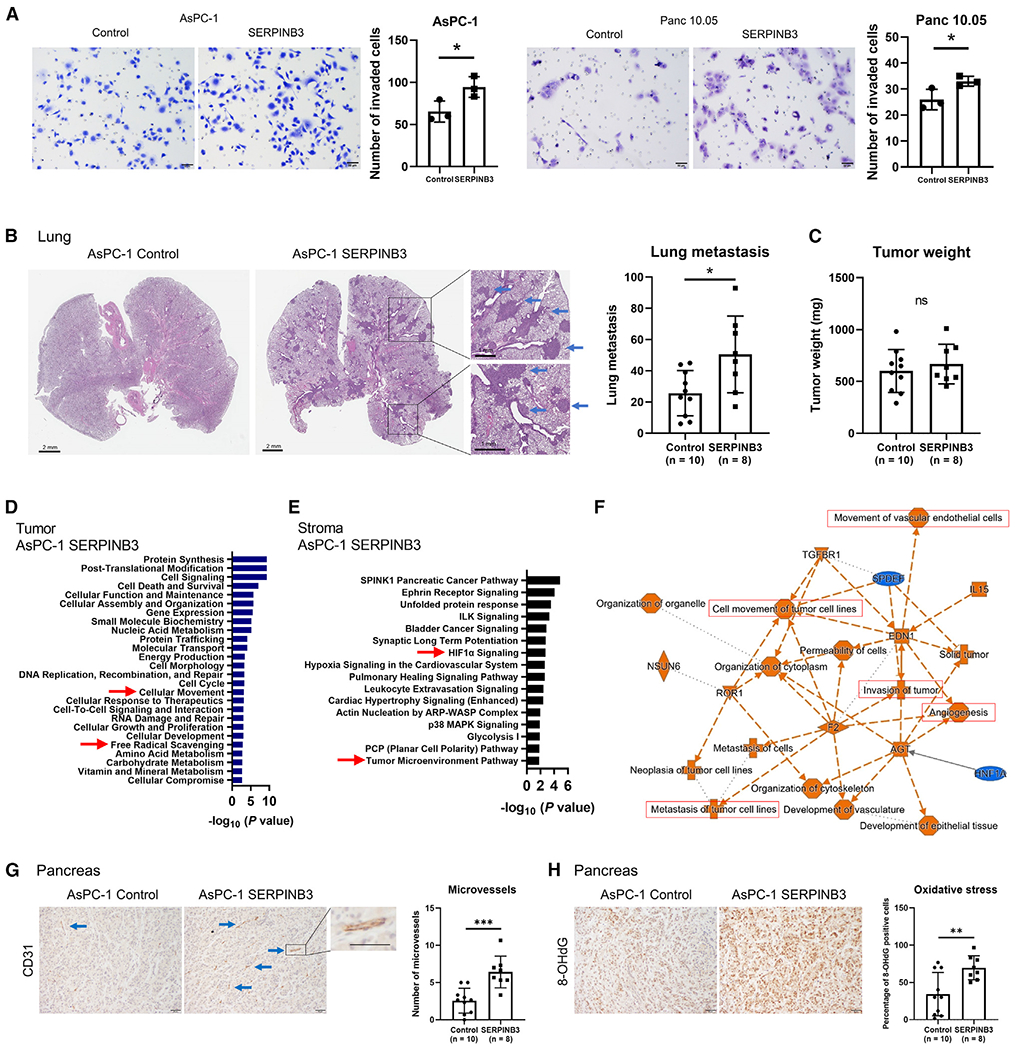
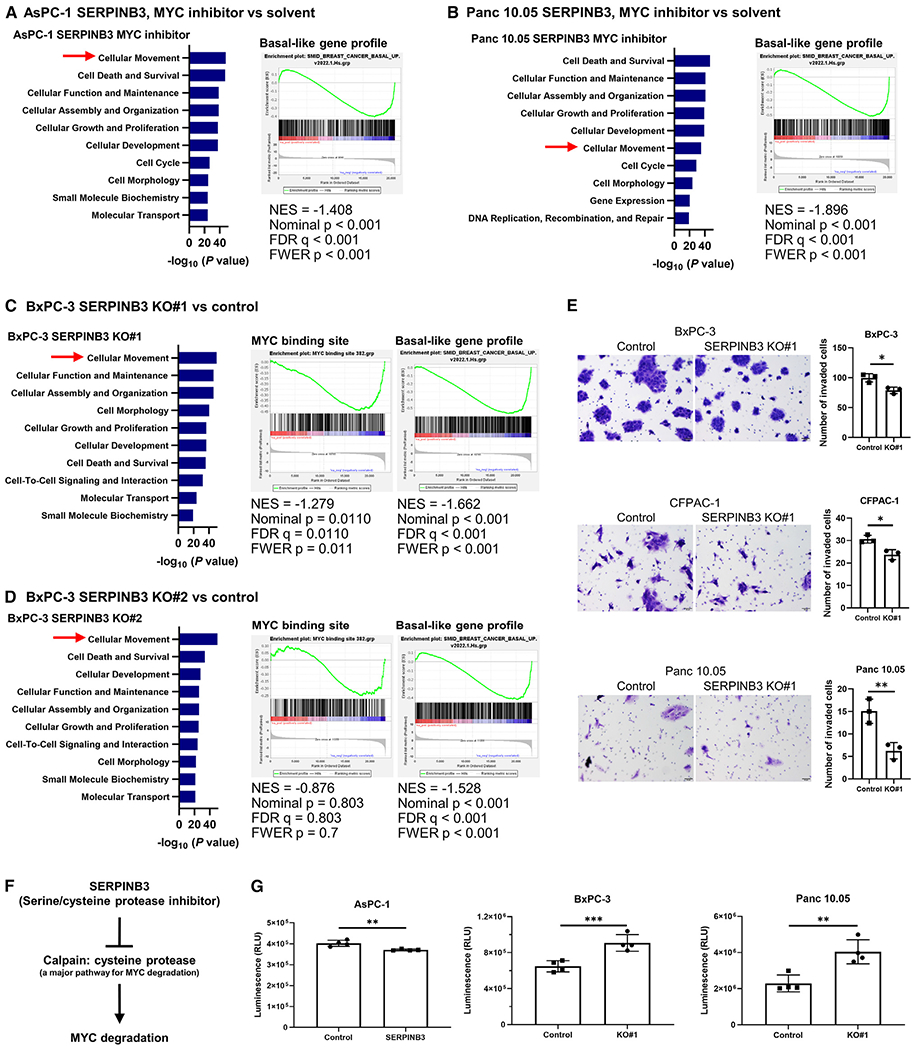
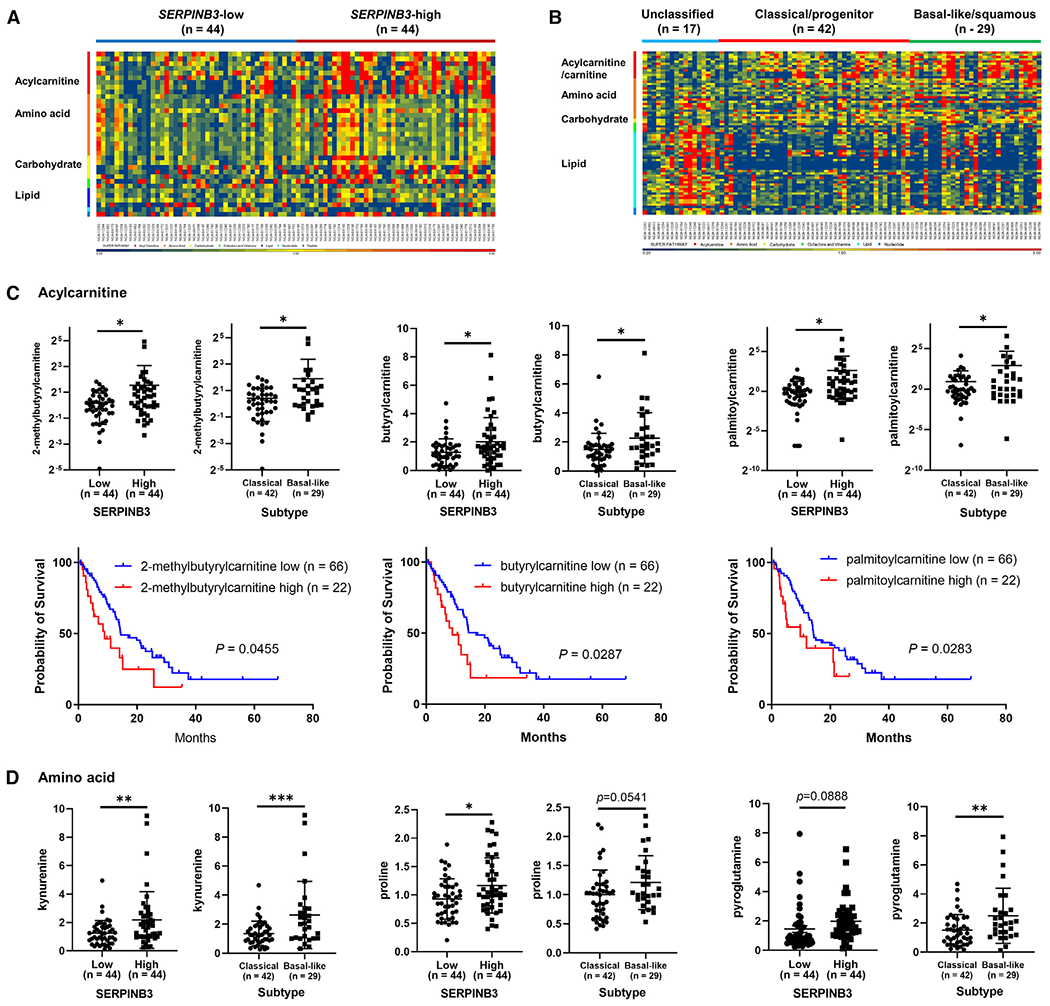
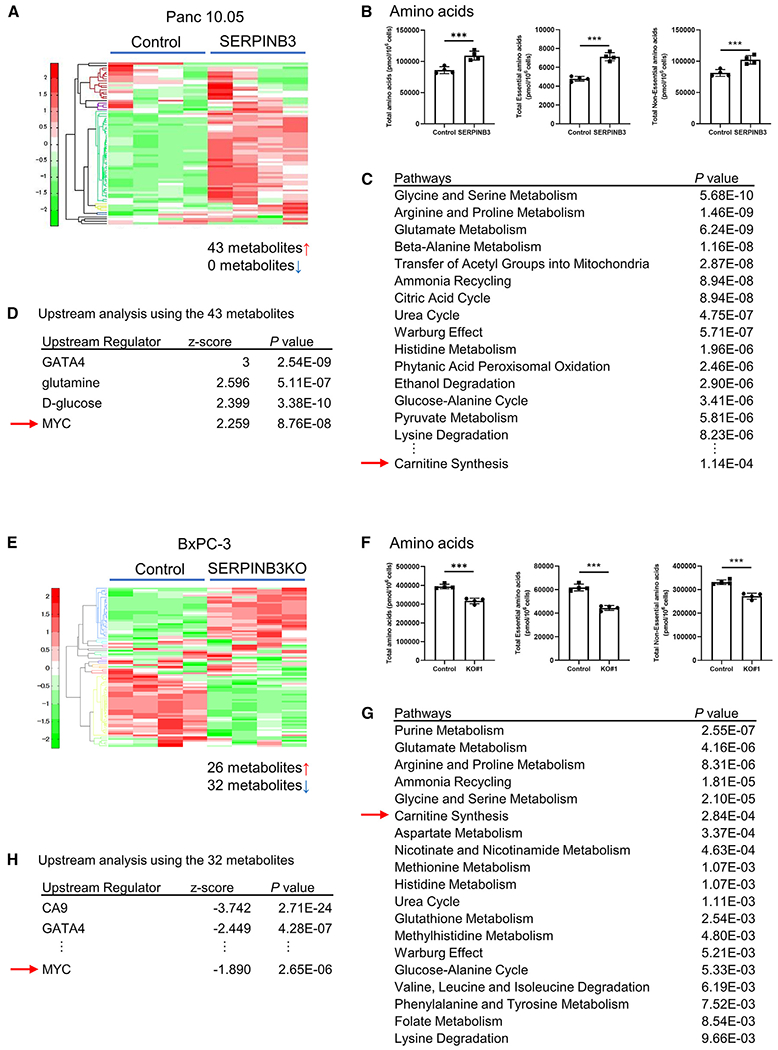
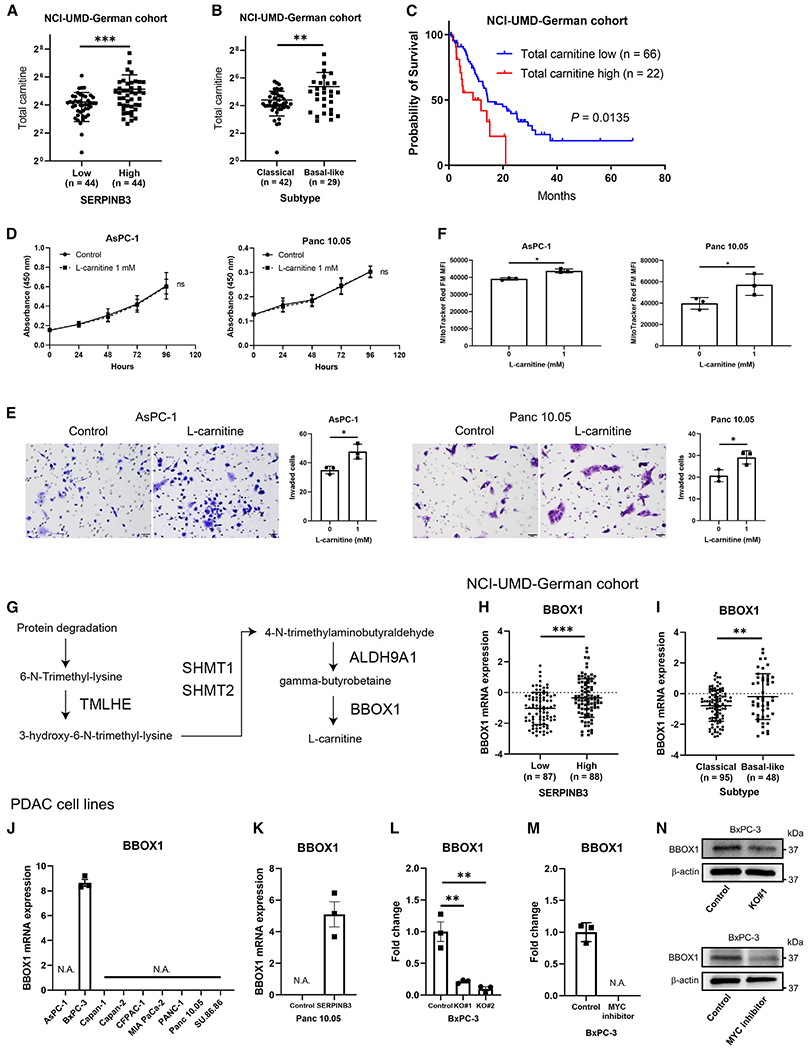
Pancreatic ductal adenocarcinoma (PDAC) exhibits distinct molecular subtypes: classical/progenitor and basal-like/squamous. Our study aimed to identify genes contributing to the development of the basal-like/squamous subtype, known for its aggressiveness. Transcriptome analyses revealed consistent upregulation of SERPINB3 in basal-like/squamous PDAC, correlating with reduced patient survival. SERPINB3 transgene expression in PDAC cells enhanced in vitro invasion and promoted lung metastasis in a mouse PDAC xenograft model. Metabolome analyses unveiled a metabolic signature linked to both SERPINB3 and the basal-like/squamous subtype, characterized by heightened carnitine/acylcarnitine and amino acid metabolism, associated with poor prognosis in patients with PDAC and elevated cellular invasiveness. Further analysis uncovered that SERPINB3 inhibited the cysteine protease calpain, a key enzyme in the MYC degradation pathway, and drove basal-like/squamous subtype and associated metabolic reprogramming through MYC activation. Our findings indicate that the SERPINB3-MYC axis induces the basal-like/squamous subtype, proposing SERPINB3 as a potential diagnostic and therapeutic target for this variant.

Keywords: BBOX1; CP: Cancer; CP: Metabolism; MYC; SERPINB3/SCCA1; amino acid; calpain; carnitine/acylcarnitine; metabolism; molecular subtype; pancreatic ductal adenocarcinoma; serine/cysteine proteinase inhibitor family B member 3.


Conflict of interest statement

Declaration of interests The authors declare no competing interest.

Figures

Figure 1.
Figure 1.. Transcriptome analysis identifies SERPINB3 as a marker upregulated in basal-like/squamous PDAC and associated with poor survival
(A) Strategy to find candidate driver genes of the basal-like/squamous subtype in PDAC. Two cohorts (Bailey and Moffitt) were interrogated to identify candidate driver genes of the basal-like/squamous subtype. The genes were narrowed down to those associated with patient survival in the NCI-UMD-German cohort. Data are presented as the mean ± SD. *p < 0.05, ***p < 0.005 by unpaired two-tailed Student’s t test. (B–D) Comparison of SERPINB3 transcript and protein expression levels in PDAC tumors versus adjacent noncancerous tissues, revealing upregulation of SERPINB3 in tumors in both the NCI-UMD-German cohort (mRNA via qPCR and protein via IHC) and the validation cohort (Moffitt cohort; GSE71729; mRNA). Data are presented as the mean ± SD. ***p < 0.005 by unpaired two-tailed Student’s t test. The bottom shows Kaplan-Meier plots and log-rank test results, highlighting the association of increased SERPINB3 expression with decreased PDAC patient survival. For the survival analysis in the NCI-UMD-German cohort (B and D), the comparison was conducted between patients in the upper and lower 50% of SERPINB3 levels. In the validation cohort (C), patients in the upper and lower tertiles of SERPINB3 expression were compared (total patient number = 125). The right side shows IHC of SERPINB3 in representative nontumor (score 0) and tumor tissues (scores 1–3). SERPINB3 protein was detected in both the nucleus and the cytoplasm, as shown by the brown DAB-based IHC in the tumor cells. The images show the staining strength (score 0, unstained; score 1, weak; score 2, moderate; score 3, strong). Scale bars, 20 μm. More details can be found in the STAR Methods. IHC, immunohistochemistry. See also Tables S1 and S2.
Figure 2.
Figure 2.. Upregulation of SERPINB3 promotes the characteristics of the basal-like/squamous subtype of PDAC
(A) The transcriptome of PDAC defines its molecular subtypes. Previously described gene signatures for molecular subtypes separated 175 patients of our NCI-UMD-German cohort into unclassified (n = 32), basal-like/squamous (n = 48), and classical/progenitor (n = 95) subtypes. In the middle, tumors defined as basal-like/squamous show upregulation of SERPINB3 mRNA expression. Data are presented as the mean ± SD; ***p < 0.005 by one-way ANOVA. On the right, the Kaplan-Meier plot and log-rank test show the reduced survival of patients with basal-like/squamous PDAC. (B–E) IPA (blue bars) and GSEA show similar pathway patterns, including enrichment of cellular movement, MYC activation,, and induction of the basal-like gene expression profile, in SERPINB3-high and basal-like/squamous PDAC tumors (B and C) and in human PDAC cell lines with SERPINB3 transgene overexpression (D and E). SERPINB3-low, n = 87, and SERPINB3-high, n = 88 in (B). Classical/progenitor subtype, n = 95, and basal-like/squamous subtype, n = 48 in (C). Panc 10.05 control, n = 4, and Panc 10.05 SERPINB3, n = 4 in (D). AsPC-1 control, n = 4, and AsPC-1 SERPINB3, n = 4 in (E). IPA, Ingenuity pathway analysis; GSEA, gene set enrichment analysis. See also Figure S1.
Figure 3.
Figure 3.. Upregulation of SERPINB3 promotes invasion and metastasis of PDAC
SERPINB3 transgene-expressing PDAC cells were examined to define the function of SERPINB3. (A) SERPINB3-overexpressing PDAC cells demonstrate an increased invasive ability. Cells that passed through a cell culture insert membrane coated with Matrigel were fixed, and the cells were counted. Data are presented as the mean ± SD of three independent experiments; *p < 0.05 by unpaired two-tailed Student’s t test. (B–H) Vector control and SERPINB3-overexpressing AsPC-1 human PDAC cells were transplanted into the pancreas of immune-deficient (NOD-SCID) mice. The mice were euthanized at 5 weeks, and both tumor burden and lung metastases were assessed. (B) The increased number of lung metastases in mice transplanted with AsPC-1 cells carrying the SERPINB3 transgene (shown in the graph to the right). Basophilic clusters indicate the metastatic lesions in sections of the lung (see arrows). Data are presented as the mean ± SD (AsPC-1 control, n = 10 mice; AsPC-1 SERPINB3, n = 8 mice); *p < 0.05 by unpaired two-tailed Student’s t test. (C) Upregulation of SERPINB3 does not increase the weight of the primary tumor xenografts in the pancreas. Data are presented as the mean ± SD (AsPC-1 control, n = 10 mice; AsPC-1 SERPINB3, n = 8 mice); ns, not significant by unpaired two-tailed Student’s t test. (D) Pathway enrichment analysis using IPA for the primary tumor xenografts from SERPINB3-overexpressing AsPC-1 versus vector control cells. IPA indicates the activation of a set of pathways, including “cellular movement” and “free radical scavenging,” in SERPINB3-overexpressing AsPC-1, consistent with increased invasion (A) and oxidative stress (Figure S2) in these tumors. (E and F) Pathway enrichment analysis using IPA for the tumor stroma from xenografts of SERPINB3-overexpressing AsPC-1 versus vector control cells. The stroma in AsPC-1 SERPINB3 xenografts exhibits activation of pathways associated with “HIF1α” and “tumor microenvironment,” including “angiogenesis” and “metastasis/invasion/cell movement.” (G) The density of microvessels (angiogenesis) in the tumor xenografts examined by IHC for CD31. Microvessel density is increased in the stroma of SERPINB3-overexpressing AsPC-1 xenografts (arrows). Scale bars, 50 μm. Data are presented as the mean ± SD (AsPC-1 control, n = 10 mice; AsPC-1 SERPINB3, n = 8 mice); ***p < 0.005 by unpaired two-tailed Student’s t test. (H) IHC for 8-OHdG, a marker of oxidative stress, in the tumor xenografts. The percentage of 8-OHdG-positive cells, indicating the level of oxidative stress, was assessed. The level of oxidative stress is increased in SERPINB3-overexpressing AsPC-1 xenografts. Scale bars, 50 μm. Data are presented as the mean ± SD (AsPC-1 control, n = 10 mice; AsPC-1 SERPINB3, n = 8 mice); **p < 0.01 by unpaired two-tailed Student’s t test. 8-OHdG, 8-hydroxy-2′-deoxyguanosine; IHC, immunohistochemistry; IPA, Ingenuity pathway analysis. See also Figure S2.
Figure 4.
Figure 4.. SERPINB3 knockout and inhibition of MYC signaling abrogates the differentiation into the basal-like/squamous subtype of PDAC
(A–D) IPA (blue bars) and GSEA indicate similar pathway patterns following either treatment with a MYC inhibitor (10058-F4, 100 μM) (A and B) or SERPINB3 knockout (C and D), including enrichment of cellular movement and decreased basal-like/squamous differentiation, mirroring the observations made in SERPINB3-expressing PDAC cells as well as SERPINB3-high and basal-like/squamous PDAC tumors (Figure 2). (E) SERPINB3 knockout decreases the ability of PDAC cells to invade. Cells that passed through a cell culture insert membrane coated with Matrigel were fixed, and the cells were counted. Data are presented as the mean ± SD of three independent experiments; *p < 0.05, **p < 0.01 by unpaired two-tailed Student’s t test. (F) Calpain, a cysteine protease, is a key pathway for MYC degradation. (G) Calpain activity was reduced in the SERPINB3-overexpressing PDAC cell line (AsPC-1) but activated in SERPINB3-knockout PDAC cell lines (BxPC-3 and Panc 10.05). Data are presented as the mean ± SD (n = 4 for each group); **p < 0.01, ***p < 0.005 by unpaired two-tailed Student’s t test. IPA, Ingenuity pathway analysis; GSEA, gene set enrichment analysis. See also Figure S3.
Figure 5.
Figure 5.. Upregulation of acylcarnitine/carnitine and amino acid metabolism in both SERPINB3-high and basal-like/squamous PDAC tumors
(A and B) Heatmaps show metabolite patterns in human PDAC (n = 88) with high and low SERPINB3 expression level (A) or by tumor subtype (B). Red shows upregulation of metabolites, blue indicates low abundance. In (A), 32 metabolites were significantly increased and 3 were decreased in SERPINB3-high tumors compared with SERPINB3-low tumors (p < 0.05). SERPINB3-low, n = 44; SERPINB3-high, n = 44. In (B), 15 metabolites were significantly increased and 2 were decreased in the basal-like/squamous subtype compared with the classical/progenitor subtype (p < 0.05). Unclassified subtype, n = 17; classical/progenitor subtype, n = 42; basal-like/squamous subtype, n = 29. Acylcarnitines/carnitine, amino acids, and carbohydrates are increased in SERPINB3-high PDAC tumors and also in basal-like/squamous PDAC tumors. (C and D) Abundance patterns for individual acylcarnitines (C) and amino acids (D) by tumor SERPINB3 status and subtype. Data are presented as the mean ± SD. In the graphs of 2-methylbutyrylcarnitine and palmitoylcarnitine, negative values of standard deviation (−SD) are not shown on the logarithmic y axis; *p < 0.05, **p < 0.01, ***p < 0.005 by unpaired two-tailed Student’s t test. The bottom row in (C) shows Kaplan-Meier plots and log-rank test results demonstrating the association of each acylcarnitine with PDAC patient survival. The comparison was conducted between patients in the upper 25% quartile and the lower 75% of each acylcarnitine level. Higher levels of 2-methylbutyrylcarnitine, butyrylcarnitine, and palmitoylcarnitine were associated with poor patient survival. See also Tables S3 and S4.
Figure 6.
Figure 6.. SERPINB3 promotes carnitine and amino acid metabolism in PDAC cells
(A and B) Metabolome analysis covering 116 cancer-related metabolites in SERPINB3-overexpressing Panc 10.05 cells. In SERPINB3-overexpressing Panc 10.05 cells, 43 metabolites were significantly elevated compared with control cells (p < 0.05). The graphs highlight the increase in amino acid metabolism. Data are presented as the mean ± SD (n = 4 for each group); ***p < 0.005 by unpaired two-tailed Student’s t test. (C) Pathway enrichment scores using MetaboAnalyst 5.0 with 43 significantly elevated metabolites as input. It is shown that amino acid and carnitine metabolism and the Warburg effect are upregulated in SERPINB3-overexpressing Panc 10.05 cells. (D) Prediction of upstream regulators of metabolism in SERPINB3-overexpressing Panc 10.05 cells. The upstream analysis by IPA using the 43 input metabolites predicts upregulated MYC signaling in these cells. (E and F) Metabolome analysis covering 116 cancer-related metabolites in SERPINB3-knockout BxPC-3 cells. In these cells, 32 metabolites were significantly downregulated compared with control cells (p < 0.05). The graphs highlight the decrease in amino acid metabolism. Data are presented as the mean ± SD (n = 4 for each group); ***p < 0.005 by unpaired two-tailed Student’s t test. (G) Pathway enrichment scores using MetaboAnalyst 5.0 with 32 significantly decreased metabolites as input. It is shown that amino acid and carnitine metabolism and the Warburg effect are downregulated in SERPINB3-knockout BxPC-3 cells. (H) Prediction of upstream regulators of metabolism in SERPINB3-knockout BxPC-3 cells. The upstream analysis by IPA using the 32 input metabolites predicts downregulated MYC signaling in these cells. IPA, Ingenuity pathway analysis. See also Figures S4 and S5; Tables S5 and S6.
Figure 7.
Figure 7.. Carnitine enhances the disease progression in PDAC
(A and B) Total carnitine is elevated in both SERPINB3-high and basal-like/squamous PDAC in the NCI-UMD-German cohort. Data are presented as the mean ± SD (SERPINB3-low, n = 44; SERPINB3-high, n = 44; classical/progenitor subtype, n = 42; basal-like/squamous subtype, n = 29). Negative values of standard deviation (−SD) are not shown on the logarithmic y axis; **p < 0.01, ***p < 0.005 by unpaired two-tailed Student’s t test. (C) Kaplan-Meier plot and log-rank test showing that high total carnitine associates with poor survival of PDAC patients (the upper 25% quartile versus the lower 75%; total carnitine low <30.8, high ≥30.8). (D) L-carnitine has no effect on proliferation of PDAC cell lines (CCK-8/WST-8 assay). Data are presented as the mean ± SD of three independent experiments; ns, not significant, by two-way ANOVA. (E) L-carnitine increases invasiveness of PDAC cell lines. Cells that passed through a cell culture insert membrane coated with Matrigel were fixed, and the cells were counted. Data are presented as the mean ± SD of three independent experiments; *p < 0.05 by unpaired two-tailed Student’s t test. (F) Increased mitochondrial membrane potential in PDAC cell lines cultured with 1 mM L-carnitine for 48 h. Mitochondrial membrane potential was quantified in cells using MitoTracker Red FM and flow cytometry. Data are presented as the mean ± SD (n = 3 for each group); *p < 0.05 by unpaired two-tailed Student’s t test. (G) TMLHE/TMLD, HTMLA (SHMT1 and SHMT2), ALDHA9A1/TMABADH, and BBOX1/BBH are involved in L-carnitine synthesis. (H and I) Expression of BBOX1 in clinical PDAC samples from the NCI-UMD-German cohort. BBOX1 was upregulated in SERPINB3-high PDAC and the basal-like/squamous subtype. Data are presented as the mean ± SD; **p < 0.01, ***p < 0.005 by unpaired two-tailed Student’s t test. (J–M) Quantification of BBOX1 expression in human PDAC cell lines using qPCR. BxPC-3 reigns as the foremost representative of the basal-like PDAC subtype and was the sole cell line expressing endogenous BBOX1 (J). BBOX1 was upregulated in SERPINB3-overexpressing Panc 10.05 cells (K) and downregulated in SERPINB3-knockout BxPC-3 cells (L). The supplementation of a MYC inhibitor (10058-F4, 100 μM) in the medium downregulated BBOX1 expression at the mRNA level in BxPC-3 (M). Data are presented as the mean ± SD of three independent experiments; **p < 0.01 by unpaired one-way ANOVA. N.A. (not applicable), below the detection limit. (N) BBOX1 protein was downregulated in BxPC-3 through SERPINB3 knockout or the addition of a MYC inhibitor (10058-F4, 100 μM) to the medium. Total carnitine is the sum of all acylcarnitines/carnitine in the metabolome dataset: 2-methylbutyrylcarnitine (C5), acetylcarnitine, butyrylcarnitine, carnitine, decanoylcarnitine, deoxycarnitine, hexanoylcarnitine, isobutyrylcarnitine, isovalerylcarnitine, octanoylcarnitine, oleoylcarnitine, palmitoylcarnitine, propionylcarnitine, stearoylcarnitine, succinylcarnitine, and valerylcarnitine. See also Figures S6 and S7.

References

    1. Siegel RL, Miller KD, Wagle NS, and Jemal A (2023). Cancer statistics, 2023. CA. Cancer J. Clin 73, 17–48. 10.3322/caac.21763. - DOI - PubMed
    1. Sung H, Ferlay J, Siegel RL, Laversanne M, Soerjomataram I, Jemal A, and Bray F (2021). Global Cancer Statistics 2020: GLOBOCAN Estimates of Incidence and Mortality Worldwide for 36 Cancers in 185 Countries. CA. Cancer J. Clin 71, 209–249. 10.3322/caac.21660. - DOI - PubMed
    1. Bailey P, Chang DK, Nones K, Johns AL, Patch A-M, Gingras MC, Miller DK, Christ AN, Bruxner TJC, Quinn MC, et al. (2016). Genomic analyses identify molecular subtypes of pancreatic cancer. Nature 531, 47–52. 10.1038/nature16965. - DOI - PubMed
    1. Moffitt RA, Marayati R, Flate EL, Volmar KE, Loeza SGH, Hoadley KA, Rashid NU, Williams LA, Eaton SC, Chung AH, et al. (2015). Virtual microdissection identifies distinct tumor- and stroma-specific subtypes of pancreatic ductal adenocarcinoma. Nat. Genet 47, 1168–1178. 10.1038/ng.3398. - DOI - PMC - PubMed
    1. Collisson EA, Sadanandam A, Olson P, Gibb WJ, Truitt M, Gu S, Cooc J, Weinkle J, Kim GE, Jakkula L, et al. (2011). Subtypes of pancreatic ductal adenocarcinoma and their differing responses to therapy. Nat. Med 17, 500–503. 10.1038/nm.2344. - DOI - PMC - PubMed

Publication types

Substances