. 2023 Nov 28;42(11):113446.
doi: 10.1016/j.celrep.2023.113446. Epub 2023 Nov 18.

Genome-wide profiling of transcription factor activity in primary liver cancer using single-cell ATAC sequencing

Affiliations

Genome-wide profiling of transcription factor activity in primary liver cancer using single-cell ATAC sequencing

Amanda J Craig et al. Cell Rep. .

Abstract

Primary liver cancer (PLC) consists of two main histological subtypes; hepatocellular carcinoma (HCC) and intrahepatic cholangiocarcinoma (iCCA). The role of transcription factors (TFs) in malignant hepatobiliary lineage commitment between HCC and iCCA remains underexplored. Here, we present genome-wide profiling of transcription regulatory elements of 16 PLC patients using single-cell assay for transposase accessible chromatin sequencing. Single-cell open chromatin profiles reflect the compositional diversity of liver cancer, identifying both malignant and microenvironment component cells. TF motif enrichment levels of 31 TFs strongly discriminate HCC from iCCA tumors. These TFs are members of the nuclear/retinoid receptor, POU, or ETS motif families. POU factors are associated with prognostic features in iCCA. Overall, nuclear receptors, ETS and POU TF motif families delineate transcription regulation between HCC and iCCA tumors, which may be relevant to development and selection of PLC subtype-specific therapeutics.

Keywords: CP: Cancer; ETS; POU; hepatocellular carcinoma; intrahepatic cholangiocarcinoma; nuclear receptors; primary liver cancer; retinoid receptors; scATAC-seq; transcription factor.


Conflict of interest statement

Declaration of interests The authors declare no competing interests.

Figures
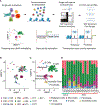
Figure 1.
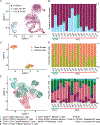
Figure 1.. Single-cell chromatin accessibility of 18,631 cells from 16 primary liver tumors
(A) Schematic presentation of experimental and analytical workflow. (B) UMAP visualization of all 18,631 cells. Patient IDs start with H and C to denote the clinical diagnosis of HCC and iCCA, respectively. Each color represents an individual patient. (C) UMAP visualization of all 18,631 cells. Each color represents a cell type. (D) Relative abundance of cell type in each patient. See also Figures S1‒S4.
Figure 2.
Figure 2.. Microenvironment analysis in scATAC-seq
(A) UMAP visualization of monocytes. Each color represents a cell subtype. (B) Relative abundance of monocyte subtypes in each patient. (C) UMAP visualization of B cells. (D) Relative abundance of B cell subtypes in each patient. (E) UMAP visualization of T cells. (F) Relative abundance of T cell subtypes in each patient. See also Figures S5‒S7.
Figure 3.
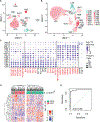
Figure 3.. TF motif enrichment differences between HCC and iCCA tumors
(A) UMAP visualization of all malignant cells using open peaks as features for dimensionality reduction and clustering. (B) UMAP visualization of all malignant cells using TF motif enrichment as features for dimensionality reduction and clustering. (C) Dot plot showing TF motif enrichment markers for each tumor subtype. NR, POU, or ETS family members are highlighted in red. (D) Hierarchical clustering of TIGER cohort gene expression of 31 TFs. Samples are labeled with tumor subtype. (E) ROC curve of TF motif signature for prediction of tumor subtype. See also Figure S8.
Figure 4.
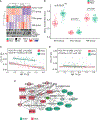
Figure 4.. NR, ETS, and POU factors expression in primary liver cancer
(A) Hierarchical clustering of TIGER-LC cohort ETS, NR, and POU ES. (B) Boxplots of ETS, POU, and NR ES scores of TIGER-LC cohort separated by tumor subtype. For each boxplot, the center line represents the median. Upper and lower limits of each box represent the 75th and 25th percentiles, respectively. (C) Correlation plot between NR ES and ETS ES in TIGER-LC cohort. (D) Correlation plot between NR ES and POU ES inTIGER-LC cohort. (E) Ingenuity pathway analysis generated a network of 31 TFs. Statistical significance of boxplots was calculated using the Wilcoxon test. Statistical significance of correlation plots was calculated using the Spearman’s rank correlation test. See also Figure S8.
Figure 5.
Figure 5.. Inter- and Intra-patient heterogeneity of TF motif enrichment
(A) Heatmap of TF motif enrichment markers for each patient. (B) Trajectory trees of malignant cells from patients with dynamic changes in TF motif enrichment. Cells are labeled by TF motif enrichment. (C) Trajectory trees of malignant cells from patients with no dynamic changes in TF motif enrichment. Cells are labeled by TF motif enrichment.
Figure 6.
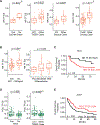
Figure 6.. NR and POU factors associate with prognostic factors
(A) Boxplots of NR ES scores of TIGER-LC cohort of patients with HCC in different molecular classifications. (B) Boxplots of NR ES scores of the TIGER-LC cohort of patients with HCC with different differentiation statuses and AFP levels. (C) Kaplan-Meier curves showing the percentage of survival between NR ES high and NR ES low TIGER-LC cohort of patients with HCC. (D) Boxplots of POU ES scores of TIGER-LC cohort of patients with iCCA in different molecular classifications. (E) Kaplan-Meier curves showing the percentage of survival between the POU ES high and POU ES low TIGER-LC cohort of patients with iCCA. For each boxplot, the center line represents the median. Upper and lower limits of each box represent the 75th and 25th percentiles, respectively. Statistical significance of boxplots was calculated using the Wilcoxon test or one-way ANOVA test. Statistical significance of Kaplan-Meier curves was calculated using the log-rank test. See also Figure S9.

References

    1. Villanueva A (2019). Hepatocellular Carcinoma. N. Engl. J. Med 380, 1450–1462. 10.1056/NEJMra1713263. - DOI - PubMed
    1. Cronin KA, Scott S, Firth AU, Sung H, Henley SJ, Sherman RL, Siegel RL, Anderson RN, Kohler BA, Benard VB, et al. (2022). Annual report to the nation on the status of cancer, part 1: National cancer statistics. Cancer 128, 4251–4284. 10.1002/cncr.34479. - DOI - PMC - PubMed
    1. Marcano-Bonilla L, Mohamed EA, Mounajjed T, and Roberts LR (2016). Biliary tract cancers: epidemiology, molecular pathogenesis and genetic risk associations. Chin. Clin. Oncol 5, 61. 10.21037/cco.2016.10.09. - DOI - PubMed
    1. Sia D, Villanueva A, Friedman SL, and Llovet JM (2017). Liver Cancer Cell of Origin, Molecular Class, and Effects on Patient Prognosis. Gastroenterology 152, 745–761. 10.1053/j.gastro.2016.11.048. - DOI - PubMed
    1. Yamashita T, and Wang XW (2013). Cancer stem cells in the development of liver cancer. J. Clin. Invest 123, 1911–1918. 10.1172/JCI66024. - DOI - PMC - PubMed

Publication types

MeSH terms