. 2023 Dec:98:104877.
doi: 10.1016/j.ebiom.2023.104877. Epub 2023 Nov 17.

Nicotinamide mononucleotide impacts HIV-1 infection by modulating immune activation in T lymphocytes and humanized mice

Affiliations

Nicotinamide mononucleotide impacts HIV-1 infection by modulating immune activation in T lymphocytes and humanized mice

Yufei Mo et al. EBioMedicine. 2023 Dec.

Abstract

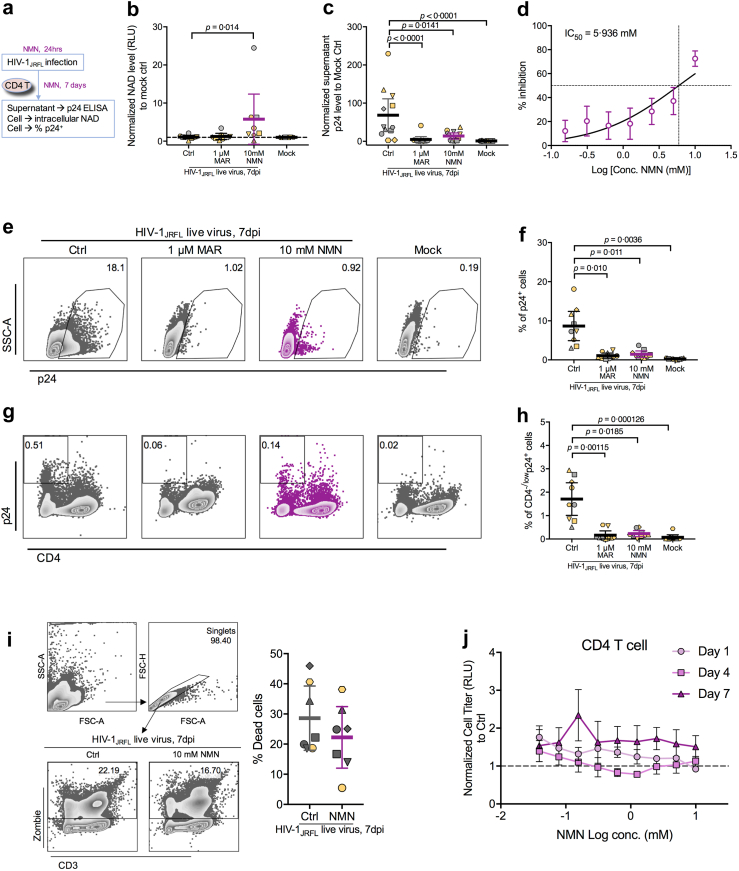
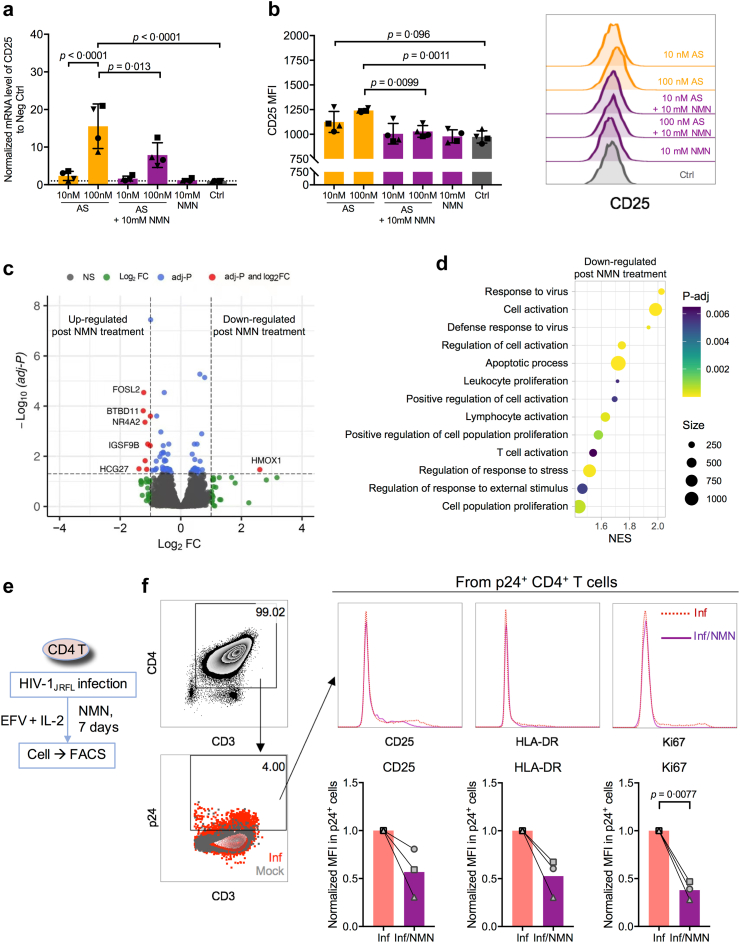
Background: HIV-1-associated immune activation drives CD4+ T cell depletion and the development of acquired immunodeficiency syndrome. We aimed to determine the role of nicotinamide mononucleotide (NMN), the direct precursor of nicotinamide adenine dinucleotide (NAD) co-enzyme, in CD4+ T cell modulation during HIV-1 infection.

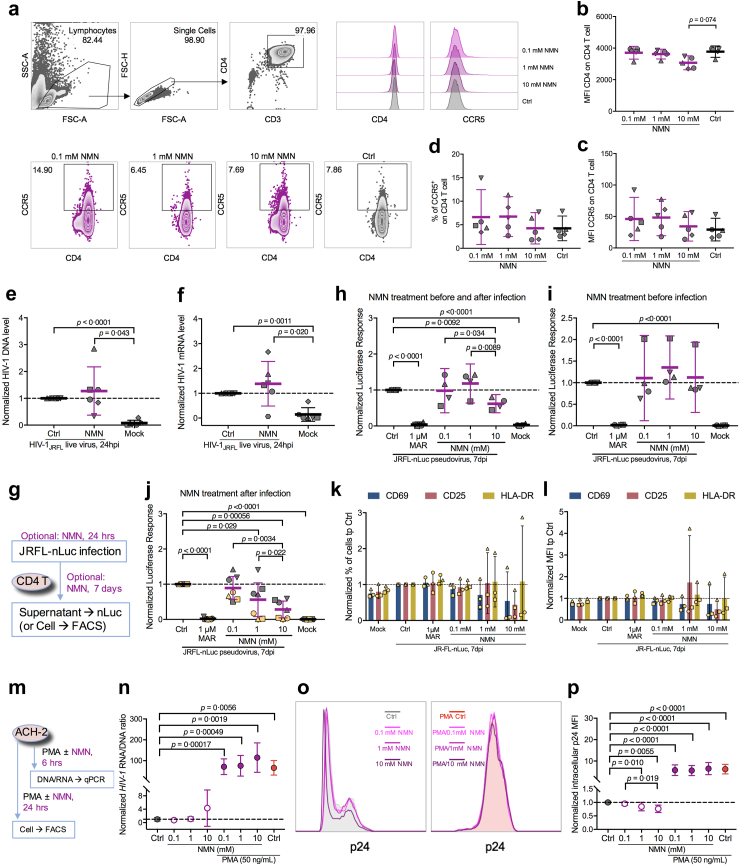
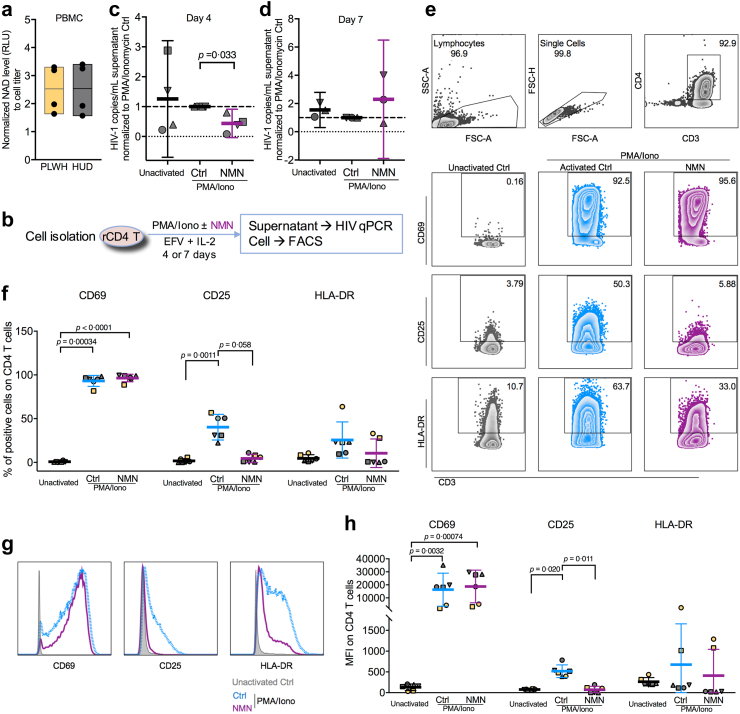
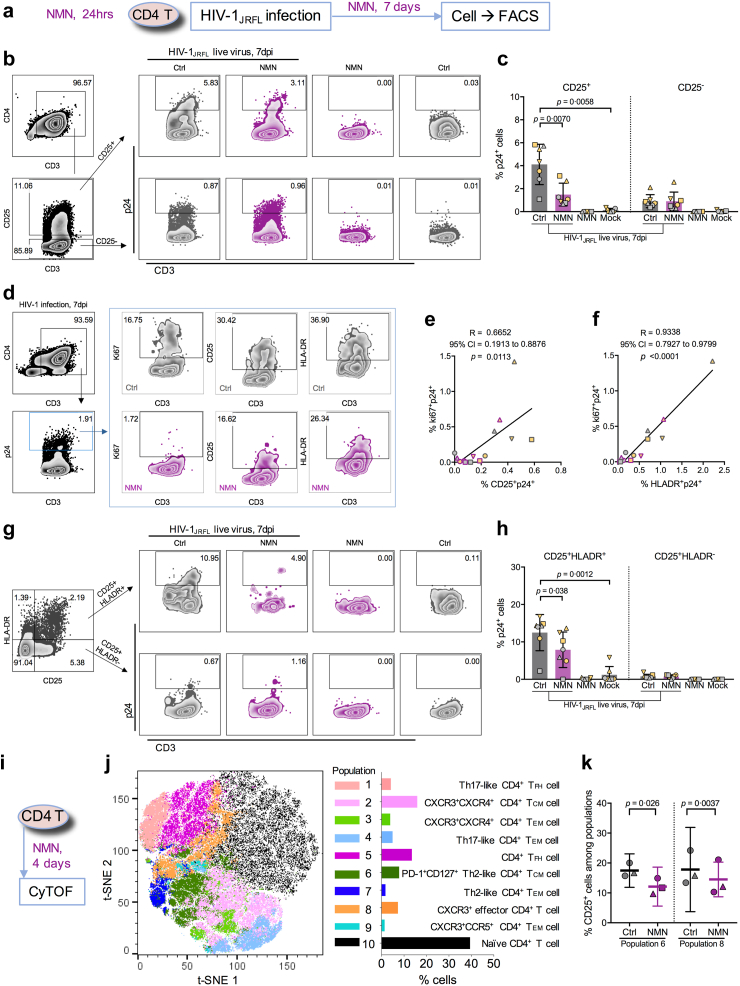
Methods: We examined HIV-1 integrated DNA or transcribed RNA, intracellular p24 protein, and T cell activation markers in CD4+ T cells including in vitro HIV-1-infected cells, reactivated patient-derived cells, and in HIV-1-infected humanized mice, under NMN treatment. RNA-seq and CyTOF analyses were used for investigating the effect of NMN on CD4+ T cells.

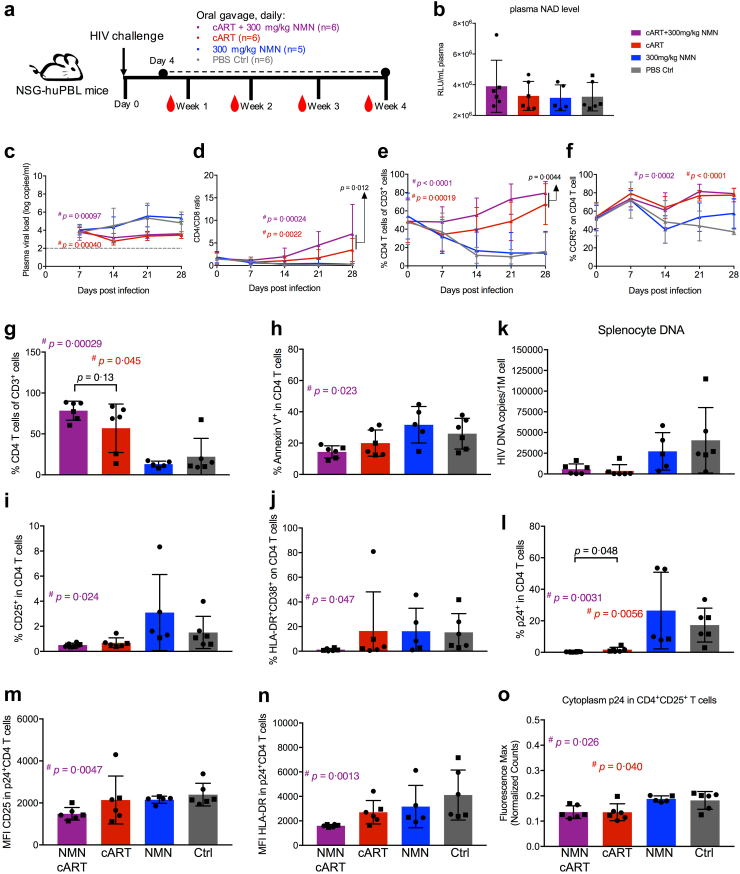
Findings: We found that NMN increased the intracellular NAD amount, resulting in suppressed HIV-1 p24 production and proliferation in infected CD4+ T cells, especially in activated CD25+CD4+ T cells. NMN also inhibited CD25 expression on reactivated resting CD4+ T cells derived from cART-treated people living with HIV-1 (PLWH). In HIV-1-infected humanized mice, the frequency of CD4+ T cells was reconstituted significantly by combined cART and NMN treatment as compared with cART or NMN alone, which correlated with suppressed hyperactivation of CD4+ T cells.

Interpretation: Our results highlight the suppressive role of NMN in CD4+ T cell activation during HIV-1 infection. It warrants future clinical investigation of NMN as a potential treatment in combination with cART in PLWH.

Funding: This work was supported by the Hong Kong Research Grants Council Theme-Based Research Scheme (T11-706/18-N), University Research Committee of The University of Hong Kong, the Collaborative Research with GeneHarbor (Hong Kong) Biotechnologies Limited and National Key R&D Program of China (Grant2021YFC2301900).

Keywords: AIDS; CD4 T cell; HIV-1; Nicotinamide mononucleotide; T cell activation.


Conflict of interest statement

Declaration of interests J.W. is an employee and shareholder of GeneHarbor (Hong Kong) Biotechnologies.

Figures

Fig. 1
Fig. 1
Live HIV-1JRFLinfection can be suppressed by NMN treatment in vitro. Primary CD4+ T cells were isolated from PBMCs and pre-treated with 1 μM Maraviroc (MAR), different concentrations of NMN (with serial dilution starting from 10 mM at 1:2 ratio) or 10 mM of NMN for 24 h before infection with HIV-1JRFL virus (2 ng p24 per 0.1 million cells). At 2 h post-infection, cells were washed and treated with or without NMN in the presence of IL-2 (10 U/mL) for seven days. (a) The experimental flowchart was displayed. On Day 7 post-infection, (b) the intracellular NAD level in CD4+ T cells (n = 8) was detected using NAD/NADH-Glo™ Assay. (c) Normalized supernatant p24 level (to infection control, n = 12) was detected using anti-p24 ELISA assay. (d) The IC50 value was calculated using supernatant p24 level (n = 12). Cells were also harvested for intracellular p24 staining and FACS analysis. (e) Representative plots of p24+ cells from CD4+ T cells were displayed. (f) The percentage of p24+ cells (n = 9) was analysed among groups. (g) Representative plots of CD4−/lowp24+ cells were displayed. (h) The percentage of CD4−/lowp24+ cells (n = 9) was analysed among groups. To detect cell death after infection, cells with or without NMN treatment (10 mM) were harvested for FACS analysis on dead cell analysis. (i) The percentage of dead (Zombie+) cells (n = 7) was analysed, along with representative plots showing the gating strategy. (j) Primary CD4 T cells (n = 3) treated with different concentrations of NMN (with serial dilution starting from 10 mM at 1:2 ratio) for 1 day, 4 days and 7 days were assessed by CellTiter-Glo® Luminescent Cell Viability Assay in one experiment. For (b), (c), (f), (h) and (i), data represent Mean ± 95% CI; for (d) and (j), data represent Mean ± SD. For (b) and (h), data did not pass normality test, and statistics were calculated using Friedman test with post-hoc multiple comparison tests; for (c) and (f), data passed normality test, and statistics were calculated using a One-way ANOVA test with a post-hoc test corrected by Tukey's test.
Fig. 2
Fig. 2
In vitro NMN treatment suppresses HIV infection at the post-transcriptional stage. Purified human CD4+ T Cells were treated with indicated compounds [NMN (0.1, 1, 10 mM) or PBS control] for five days and harvested for FACS analysis. (a) Representative histogram plots were displayed. The MFI of CD4 (b) and CCR5 (c), as well as the percentage of CCR5+ cells (d), on CD4+ T cells were compared among groups (n = 5). Purified human CD4+ T cells were pre-treated with 10 mM of NMN for 24 h before infection with live HIV-1JRFL virus (2 ng p24 per 0.1 million cells). At 3 h post-infection, cells were washed and treated with or without NMN in the presence of IL-2 (10 U/mL) for 24 h. At 24 hpi, cellular DNA and mRNA were extracted for HIV-1 real-time PCR assay. Normalized HIV-1 DNA level (e) and HIV-1 mRNA level (f) to infection control were compared (n = 6). Purified human CD4+ T Cells were pre-treated without or with 1 μM Maraviroc (MAR) for 30 min or 0.1, 1, 10 mM of NMN for 24 h. Cells were mocked infected or infected with HIVJRFL-nLuc. At 24 h post-infection, cells were washed and treated without or with 0.1, 1, 10 mM of NMN in the presence of IL-2 (10 ng/mL)/IL-15 (200 ng/mL) for 7 days. Vehicle-treated infected cells served as control (Ctrl), whereas mock cells serve as mock control. (g) The experimental flowchart was displayed. The normalized supernatant luciferase responses to infection control (n = 4) were compared for treatment during the period of pre-infection and post-infection (h) and treatment during the period of pre-infection (i). The normalized supernatant luciferase responses to infection control (n = 7) were compared for treatment during the period of post-infection (j), with monitoring the frequencies (k) and expression (MFI, l) of CD69, CD25, and HLA-DR by flow cytometry. ACH-2 cell line was reactivated by PMA (50 ng/mL) in the presence or absence of NMN treatment (0.1, 1 or 10 mM). (m) The experimental flowchart was displayed. (n) The normalized HIV-RNA/HIV-DNA ratios to the unactivated control group at 6 h after treatment were compared among groups. For intracellular p24 expression at 24 h after treatment, (o) representative histogram plots were displayed. (p) Normalized intracellular p24 expression levels were compared among groups. For (bf), (hj), (n) and (p), data represent Mean ± 95% CI; for (kl), data represent Mean ± SD. For (bf) and (hj), data passed normality test, and statistics were calculated using a One-way ANOVA test with an appropriate post-hoc test; for (n) and (p), data did not pass normality test, and statistics were calculated using a Mann–Whitney test.
Fig. 3
Fig. 3
Ex vivo NMN treatment suppresses resting CD4+T cell reactivation in cART-treated people living with HIV by reducing CD25+cells. Frozen PBMCs from four independent cART-treated people living with HIV (PLWH) and four independent HIV-uninfected donors (HUD) were used for NAD level detection via NAD/NADH-Glo™ Assay. (a) The intracellular NAD level in PBMCs between PLWH and HUDs was displayed. Data represent Mean with Mix to Max in floating bars. Fresh or frozen PBMCs from six independent cART-treated PLWH were used for resting CD4+ T cell isolation. Purified resting CD4+ T cells were treated with PMA (50–500 ng/mL) plus Ionomycin (1 μg/mL) (in short as PMA/Iono), PMA/Iono plus 10 mM NMN or mock, under treatment of 10 nM EFV and 10 U/ml IL-2. On day 4 or 7 after treatment, cells were collected for FACS analysis, whereas viral RNA in the supernatant was extracted for HIV-1 real-time PCR assay. (b) The experimental flowchart was displayed. Normalized HIV-1 mRNA levels to PMA/Iono activation control were compared on day 4 (c; n = 4, frozen PBMCs) and day 7 (d; n = 3, frozen PBMCs) after reactivation. For FACS analysis on activation markers, representative FACS plots (e) and histogram plots (g) were displayed. The percentage (f) and MFI (h) of CD69+, CD25+, and HLA-DR+ cells on CD4+ T cells was compared (n = 6). For (c and d), (f) and (h), data represent Mean ± 95% CI. For (cd), data passed normality test, and statistics were calculated using a paired Student's t-test; for (f) and (h), data did not pass normality test, and statistics were calculated using a Friedman test with post-hoc multiple comparison tests.
Fig. 4
Fig. 4
NMN treatment predominantly reduces intracellular p24 level in CD25+CD4+T cells, correlating to proliferating p24-expressing CD4+T cells. Primary CD4+ T cells were isolated from PBMCs (n = 7) and pre-treated with 10 mM of NMN for 24 h before infection with live HIV-1JRFL virus (2 ng p24 per 0.1 million cells) or mock. After infection, cells were treated with 10 mM NMN for seven days. On Day 7 post-infection, cells were harvested for intracellular p24 staining and FACS analysis on CD25, HLA-DR, and ki67 expression. (a) The experimental flowchart was displayed. The gating strategies on p24+ cells in CD25+/−CD4+ T cells (b) and p24+ cells in CD25+HLA-DR+/−CD4+ T cells (g) among groups were displayed with representative plots. The percentage of p24+ cells in CD25+/−CD4+ T cells (c) and CD25+HLA-DR+/−CD4+ T cells (h) was compared. (d) The gating strategy on ki67+, CD25+ or HLA-DR+ cells in p24+CD4+ T cells from HIV-infected groups was displayed with representative plots. Correlation between the percentage of CD25+p24+CD4+ T cells (e) or of HLA-DR+p24+CD4+ T cells (f) and the percentage of ki67+p24+CD4+ T cells was calculated based on Spearman correlation. Purified CD4+ T cells were isolated from fresh PBMCs from 3 independent healthy donors. Cells were treated with 10 mM NMN or vehicle for 4 days before being collected for CyTOF analysis on CD25+ cells among various CD4+ T cell subsets in one experiment. (i) The experimental flowchart was displayed. The t-SNE plot of CyTOF data was generated by opt-SNE using the KNN algorithm and the Fit-SNE gradient algorithm. Clustering was processed using the FlowSOM algorithm in order to obtain 10 populations (meta clusters). (j) The combined CyTOF data (2 groups, 3 donors) were analysed by FlowSOM and visualized with 10 populations (meta clusters) in a two-dimensional grid. (k) The percentage of CD25+ cells in Populations 6 and 8 of CD4+ T cells were compared between the NMN group and the control group. For (c) and (h), data represent Mean ± SD. For (k), data represent Mean ± 95% CI. For (c) and (h), data did not pass normality test, and statistics were calculated using a Mann–Whitney test; for (k), data passed normality test, and statistics were calculated using a paired Student's t-test. Each dot represents one independent individual.
Fig. 5
Fig. 5
CD25(IL2RA) level associates with proliferating p24-expressing cells. MOLT-4 CCR5+ cells were treated with AS2863619 (shortly as AS; 10 nM or 100 nM) and/or 10 mM NMN for 24 h, followed by RNA extraction for real-time PCR assay and cell staining for flow cytometry assay. (a) Normalized mRNA level of CD25 to control group (ctrl) and (b) the MFI of CD25 from four replicates was compared among groups, along with the representative flow cytometry plot. Purified primary CD4+ T cells were treated with (n = 3) or without (n = 4) 10 mM of NMN for 48 h before harvesting for bulk RNA-seq analysis. (c) Volcano plot displays the Log2 FC and –Log10 (adj-P) of each gene comparing the untreated group and the NMN-treated group. Log2 FC of the control group to the NMN-treated group was calculated (Log2 FC > 0 represents gene upregulation in the control group as compared to the NMN-treated group). (d) CD25-related Gene Ontology (GO) of Gene Set Enrichment Analysis (GSEA) was displayed in a bubble chart. The normalized enrichment score (NES) of the control group to the NMN-treated group was calculated (NES >0 represents gene upregulation in the control group as compared to the NMN-treated group). The size of each bubble represents the number of genes involved in the corresponding pathways. Primary CD4+ T cells were isolated from PBMCs of 3 independent healthy donors and infected with live HIV-1JRFL virus (2 ng p24 per 0.1 million cells) or mock in one experiment. At 24 h post-infection, cells were treated without or with 10 mM NMN in the presence of 10 nM EFV and 10 U/mL IL-2. On Day 7 post-infection, cells were harvested for intracellular p24 staining and FACS analysis on CD25, HLA-DR, and ki67 expression. (e) The experimental flowchart was displayed. (f) The expression level of CD25, HLA-DR, and ki67 in p24+ cells were displayed in representative histogram plots, and the normalized MFI levels of CD25, HLA-DR, and ki67 to infected control were compared. For (ab), data represent Mean ± SD; data passed normality test, and statistics were calculated using a One-way ANOVA test with a post-hoc test corrected by Tukey's test. Each dot represents one replicate. For (f), data represent Mean within line chart; data passed normality test, and statistics were calculated using a paired Student's t-test. Each dot represents one independent individual.
Fig. 6
Fig. 6
NMN treatment plus cART significantly increases CD4+T cell percentage in HIV-infected huPBL mouse model in vivo. (a) Schematic diagram of humanized mice experiment using human PBL reconstituted NSG mice (HuPBL). (b) Plasma NAD level was detected via luciferase assay on Day 28 post-infection. Plasma viral load (c), CD4/CD8 ratio (d), the percentage of CD4+ T cells in CD3+ cells (e), and the percentage of CCR5+ on CD4+ T cells (f), were monitored weekly before or post-infection. Among splenocytes collected on Day 28 post-infection, the percentage of CD4+ T cells in CD3+ cells (g), the percentage of Annexin V+ cells in CD4+ T cells (h), the percentage of CD25+ cells in CD4+ T cells (i), the percentage of HLA-DR+CD38+ cells in CD4+ T cells (j), and the percentage of p24+ cells in CD4+ T cells (l) from splenocytes were analysed by flow cytometry. The MFI values of CD25 (m) and HLA-DR (n) in p24+CD4+ T cells were also analysed by flow cytometry. (k) Splenocyte p24 DNA level was detected via real-time PCR. By immunohistochemistry (IHC) analysis on spleen tissue sections, IHC slides were scanned via PerkinElmer Vectra Polaris™ Automated Quantitative Pathology Imaging System and analysed by Inform Software. (o) The cytoplasm p24 max intensity (normalized counts) in CD25+CD4+ cells was calculated using Inform Software and compared among groups. Data represent Mean ± SD. For (c-f), the area under curve (AUC) was calculated and used for statistical analysis by an unpaired Student's t-test, and the p values reported in black text are the AUC analysis comparing ART alone to ART-plus-NMN; for (b) and (i), data did not pass normality test, and statistics were calculated using Mann–Whitney test; for (gh) and (jo), data passed normality test, and statistics were calculated using unpaired Student's t-tests. # represents the significant difference between experimental groups and the control group, and the corresponding p value was reported in the corresponding group colour (cART group in red, while cART-plus-NMN group in purple); ∗ represents the significant difference between cART group and cART-plus-NMN group, and the corresponding p value was reported in black colour. Two batches of mice were conducted in this experiment. Each dot represents one individual mouse. Circles show mice from Batch 1, whereas rectangles show mice from Batch 2.

References

    1. Maartens G., Celum C., Lewin S.R. HIV infection: epidemiology, pathogenesis, treatment, and prevention. Lancet. 2014;384(9939):258–271. - PubMed
    1. Gazzola L., Tincati C., Bellistrì G.M., Monforte A., Marchetti G. The absence of CD4+ T cell count recovery despite receipt of virologically suppressive highly active antiretroviral therapy: clinical risk, immunological gaps, and therapeutic options. Clin Infect Dis. 2009;48(3):328–337. - PubMed
    1. Nies-Kraske E., Schacker T.W., Condoluci D., et al. Evaluation of the pathogenesis of decreasing CD4(+) T cell counts in human immunodeficiency virus type 1-infected patients receiving successfully suppressive antiretroviral therapy. J Infect Dis. 2009;199(11):1648–1656. - PMC - PubMed
    1. Bono V., Augello M., Tincati C., Marchetti G. Failure of CD4+ T-cell recovery upon Virally-effective cART: an enduring gap in the understanding of HIV+ immunological non-responders. New Microbiol. 2022;45(3):155–172. - PubMed
    1. Pirinen E., Auranen M., Khan N.A., et al. Niacin cures systemic NAD(+) deficiency and improves muscle performance in adult-onset mitochondrial myopathy. Cell Metabol. 2020;31(6):1078–1090.e5. - PubMed