Review
. 2023 Dec:203:115141.
doi: 10.1016/j.addr.2023.115141. Epub 2023 Nov 18.

Cell and biomaterial delivery strategies to induce immune tolerance

Affiliations
Review

Cell and biomaterial delivery strategies to induce immune tolerance

Brianna L Scotland et al. Adv Drug Deliv Rev. 2023 Dec.

Abstract

The prevalence of immune-mediated disorders, including autoimmune conditions and allergies, is steadily increasing. However, current therapeutic approaches are often non-specific and do not address the underlying pathogenic condition, often resulting in impaired immunity and a state of generalized immunosuppression. The emergence of technologies capable of selectively inhibiting aberrant immune activation in a targeted, antigen (Ag)-specific manner by exploiting the body's intrinsic tolerance pathways, all without inducing adverse side effects, holds significant promise to enhance patient outcomes. In this review, we will describe the body's natural mechanisms of central and peripheral tolerance as well as innovative delivery strategies using cells and biomaterials targeting innate and adaptive immune cells to promote Ag-specific immune tolerance. Additionally, we will discuss the challenges and future opportunities that warrant consideration as we navigate the path toward clinical implementation of tolerogenic strategies to treat immune-mediated diseases.

Keywords: Adaptive immune responses; Adoptive cell therapies; Antigen delivery systems; Autoimmune diseases; Immune tolerance; Innate immune response; Nanoparticles.


Conflict of interest statement

Declaration of competing interest The authors declare that they have no known competing financial interests or personal relationships that could have appeared to influence the work reported in this paper.

Figures

Figure 1.
Figure 1.. Context of Ag presentation determines CD4 T cell responses.
Three signals for generation of Ag-specific CD4 T cell responses, where (1) antigenic peptides are presented by Ag presenting cells (APCs) on their MHC class II molecules to cognate T cell receptors on the T cell; (2) expression of co-stimulatory molecules such as CD80/86 by APCs interact with corresponding CD28 receptors on T cells; (3) Cytokines are secreted by APCs and T cells as a result of signals 1 and 2, which contribute to the overall immunological outcome. T cell activation occurs when all signals are present between APCs and T cells, whereas tolerance is generally thought to occur in the presence of signal 1. Co-inhibitory molecules such as PD-L1/PD-1 can also act as signal 2, however their function is to inhibit T cell activation responses. The outcomes of tolerogenic Ag presentation to Ag-specific CD4 T cells can result in T cell anergy, differentiation into regulatory T cells (Tregs), or apoptosis. Figure created using Biorender.com.
Figure 2.
Figure 2.. Examples of cell-based delivery strategies.
(A) Synthesis of antigen-coupled peripheral blood mononuclear cells (Ag-PBMCs). PBMCs are isolated from patient blood and coupled with peptide antigens using carbodiimide chemistry (ECDI ) to form Ag-PBMCs. The process of ECDI coupling induces apoptosis in PBMCs and the conjugates are then intravenously infused into a patient. (B) Development of tolerogenic APCs (TolAPC). Monocytes are incubated with one or a combination of immunomodulators for induction of a tolerogenic phenotype prior to incubation with peptide antigens. The Ag-loaded TolAPCs are then infused intravenously into a patient. (C) Development of chimeric antigen receptor (CAR) and chimeric autoantibody receptor (CAAR) T cells. Leukapheresis is performed and T cells are activated and expanded prior to treatment with viral or non-viral gene delivery vectors to induce CAR/CAAR T cells. These cells are further expanded and then intravenously infused into a patient. The outcomes of these therapies are to modulate autoreactive T or B cells. Figure created using Biorender.com.
Figure 3.
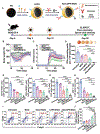
Figure 3.. VitD3-tolDC-MOG + IFN-beta reduced clinical scores of EAE and suppressed the differentiation of Th17 cells in MS patients.
(A) Clinical score of mice treated with PBS (blue), IFN-b [5000IU] (orange), tolDC [1 × 10⁶cells] (violet), or tolDC+IFNbeta (green) (n = 7/group) over 34 days. (B) Splenocyte stimulation index in response to MOG35–55 restimulation (C) IL-10 cytokine secretion (D) relapsing-remitting multiple sclerosis (RRMS) patients (n = 6) The percentages of Th2 (green) and Th17 (grey) lymphocyte subpopulations in response to PBMC co-cultured with 100%VitD3-tolDC or 50%VitD3-tolDC treated mature DC in the presence or absence of IFN-beta after 5 days of culture. Reprinted (adapted) with permission from [51].
Figure 4.
Figure 4.. NP OVA/ApoBP attenuated allergic airway inflammation
(A) Schematic overview of the therapeutic allergen mouse model and the antigen-specific immune tolerance mechanism. Allergen pre-sensitized mice treated with NPs w/o OVA, NPOVA, NPOVA/mannc, NPOVA/manc, NPOVA/ApoBPlo NPOVA/ApoBPhiA, followed by OVA aerosolization on days 35 to 37. (B) Analysis of IL-4, IL-5, and TGF-β cytokine secretion from the bronchoalveolar lavage fluid (BALF) (C) IHC staining and quantification of Foxp3+ T cell recruitment in the lungs. The scale bar represents 100 μm. Image-Pro Plus 6.0 software was used to detect cell nuclei and calculation of the percent-positive cells, under 10x magnification. A total of 12 independent fields were counted for each experimental group. The histogram on the right shows the % Foxp3+ T cells in each group. Data are expressed as the mean ± SEM. *p < 0.05; **p < 0.01; ***p < 0.001 (one-way ANOVA followed by a Tukey’s test). Adapted from [158] with permission. Copyright © 2019 American Chemical Society.
Figure 5.
Figure 5.. Various antigen delivery strategies using nanoparticles.
(A) Antigens can be associated with nanoparticles via surface conjugation (i) to yield NP-sAg; or encapsulated within nanoparticles (NP(Ag)) (ii). Antigens can be chemically modified with polymers to create antigen-polymer conjugates (iii), which can then be used to formulate antigen-conjugate nanoparticles (acNP-Ag). Figure created with Biorender.com. (B) Demonstration of acNP-OVA for tolerance induction using the delayed-type hypersensitivity (DTH) model. Mice were intravenously injected with acNP-OVA NPs therapeutically (Day 10 relative to immunization). Mice were immunized with OVA/CFA and on Day 14 were primed with an intradermal injection of 1 mg/mL OVA or irrelevant PLP in the pinna of the ear. Ear thickness was determined before priming or 24 h following priming. Mice were not treated (NT) or injected with 50 μg OVA or 1 mg of blank NP containing a range of antigen loading (0–150 μg OVA/mg NP). Statistical differences were determined by two-way ANOVA with Sidak’s multiple comparisons test with nonsignificant differences between test ear and control ear indicated (p > 0.05). N = 5 mice per condition. Adapted from [161] with permission.
Figure 6.
Figure 6.. IPEMs promoted tolerance in a mouse model of multiple sclerosis mice and in human samples.
(A) Schematic of iPEMs assembly by layer-by-layer electrostatic of myelin self-antigen and a TLR9 antagonist (GpG) to induce tolerance in a (B) mouse model of MS and in human MS patients. Data were analyzed with multiple t tests, one at each time point, with a post-test correction for multiple comparisons. (* = P ≤ 0.05; ** = P ≤ 0.01; *** = P ≤ 0.001; **** = P ≤ 0.0001). Adapted from [169] with permission. Copyright © 2022 American Chemical Society.
Figure 7.
Figure 7.. Therapeutic treatment of AbaLDPN-MOG reduced disease severity and cell infiltration in an EAE mouse model.
(A) Schematic overview of AbaLDPN-MOG synthesis. Administration of AbaLDPN-M OG 3 and 10 days after EAE induction. (B) Body weight measurement from day 10 to 28. (C) Clinical scores. (D) IFNγ secretion from in vitro MOG splenocyte restimulation. (E-H) Flow cytometry analysis of leukocyte infiltration - (E) macrophages (CD11b+F4/80+), (F) DC (CD11c+MHCII+), (G) helper T cells (CD3+CD4+), and (H) cytotoxic T cells (CD3+CD8+). (I) Flow cytometry evaluation of Foxp3+ and (J) quantification of Foxp3+ in the spinal cord. All statistical data are represented as mean ± SD (n = 5; *p < 0.05, **p < 0.01, ***p < 0.001, ****p < 0.0001). Adapted from [203] with permission © 2022 Wiley-VCH GmbH.
Figure 8.
Figure 8.. MOG35–55-encoding m1Ψ mRNA nanoparticle ameliorated EAE.
(A) Reduction of IFNγ and IL17A secreting CD4+ T cells within the brain and spinal cord after administration of MOG35–55m1Ψ nanoparticle. n=3 to 4. (B-D) Flow cytometric analysis of splenic tetramer CD4+T cells. Error bars indicate mean ± SD. Adapted from [227] with permission. Copyright © 2021, American Association for the Advancement of Science.
Figure 9.
Figure 9.. Insulin-inspired Nap-GdFdFdY hydrogel development for T1D prevention.
(A) The chemical structure of GFFY peptide conjugated to a NAP hydrogel scaffold. (B) Transmission electron microscopy image of Nap-GFFY hydrogel. Scale bar = 100 nm. (C) NOD mice T1D incidence after Nap-GdFdFdY or peptide controls immunization. Splenic Treg population measured at week 14 (D) or week 20 (E). Mean fluorescence intensity of serum TGF-β1 in control group (F) or Nap-GdFdFdY (G) at week 14 and week 20. Data presented as mean ± SEM. Statistical significance was assessed using one-way ANOVA with Bonferroni’s post-test. Adapted with permission from [237]. Copyright © 2021, Advanced Science.
Figure 10.
Figure 10.. Hybrid Lipid-Polymer Nanoparticles Utilize Lipid Depoting to Induce Antigen-Specific T cell Responses using B Cells as APCs.
(A) Schematic representing the depoting effect of L-Ag NPs. (B) Heatmap of normalized cytokines for each treatment type measured using Luminex and (C-E) latent variable 1 (LV1) from eights cytokines classified by PLS-DA modeling, grouped by Ag delivery formulation. Adapted from [267] with permission. Copyright © 2023. American Chemical Society.

References

    1. Wood RA, Camargo CA, Lieberman P, Sampson HA, Schwartz LB, Zitt M, Collins C, Tringale M, Wilkinson M, Boyle J, Simons FER, Anaphylaxis in America: The prevalence and characteristics of anaphylaxis in the United States, Journal of Allergy and Clinical Immunology. 133 (2014) 461–467. 10.1016/j.jaci.2013.08.016. - DOI - PubMed
    1. Wang L, Wang F, Gershwin ME, Human autoimmune diseases: a comprehensive update, J Intern Med. 278 (2015) 369–395. - PubMed
    1. Pålsson-McDermott EM, O’Neill LAJ, Targeting immunometabolism as an anti-inflammatory strategy, Cell Res. 30 (2020) 300–314. 10.1038/s41422-020-0291-z. - DOI - PMC - PubMed
    1. Lee DSW, Rojas OL, Gommerman JL, B cell depletion therapies in autoimmune disease: advances and mechanistic insights, Nat Rev Drug Discov. 20 (2021) 179–199. 10.1038/s41573-020-00092-2. - DOI - PMC - PubMed
    1. Lapadula G, Marchesoni A, Armuzzi A, Blandizzi C, Caporali R, Chimenti S, Cimaz R, Cimino L, Gionchetti P, Girolomoni G, Lionetti P, Marcellusi A, Mennini FS, Salvarani C, Adalimumab in the treatment of immune-mediated diseases., Int J Immunopathol Pharmacol. 27 (2014) 33–48. 10.1177/03946320140270S103. - DOI - PubMed

Publication types

LinkOut - more resources