. 2023 Nov 20;14(1):7529.
doi: 10.1038/s41467-023-43224-z.

Brain-to-gut trafficking of alpha-synuclein by CD11c+ cells in a mouse model of Parkinson's disease

Affiliations

Brain-to-gut trafficking of alpha-synuclein by CD11c+ cells in a mouse model of Parkinson's disease

Rhonda L McFleder et al. Nat Commun. .

Abstract

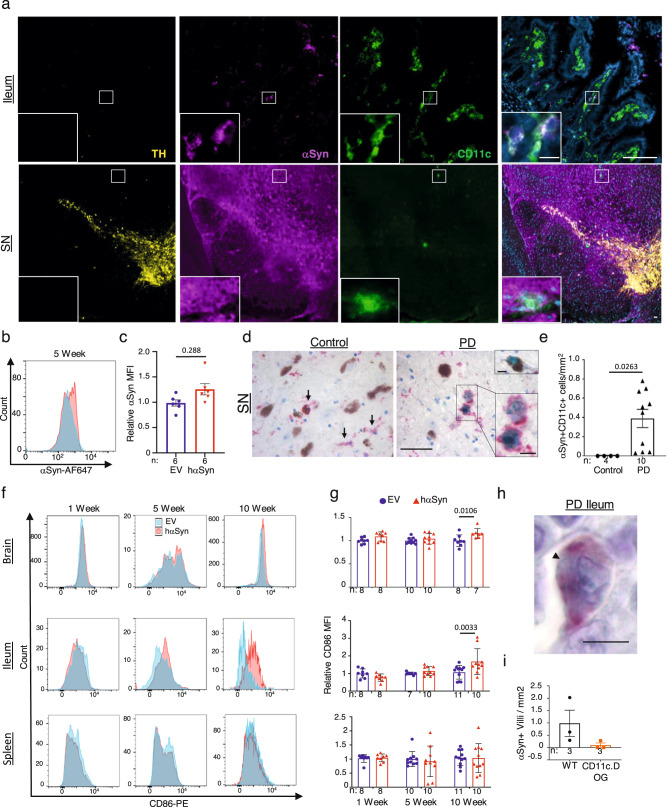
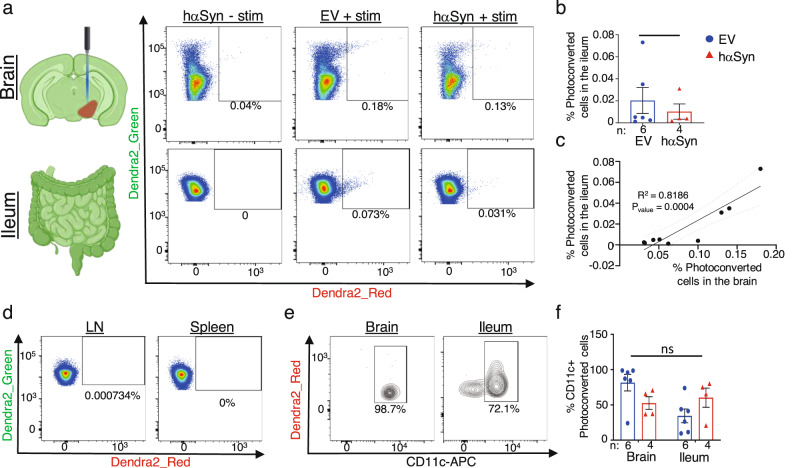
Inflammation in the brain and gut is a critical component of several neurological diseases, such as Parkinson's disease (PD). One trigger of the immune system in PD is aggregation of the pre-synaptic protein, α-synuclein (αSyn). Understanding the mechanism of propagation of αSyn aggregates is essential to developing disease-modifying therapeutics. Using a brain-first mouse model of PD, we demonstrate αSyn trafficking from the brain to the ileum of male mice. Immunohistochemistry revealed that the ileal αSyn aggregations are contained within CD11c+ cells. Using single-cell RNA sequencing, we demonstrate that ileal CD11c+ cells are microglia-like and the same subtype of cells is activated in the brain and ileum of PD mice. Moreover, by utilizing mice expressing the photo-convertible protein, Dendra2, we show that CD11c+ cells traffic from the brain to the ileum. Together these data provide a mechanism of αSyn trafficking between the brain and gut.


Conflict of interest statement

The authors declare no competing interests.

Figures

Fig. 1
Fig. 1. hαSyn expression in the brain leads to increased αSyn in the ileum of PD mice.
All images are from mice five weeks following stereotactic injection of the AAV vector. a Top panel: Representative immunofluorescence images for Tyrosine Hydroxylase (TH) (yellow), HA (green), αSyn (magenta), and DAPI (blue) in the SN of either EV or hαSyn mice. Far right demonstrates a representative immunofluorescence image of GFP (green), TH (yellow), and DAPI (blue) in the SN of mice injected with an AAV-GFP. Bottom Panel: Representative immunohistochemistry images of TH. b Quantification of TH positive or Nissl-stained neurons (c) in the SN. d Representative immunofluorescence images of HA (green) and αSyn (magenta) in the ileum of EV, hαSyn, and GFP mice. Arrowheads indicate αSyn positive cells. e Quantification of the number of αSyn positive villi in the ileum of EV or hαSyn mice. f Quantification of the number of HA positive villi in the ileum of hαSyn mice. g Representative immunofluorescence images of either the colon or the spleen (h) of hαSyn mice (n = 3). i Quantification of GFP positive villi in the ileum of GFP mice. j Whole gut transit quantification at 1, 5, and 10 weeks after injection in EV, hαSyn, or GFP mice. Scale bars represent 50 µm in larger images and 10 µm in the inserts. All graphs depict EV (blue), hαSyn (red), and GFP (green). Statistical analysis by one-way ANOVA with Tukey’s post hoc (b, c, i) or two-way ANOVA with Bonferroni’s post hoc test (e, f, j). Data are presented as mean values +/− SEM. Source data are provided as a Source data file.
Fig. 2
Fig. 2. Pathological αSyn accumulates in PD mice ilea.
a Representative immunofluorescence images of TH (yellow), αSyn (magenta), and DAPI (blue) without (−PK) or with (+PK) Proteinase K (PK) treatment in the SN (top) or the ileum (bottom) of hαSyn mice 5 weeks following the injection. b Quantification of the MFI of αSyn in the +PK SN of EV and hαSyn mice at 1, 5, and 10 weeks following AAV injection. c Quantification of the αSyn+ profiles in villi following PK treatment in the ileum of EV or hαSyn animals at 1, 5, and 10 weeks following viral vector injection. d Representative image of HA (green), pαSyn (magenta), and DAPI (blue) in the ileum of an hαSyn animal five weeks following viral vector injection. e Quantification of the number of pαSyn+ villi in the ileum of the EV and hαSyn animals at 1, 5, and 10 weeks following viral vector injection. N numbers are indicated below each graph. All graphs depict EV (blue) and hαSyn (red). Scale bars represent 50 μm in larger images and 10 μm in the insert. Statistical analysis by two-way ANOVA with Bonferroni’s post hoc test. Data are presented as mean values +/− SEM. Source data are provided as a Source Data file.
Fig. 3
Fig. 3. CD11c+ aSyn+ cells are present in the brain and ileum of PD mice and patients.
a Representative immunofluorescence images of TH (yellow), αSyn (magenta), CD11c (green), and DAPI (blue) from the ileum (top) and the SN (bottom) of hαSyn mice 5 weeks following viral vector injection (representative of 5 mice). Representative histogram plot (b) and quantification (c) of αSyn MFI in the ileal CD11c+ cells of hαSyn (red) or EV (blue) mice 5 weeks following viral vector injection. d Representative images and quantification (e) of CD11c (red) and αSyn (green) in the SN of control or PD patients. Arrows represent CD11c+ cells, zoomed in image of αSyn+CD11c+ cells, insert depicts a neuron containing an αSyn+ Lewy body. f Representative histogram plots and quantification (g) of CD86 expression in CD11c+ cells. h Representative image of CD11c (red) and αSyn (green) from the terminal ileum of one PD patient. Arrowhead indicates αSyn+ cell. i Quantification of aSyn+ Villi in hαSyn WT (black) and CD11c.DOG (orange) mice treated with diphtheria toxin. Statistical analysis by unpaired one-tailed Student’s t test (c, e, i) and two-way ANOVA with Bonferroni’s post hoc test (g). Scale bars represent 50 μm in larger images and 10 μm in the inserts for (a, d), and 20 μm for h. Data are presented as mean values +/− SEM. Source data are provided as a Source data file.
Fig. 4
Fig. 4. The ileum and brain share a unique microglia-like CD11c+ population.
a UMAP of the different CD11c+ single-cell transcriptome subpopulations identified in the spleen, brain, and ileum from EV and hαSyn animals. b Heatmap demonstrating the top 20 markers identified in each CD11c+ luster. Clusters are color-coded along the top of the graph using the same colors in (a). c UMAP as in (a) demonstrating the cells partitioned by cellular organ of origin: distinct clustering of the CD11c+ cells from brain (brown), ileum (magenta), or spleen (gray) of EV and hαSyn animals. d Bar graph displaying the relative percent of each CD11c+ cluster in the spleen, ileum, and brain of EV or hαSyn animals. e Bar graph of the top ten upregulated GO terms enriched in the TRM 1 cluster. f Dotplot demonstrating the average expression of select pro-inflammatory genes present in the top 5 GO Terms described in (e). Sequencing data is from the pooled organs of 5 EV and 5 hαSyn animals harvested 5 weeks following viral vector injection.
Fig. 5
Fig. 5. The brain and ileum share a cluster of migrating CD11c+ cells.
a Dotplot of selected microglia marker genes. b Violin plot of Ptprc (CD45) expression in the different CD11c+ clusters. c Network plot of the top 120 upregulated GO terms in the Macrophage 1 cluster. Migration related terms are bolded. Enrichment was determined using a one-sided hypergeometric test and the Benjamini–Hochberg correction for multiple comparisons. d Heatmap of the genes in the Leukocyte Migration GO term. e Representative IHC of LRP1 and HA in the distal ileum of hαSyn mice five weeks post-OP (n = 3 mice). Scale bars represent 50 μm in the larger images and 10 μm in the inserts.
Fig. 6
Fig. 6. CD11c+ cells traffic from the brain to the ileum.
a Diagram (created with BioRender.com) and representative dotplots of photoconverted cells in the brain (top) and the ileum (bottom) from either hαSyn or EV with photoexposure (+stim) or without photoexposure (−stim). b Quantification of the % of photoconverted Dendra2 cells in the ileum. c Linear regression analysis of the percent of photoconverted cells in the ileum versus the photoconverted cells in the brain (n = 8). d Representative FACs analysis of Dendra2_Green and Dendra2_Red cells from the cervical lymph node and spleen of photoconverted animals (n = 8), images shown are from the EV + stim animal in (a). e Representative density plots and quantification (f) of the percent CD11c+ cells in the brain and ileum of photoconverted mice. All graphs depict EV (blue) and hαSyn (red). Statistical analysis by unpaired one-tailed Student’s t test (b) and two-way ANOVA with Bonferroni’s post hoc test (f). Data are presented as mean values +/− SEM. Source data are provided as a Source data file.

Comment in

References

    1. Grotemeyer A, McFleder RL, Wu J, Wischhusen J, Ip CW. Neuroinflammation in Parkinson’s disease – putative pathomechanisms and targets for disease-modification. Front. Immunol. 2022;13:878771. doi: 10.3389/fimmu.2022.878771. - DOI - PMC - PubMed
    1. Hiltensperger M, et al. Skin and gut imprinted helper T cell subsets exhibit distinct functional phenotypes in central nervous system autoimmunity. Nat. Immunol. 2021;22:880–892. doi: 10.1038/s41590-021-00948-8. - DOI - PMC - PubMed
    1. Devos D, et al. Colonic inflammation in Parkinson’s disease. Neurobiol. Dis. 2013;50:42–48. doi: 10.1016/j.nbd.2012.09.007. - DOI - PubMed
    1. Sampson TR, et al. Gut microbiota regulate motor deficits and neuroinflammation in a model of Parkinson’s disease. Cell. 2016;167:1469.e12–1480.e12. doi: 10.1016/j.cell.2016.11.018. - DOI - PMC - PubMed
    1. Borghammer P, Van Den Berge N. Brain-first versus gut-first Parkinson’s disease: a hypothesis. J. Park. Dis. 2019;9:S281–S295. - PMC - PubMed

Publication types

Substances

Associated data