. 2023 Dec 21;89(12):e0083223.
doi: 10.1128/aem.00832-23. Epub 2023 Nov 20.

Modeling of recovery efficiency of sampling devices used in planetary protection bioburden estimation

Affiliations

Modeling of recovery efficiency of sampling devices used in planetary protection bioburden estimation

Michael DiNicola et al. Appl Environ Microbiol. .

Abstract

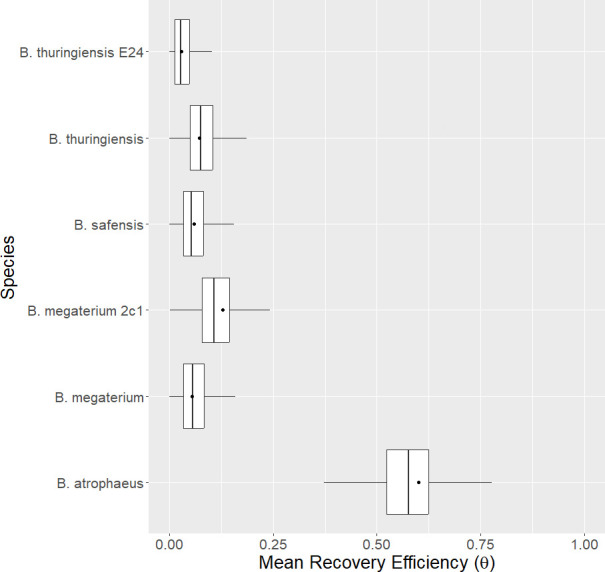
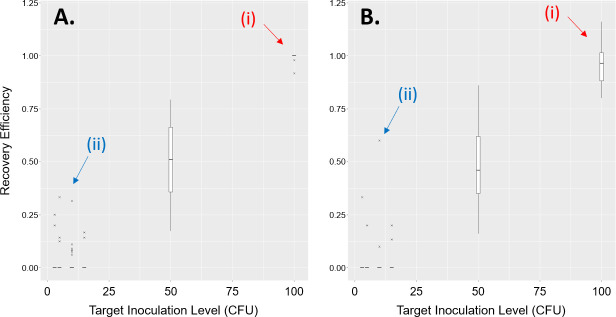
Planetary protection at the National Aeronautics and Space Administration (NASA) requires bioburden on certain spacecraft to be estimated via sampling in order to comply with biological cleanliness requirements. To achieve this, the recovery efficiency of devices used to sample the spacecraft pre-launch must be understood and their uncertainty quantified in order to produce the most reasonable estimates of bioburden. This study brings together experiments performed by NASA and the European Space Agency with approved swab and wipe sampling devices, inoculating steel coupons with laboratory strains of Bacillus spp. spores commonly recovered from spacecraft assembly clean rooms (B. atrophaeus, B. megaterium, B. safensis and B. thuringiensis), with a mathematical model of the assay process to assess recovery efficiency. The statistical treatment developed in this study allows comparison of bioburden estimates made from different devices processed by different methods. This study also gives stakeholders and practitioners a statistically rigorous approach to predict bioburden that can be folded into future modeling efforts.

Keywords: assay; bioburden; planetary protection; recovery efficiency.


Conflict of interest statement

The authors declare no conflict of interest.

Figures

Fig 1
Fig 1
The seeding and recovery processes used in the swab recovery efficiency experiments of this study. (Left) A coupon is prepared by transferring a targeted number of spores from a stock solution of a known species onto the coupon (inoculation) and left to dry for 24 hours. Next, (middle) a sampling device (swab or wipe) is applied to the coupon, after which, it is contained and delivered to the lab for culture. Finally, (right) spores are extracted into a water solution which is then plated in Trypticase soy agar (TSA). Final CFU counts are made at 72 hours in culture, giving the observed data. This process is performed according to standard protocols (NASA or ESA standard assay). Key mathematical notation used in this study to model this process is shown at the bottom. A comprehensive list of all mathematical notation used in this study can be found in Appendix A.
Fig 2
Fig 2
The mean recovery efficiency (probability of an individual spore being recovered, θ) with respect to the target inoculation level for swab experiments (A–F) and wipe experiments (G, H) performed in this study with B. atrophaeus. The mean value of θ is shown by the solid line; 50% and 95% credibility intervals for θ are shown by darker and lighter gray ribbons, respectively (ragged edges of ribbons are due to simulation variation). Calculations of the mean recovery efficiency from experiment are shown by black dots.
Fig 3
Fig 3
The mean recovery efficiency (probability of an individual spore being recovered, θ) with respect to species for the nylon-flocked swab; target inoculation level = 100 CFU. Box and whisker plots show the modeled middle 50% and 95% credibility intervals, respectively. The model’s mean value is shown by the solid vertical line in the middle of the box. Mean recovery efficiencies calculated from experiment are shown by black dots.
Fig 4
Fig 4
Validation of the mathematical model developed in this study for the nylon-flocked swab (B. atrophaeus, ESA facility, ESA standard method). On the left, the seeding model predictions (gray ribbons and solid line) are compared with the actual data observations (box-whisker plots) from controls. The center graphic shows the mean recovery efficiency (probability of individual spore recovery, θ) with model predictions (gray ribbons and solid line) compared with recovery efficiencies calculated from experiment (black dots). On the right, the integrated seeding and recovery model predictions (gray ribbons and solid line) are compared with the actual data observations (box-whisker plots) from recovery efficiency experiments. The mean value of the model is shown by the solid line; 50% and 95% credibility intervals of the model are shown by darker and lighter gray ribbons, respectively (ragged edges of ribbons are due to simulation variation). Box and whisker plots show the middle 50% and 95% ranges, respectively, calculated from the data. The model validates very well with observation, capturing the dispersion in the observed data.
Fig 5
Fig 5
Over-dispersion in a simpler model (A) warranting a more complex model (B) to capture this additional variability in the data. Red arrows in (A) at 0, 10, and 14 observed CFU point to clear evidence of over-dispersion. The curves in each plot show model predictions, which is overlaid with a dot plot of the actual observations made from experiment (TX3211 wipe, target inoculation level = 16 CFU).
Figure A1
Figure A1
The mean recovery efficiency (probability that an individual spore is recovered, θ) with respect to species for the Puritan cotton swab using the NASA Standard processing technique; target inoculation level = 100 CFU. Box and whisker plots show the modeled middle 50% and 95% credibility intervals, respectively. The model’s mean value is shown by the solid vertical line in the middle of the box. Mean recovery efficiencies calculated from experiment are shown by black dots.
Figure A2
Figure A2
The mean recovery efficiency (probability that an individual spore is recovered, θ) with respect to species for the nylon-flocked swab using the ESA Standard processing technique; target inoculation level = 100 CFU. Boxbox and whisker plots show the modeled middle 50% and 95% credibility intervals, respectively. The model’s mean value is shown by the solid vertical line in the middle of the box. Mean recovery efficiencies calculated from experiment are shown by black dots.
Figure A3
Figure A3
The mean recovery efficiency (probability that an individual spore is recovered, θ) with respect to species for the Copan cotton swab using the NASA Standard processing technique; target inoculation level = 100 CFU. Boxbox and whisker plots show the modeled middle 50% and 95% credibility intervals, respectively. The model’s mean value is shown by the solid vertical line in the middle of the box. Mean recovery efficiencies calculated from experiment are shown by black dots.
Figure A4
Figure A4
The mean recovery efficiency (probability that an individual spore is recovered, θ) with respect to species for the Copan PE swab using the ESA Standard processing technique; target inoculation level = 100 CFU. Box and whisker plots show the modeled middle 50% and 95% credibility intervals, respectively. The model’s mean value is shown by the solid vertical line in the middle of the box. Mean recovery efficiencies calculated from experiment are shown by black dots.
Figure A5
Figure A5
The mean recovery efficiency (probability that an individual spore is recovered, θ) with respect to species for the TX3211 wipe using the NASA Standard processing technique with Milliflex filtration; target inoculation level = 400 CFU. Boxbox and whisker plots show the modeled middle 50% and 95% credibility intervals, respectively. The model’s mean value is shown by the solid vertical line in the middle of the box. Mean recovery efficiencies calculated from experiment are shown by black dots.
Figure A6
Figure A6
The mean recovery efficiency (probability that an individual spore is recovered, θ) with respect to species for the TX3224 wipe using the NASA Standard processing technique with Milliflex filtration; target inoculation level = 400 CFU. Boxbox and whisker plots show the modeled middle 50% and 95% credibility intervals, respectively. The model’s mean value is shown by the solid vertical line in the middle of the box. Mean recovery efficiencies calculated from experiment are shown by black dots.
Figure A7
Figure A7
Simulated recovery efficiency experiments with a strong increasing trend with inoculation level. Panel (A) shows box plots of the actual recovery efficiency ratios. Panel (B) shows box plots of the same ratios but with a denominator fixed at a single value (the mean number of CFU observed from control experiments at each target inoculation level). The box represents the inter-quartile range, the whiskers the 95% data range, and outliers denoted by “×” symbols. The mean value is indicated by the horizontal line in the box. Arrows for (i) and (ii) draw attention to the bias and general disruption of the variance structure in Panel (B) relative to Panel (A).
Figure A8
Figure A8
Simulated recovery efficiency experiments with no trend with inoculation level and an average recovery efficiency of 50%. Panel (A) shows box plots of the actual recovery efficiency ratios. Panel (B) shows box plots of the same ratios but with a denominator fixed at a single value (the mean number of spores inoculated onto the coupon at each target inoculation level). The box represents the inter-quartile range, the whiskers the 95% data range, and outliers denoted by “×” symbols. The mean value is indicated by the horizontal line in the box. Arrows for (i) draw attention to the significant bias and disruption of the variance structure in Panel (B) relative to Panel (A) at lower inoculation levels.

References

    1. United Nations, treaty series, p 8843. 1967. In Treaty on principles governing the activities of States in the exploration and use of outer space, including the moon and other celestial bodies. opened for signature at Moscow, London and Washington, on 27 January 1967
    1. National Aeronautics and Space Administration (NASA) . 2022. Implementing planetary protection requirements for space flight. NASA-STD-8719.27
    1. Puleo JR, Fields ND, Bergstrom SL, Oxborrow GS, Stabekis PD, Koukol R. 1977. Microbiological profiles of the Viking spacecraft. Appl Environ Microbiol 33:379–384. doi:10.1128/aem.33.2.379-384.1977 - DOI - PMC - PubMed
    1. Hendrickson R, Kazarians G, Benardini Iii JN. 2020. Planetary protection implementation on the interior exploration using seismic investigations, geodesy and heat transport mission. Astrobiology 20:1151–1157. doi:10.1089/ast.2019.2098 - DOI - PubMed
    1. Smith SA, Benardini JN, Anderl D, Ford M, Wear E, Schrader M, Schubert W, DeVeaux L, Paszczynski A, Childers SE. 2017. Identification and characterization of early mission phase microorganisms residing on the Mars science laboratory and assessment of their potential to survive Mars-like conditions. Astrobiology 17:253–265. doi:10.1089/ast.2015.1417 - DOI - PMC - PubMed

Publication types

LinkOut - more resources