. 2023 Dec 15;29(24):5155-5172.
doi: 10.1158/1078-0432.CCR-23-1427.

A PERK-Specific Inhibitor Blocks Metastatic Progression by Limiting Integrated Stress Response-Dependent Survival of Quiescent Cancer Cells

Affiliations

A PERK-Specific Inhibitor Blocks Metastatic Progression by Limiting Integrated Stress Response-Dependent Survival of Quiescent Cancer Cells

Veronica Calvo et al. Clin Cancer Res. .

Abstract

Purpose: The integrated stress response (ISR) kinase PERK serves as a survival factor for both proliferative and dormant cancer cells. We aim to validate PERK inhibition as a new strategy to specifically eliminate solitary disseminated cancer cells (DCC) in secondary sites that eventually reawake and originate metastasis.

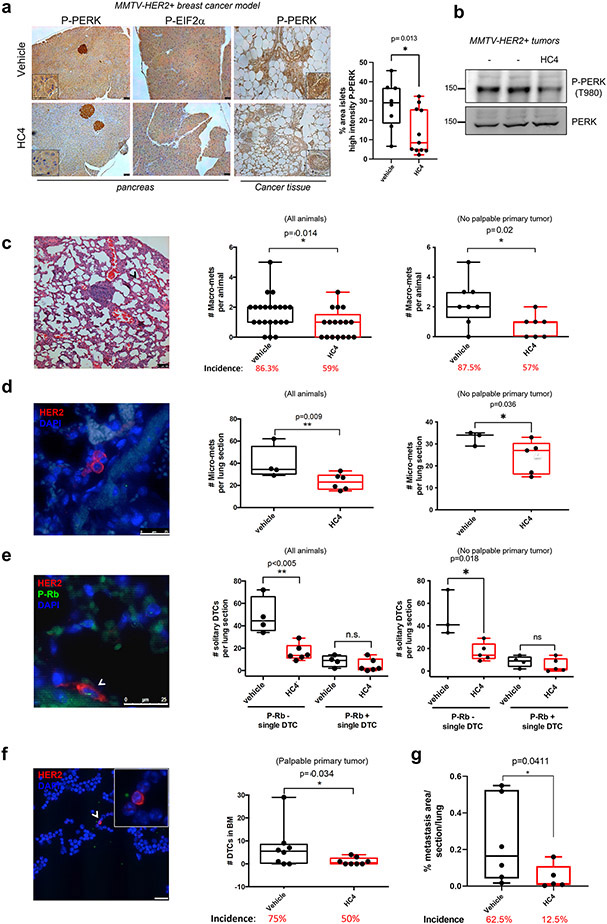
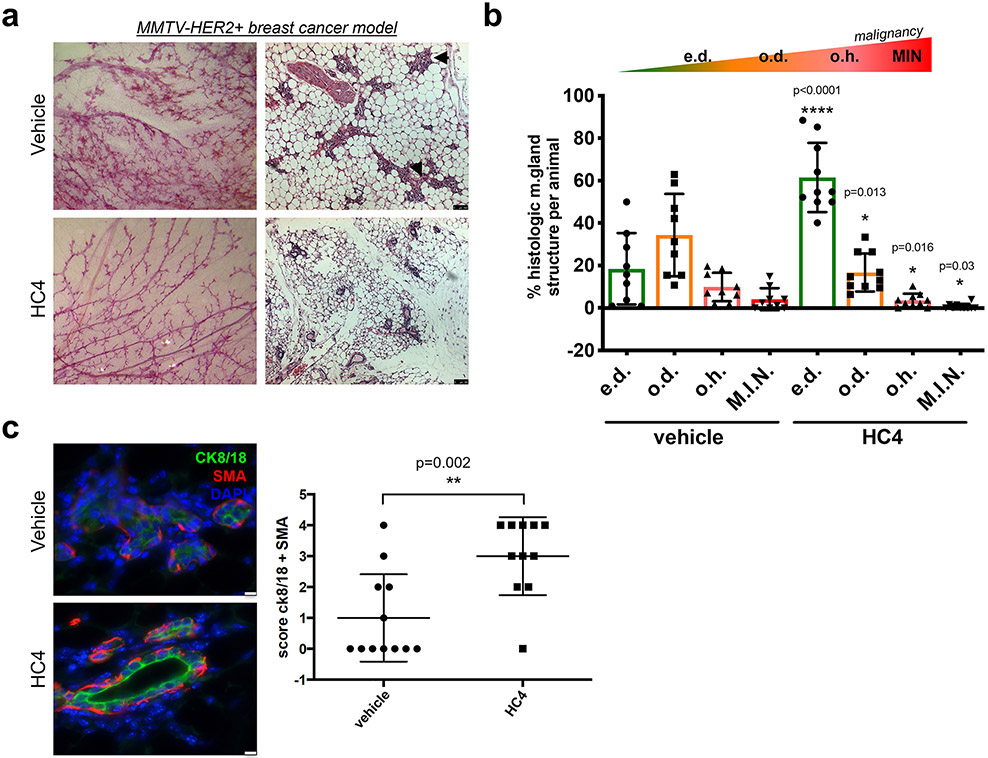
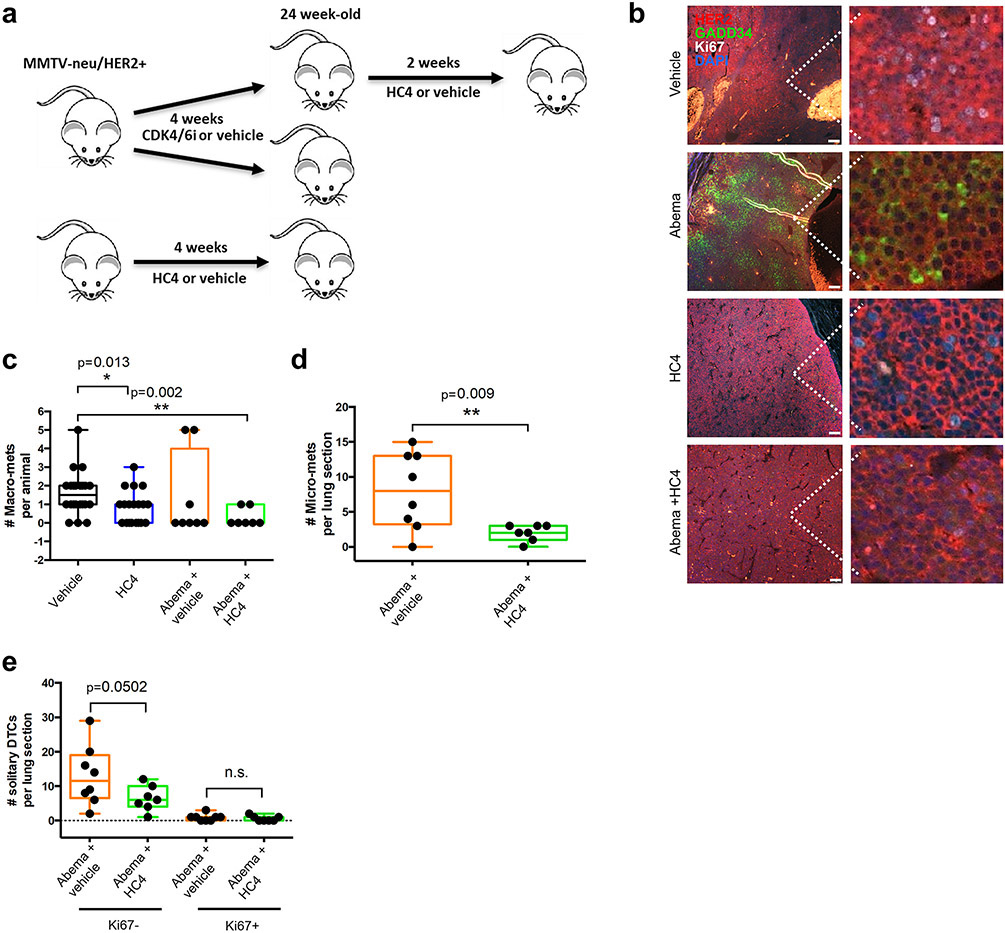
Experimental design: A novel clinical-grade PERK inhibitor (HC4) was tested in mouse syngeneic and PDX models that present quiescent/dormant DCCs or growth-arrested cancer cells in micro-metastatic lesions that upregulate ISR.

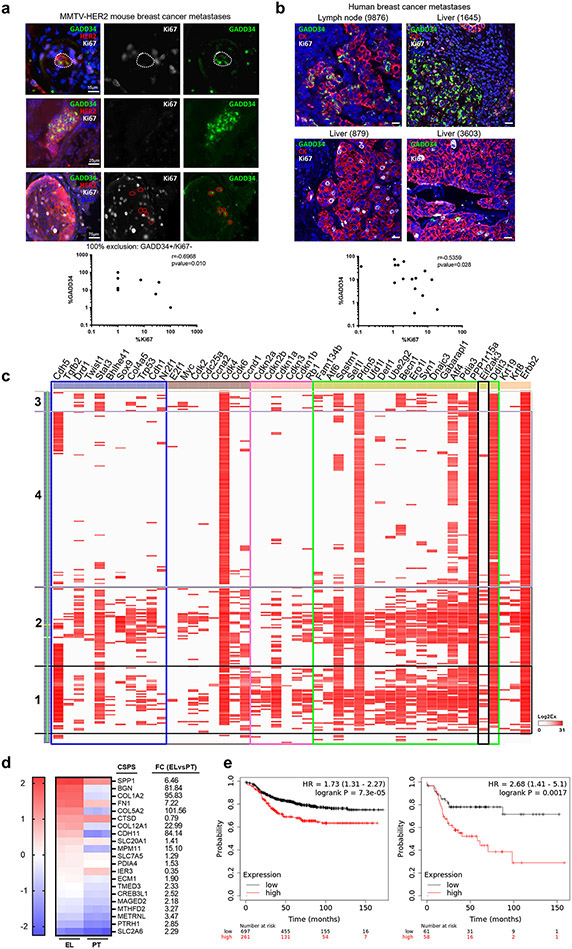
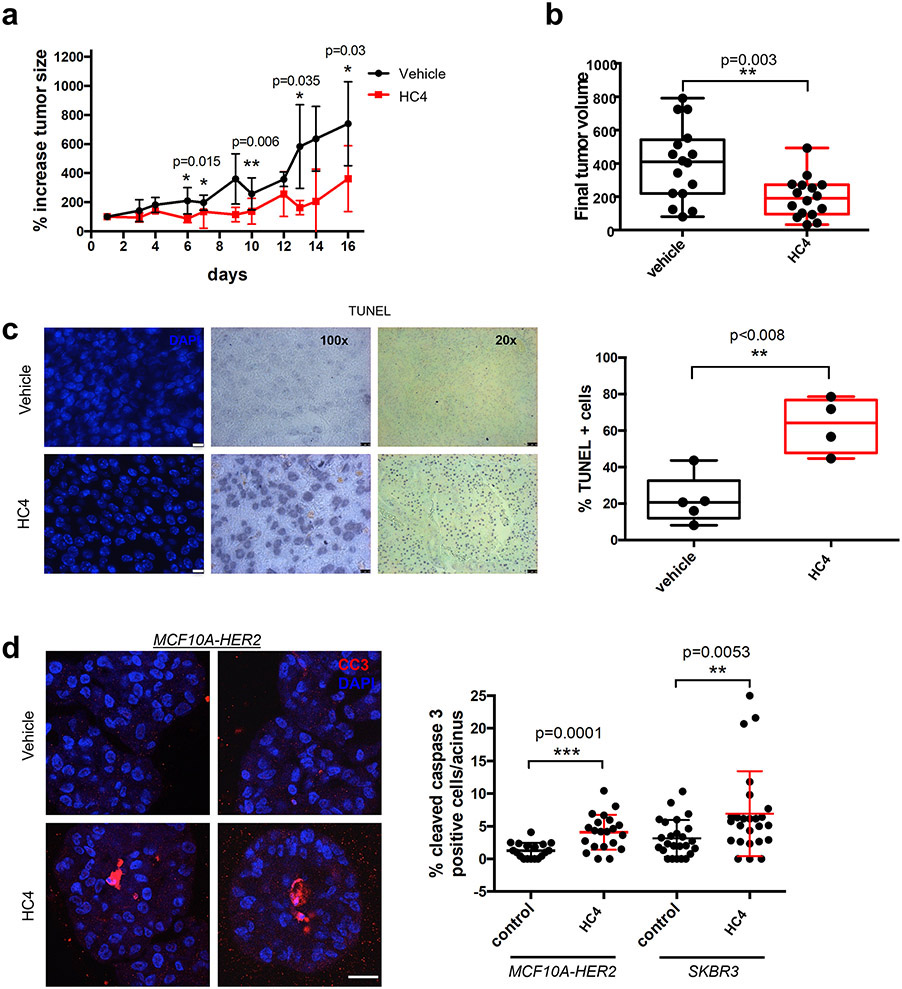
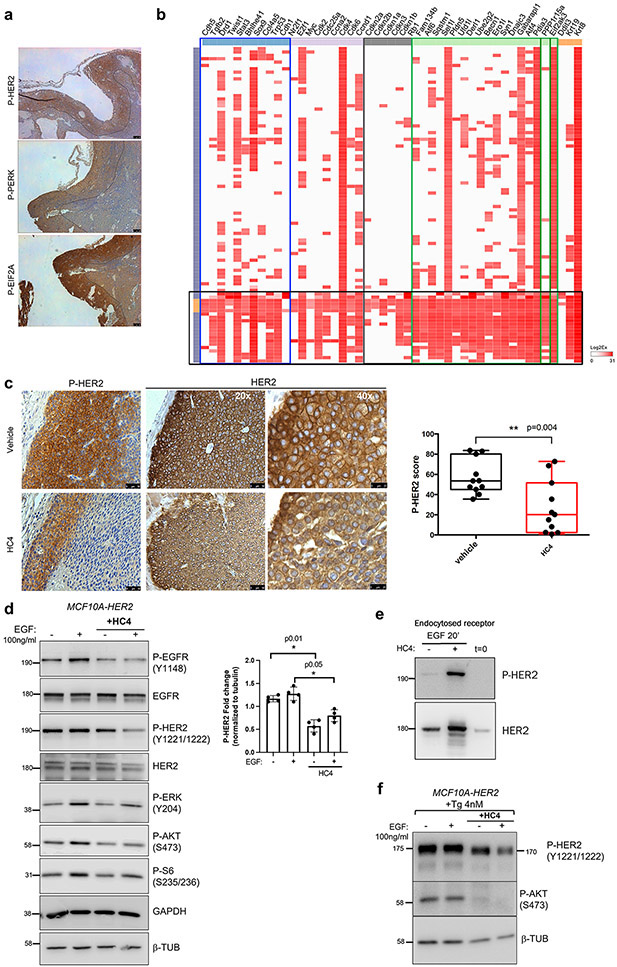
Results: HC4 significantly blocks metastasis, by killing quiescent/slow-cycling ISRhigh, but not proliferative ISRlow DCCs. HC4 blocked expansion of established micro-metastasis that contained ISRhigh slow-cycling cells. Single-cell gene expression profiling and imaging revealed that a significant proportion of solitary DCCs in lungs were indeed dormant and displayed an unresolved ER stress as revealed by high expression of a PERK-regulated signature. In human breast cancer metastasis biopsies, GADD34 expression (PERK-regulated gene) and quiescence were positively correlated. HC4 effectively eradicated dormant bone marrow DCCs, which usually persist after rounds of therapies. Importantly, treatment with CDK4/6 inhibitors (to force a quiescent state) followed by HC4 further reduced metastatic burden. In HNSCC and HER2+ cancers HC4 caused cell death in dormant DCCs. In HER2+ tumors, PERK inhibition caused killing by reducing HER2 activity because of sub-optimal HER2 trafficking and phosphorylation in response to EGF.

Conclusions: Our data identify PERK as a unique vulnerability in quiescent or slow-cycling ISRhigh DCCs. The use of PERK inhibitors may allow targeting of pre-existing or therapy-induced growth arrested "persister" cells that escape anti-proliferative therapies.


Conflict of interest statement

Conflict of Interests

JAAG is a scientific co-founder of, scientific advisory board member and equity owner in HiberCell and receives financial compensation as a consultant for HiberCell, a Mount Sinai spin-off company focused on therapeutics that prevent or delay cancer recurrence. VC, EFF, SF, DL, AN, MES and MM are HiberCell employees. The remaining authors declare no conflicts of interest.

Figures

Figure 1.
Figure 1.. Quiescent disseminated HER2+ cells display high levels of ISR PERK pathway activation.
(a) Lung sections of MMTV-HER2 animals were stained for HER2, Ki67 (proliferation marker) and GADD34 (ER stress marker). The cells/met positive for either marker was quantified and shown as percentage of total cells and correlation was plotted (N=13). (b) Human breast cancer metastases from different locations (lymph node, liver, lung) were stained for cytokeratins, Ki67 (proliferation) and GADD34 (ER stress). The cells/met positive for either marker was quantified and shown as percentage of total cells and correlation was plotted (N=10), scale bar 25 μm. (c) Hierarchical clustering of the high-throughput targeted-gene expression (columns) profile of single cells (lung DCCs) (rows). Blue box, dormancy genes; brown box, cell cycle up genes; pink box, cell cycle down genes; green box, ER stress genes; black box, EIF2AK3 (PERK) gene. (d) Heat map showing the mRNA expression and fold-change (FC) of the previously published cancer-specific PERK signature (CSPS) genes (20) from bulk RNAseq analysis in MMTV-HER2 mammary gland early lesions (EL) and mammary primary tumors (PT) (26). (e) Distant metastasis-free survival Kaplan-Meier curve of all subtypes (left, N=958) and HER2+ (right, N=119) breast cancer patients stratified by CSPS expression using KM Plotter software.
Figure 2.
Figure 2.. HC4 PERK inhibition decreases metastatic disease in lungs and bone marrow through elimination of quiescent DCCs
(a) MMTV-HER2 females (24-week-old) were injected daily with vehicle or HC4 (50 mpk) for 2 weeks. IHC of pancreas and mammary gland sections with antibodies to P-PERK and P-EIF2α. Inserts show higher magnifications. Scale bars, 100 μm (left panel). Quantitation of the percentage area in the pancreas islets that show high intensity P-PERK staining (threshold method) (vehicle N=8, HC4 N=11) (right panel). (b) MMTV-HER2 tumors from control and HC4 treated mice were analyzed for P-PERK as well as total PERK levels by Western blot. Representative blot of three is shown. (c) Macro-metastases (>100 cells) were detected by H&E staining and quantified in 5 lung sections/animal ± s.d (vehicle N=22, HC4 N=17). Scale bar, 100 μm. P by Mann-Whitney test. (d) Micro-metastases (2-100 cells) were detected by IF staining using an anti-HER2 antibody and quantified per lung section/animal ± s.d. (vehicle N=6, HC4 N=6). Scale bar, 25 μm. P by Mann-Whitney test. (e) Solitary DCCs were detected by IF staining for HER2, classified as P-Rb+ or P-Rb− and quantified per lung section ± s.d. (vehicle N=5, HC4 N=6). Scale bar, 25 μm. P by Mann-Whitney test. (f) DCCs in bone marrow were detected by IF staining for HER2 in cytospins from mature hematopoietic cell-depleted bone marrow tissue (N=8 per condition). Scale bar, 25 μm. P by Mann-Whitney test. Mice were injected with MMTV-HER2 cells from primary tumor lesions via the tail vein, allowed them to expand into established metastatic lesions for 3 weeks and treated with vehicle or HC4 (50 mg/kg) for two additional weeks. (g) Metastasis were detected by H&E or IF (for HER2 detection) staining in 5 lung section/animal ± s.d (vehicle N=6, HC4 N=5) and total metastatic burden was calculated. P by Mann-Whitney test.
Figure 3.
Figure 3.. The PERK inhibitor HC4 causes mammary gland “normalization” in the MMTV-HER2+ breast cancer model.
(a) Representative images of carmine staining of whole mount mammary glands and H&E-stained mammary gland sections from vehicle- and HC4-treated animals. Scale bar, 100 μm (b) Quantification of histological structures (empty duct e.d., occluded duct o.d., occluded hyperplasia o.h. and DCIS-like mammary intraepithelial neoplasia M.I.N) present in H&E-stained mammary gland sections (N=50/animal, animals vehicle N=9, HC4 N=10) found in vehicle- and HC4-treated animals ± s.e.m. P by Mann-Whitney test. (c) IF for epithelial luminal marker cytokeratin 8/18 (CK8/18) and myoepithelial marker Smooth Muscle actin (SMA) in mammary gland sections. Score for CK8/18+ and SMA+ structures per animal, vehicle N=12, HC4 N=11. P by Mann-Whitney test. Scale bar, 75 μm.
Figure 4.
Figure 4.. PERK inhibition impairs tumor growth in MMTV-HER2 females.
(a) MMTV- HER2 females (24- to 32-week-old) presenting overt tumors were injected daily with vehicle or HC4 (50 mpk) for 2 weeks. Percentage variation of tumor size in vehicle- and HC4-treated animals ± s.d. (N=16 per condition). P by Mann-Whitney test. (b) Final tumor volume (mm3). The whiskers represent the min and max of the data (N=16 per condition). P by Mann-Whitney test. (c) Representative IHC of TUNEL staining to measure apoptosis levels in tumor sections. Scale bars, 10 and 50 μm. Graph, percentage TUNEL positive cells in vehicle- and HC4-treated tumor sections (vehicle N=5, HC4 N=4). P by Mann-Whitney test. (d) HER2+ MCF10A-HER2 or SKBR3 cells were seeded on Matrigel and after acinus establishment (day 4) wells were treated with vehicle (control) or HC4 (2 μM) for 10 days. Representative confocal images of MCF10A-HER2 acini IF-stained for cleaved caspase-3. Scale bar 20 μm. Graph, percentage of cleaved caspase-3 positive cells per acini (MCF10A-HER2 N=20 per condition, SKBR3 control N=24, HC4 N=22) ± s.d. P by Student’s t test.
Figure 5.
Figure 5.. HC4 treatment decreases the levels of phospho-HER2 and downstream signaling pathways.
(a) Representative images of IHC for P-HER2, P-PERK and P-EIF2α in a MMTV-HER2 breast tumor section. Note that the rim positive for P-HER2 overlaps with P-PERK and P-EIF2α staining. Scale bar, 100 μm. (b) Hierarchical clustering of the high-throughput targeted-gene expression (columns) profile of single cells (primary breast tumor) (rows) from MMTV-HER2 females. Blue box, dormancy genes; grey box, cell cycle down genes; green box, ER stress genes and EIF2AK3 (PERK) gene; black box, population of primary tumor cells (around 25%) with high levels of ER stress genes expression (c) Representative P-HER2 and total HER2 IHC staining in vehicle- and HC4-treated breast tumors. Quantification of P-HER2 levels in tumor sections, by IHC intensity and area scoring (N=11 per condition) (See Supplementary Fig. S5a). Scale bar, 50 μm in 20X and 25 μm in 40X. P by Mann-Whitney test. (d) MCF10A-HER2 cells were starved o/n and treated +/−HC4 (2 μM), after which +/−EGF (100 ng/ml) was added for 15 min before collection. The levels of P-HER2, P-EGFR, P-AKT, P-S6 and P-ERK, as well as total HER2 and EGFR were assessed by Western blot. GAPDH and ß-tubulin were used as loading controls. Representative blot of three is shown. Densitometry analysis for P-HER2 (N=3) ± s.d. P by Student’s t test. (e) MCF10A-HER2 cells were treated as in (d) and reversible surface receptor biotinylation assay was performed. Endocytosed levels of total HER2 and P-HER2 were assessed. One of two experiments shown. (f) MCF10A-HER2 cells were treated as in (d) in presence of thapsigargin (4 nM). The levels of P-HER2 and P-AKT. ß-tubulin was used as loading control. Representative blot of three is shown.
Figure 6.
Figure 6.. Sequential CDK4/6 inhibitor followed by PERK inhibition enhances the anti-metastatic effect of Abemaciclib.
(a) MMTV-HER2 females (24-week-old) were distributed in groups and treated daily with the CDK4/6 inhibitor Abemaciclib (50 mpk), HC4 (50 mpk) or vehicle for 4 weeks. Abemaciclib treatment was followed by +/−HC4 (50 mpk) for 2 weeks. (b) IF of tumor sections for HER2, Ki67 (proliferation) and GADD34 (ER stress). Scale bars, 100 μm. (c) Macro-metastases (>100 cells) were detected by H&E staining and quantified in 5 lung sections/animal. P by Mann-Whitney test. (d) Micro-metastases (2-100 cells) were detected by IF staining using an anti-HER2 antibody and quantified per lung section/animal ±s.d. P by Mann-Whitney test. (e) Solitary DCCs were detected by IF staining for HER2, classified as Ki67+ or Ki67-and quantified per lung section±s.d. Vehicle N=18, HC4 N=17, Abema+ vehicle N+8, Abema +HC4 N=7. P by Mann-Whitney test.

References

    1. Walter P, Ron D. The unfolded protein response: from stress pathway to homeostatic regulation. Science 2011;334(6059):1081–6 doi 10.1126/science.1209038. - DOI - PubMed
    1. Harding HP, Zhang Y, Zeng H, Novoa I, Lu PD, Calfon M, et al. An integrated stress response regulates amino acid metabolism and resistance to oxidative stress. Mol Cell 2003;11(3):619–33 doi 10.1016/s1097-2765(03)00105-9. - DOI - PubMed
    1. Chevet E, Hetz C, Samali A. Endoplasmic reticulum stress-activated cell reprogramming in oncogenesis. Cancer Discov 2015;5(6):586–97 doi 10.1158/2159-8290.CD-14-1490. - DOI - PubMed
    1. Blais JD, Filipenko V, Bi M, Harding HP, Ron D, Koumenis C, et al. Activating transcription factor 4 is translationally regulated by hypoxic stress. Mol Cell Biol 2004;24(17):7469–82 doi 10.1128/MCB.24.17.7469-7482.2004. - DOI - PMC - PubMed
    1. Tameire F, Verginadis II, Koumenis C. Cell intrinsic and extrinsic activators of the unfolded protein response in cancer: Mechanisms and targets for therapy. Semin Cancer Biol 2015;33:3–15 doi 10.1016/j.semcancer.2015.04.002. - DOI - PMC - PubMed

Publication types