. 2024 Apr 5;116(4):555-564.
doi: 10.1093/jnci/djad243.

Morphological diversity of cancer cells predicts prognosis across tumor types

Affiliations

Morphological diversity of cancer cells predicts prognosis across tumor types

Rasoul Sali et al. J Natl Cancer Inst. .

Abstract

Background: Intratumor heterogeneity drives disease progression and treatment resistance, which can lead to poor patient outcomes. Here, we present a computational approach for quantification of cancer cell diversity in routine hematoxylin-eosin-stained histopathology images.

Methods: We analyzed publicly available digitized whole-slide hematoxylin-eosin images for 2000 patients. Four tumor types were included: lung, head and neck, colon, and rectal cancers, representing major histology subtypes (adenocarcinomas and squamous cell carcinomas). We performed single-cell analysis on hematoxylin-eosin images and trained a deep convolutional autoencoder to automatically learn feature representations of individual cancer nuclei. We then computed features of intranuclear variability and internuclear diversity to quantify tumor heterogeneity. Finally, we used these features to build a machine-learning model to predict patient prognosis.

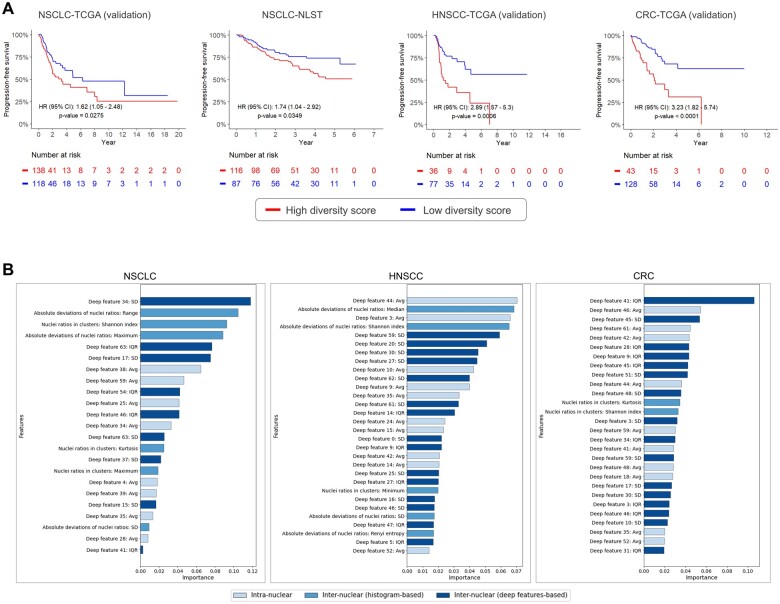
Results: A total of 68 million cancer cells were segmented and analyzed for nuclear image features. We discovered multiple morphological subtypes of cancer cells (range = 15-20) that co-exist within the same tumor, each with distinct phenotypic characteristics. Moreover, we showed that a higher morphological diversity is associated with chromosome instability and genomic aneuploidy. A machine-learning model based on morphological diversity demonstrated independent prognostic values across tumor types (hazard ratio range = 1.62-3.23, P < .035) in validation cohorts and further improved prognostication when combined with clinical risk factors.

Conclusions: Our study provides a practical approach for quantifying intratumor heterogeneity based on routine histopathology images. The cancer cell diversity score can be used to refine risk stratification and inform personalized treatment strategies.


Conflict of interest statement

The authors declare no conflict of interest.

Figures

Figure 1.
Figure 1.
Overall workflow and study design. A) The model was trained and evaluated on 4 independent cohorts in 3 cancer types (ie, NSCLC from TCGA and NLST; HNSCC and CRC from TCGA). B) Multistage image processing pipeline for single-cell analysis: fully automated tumor segmentation, nuclei segmentation, and nuclei classification within the tumor area. C) Each cancer nucleus was extracted as a single image; in total, 68 million cancer nuclei images were analyzed. D) A deep convolutional autoencoder was trained to learn feature representations of cancer nuclei. E) Two broad categories of features were investigated to measure tumor heterogeneity: internuclear diversity and intranuclear heterogeneity. The former includes histogram-based diversity features and variability of deep embedding features. F) The histogram-based cell morphology diversity was correlated with underlying genomic features. G-H) A random survival forest model was employed to demonstrate the prognostic value of diversity-based features. CRC = colorectal cancer; HNSCC = head and neck squamous cell carcinomas; NLST = National Lung Screening Trial; NSCLC = non–small cell lung cancer; TCGA = The Cancer Genome Atlas.
Figure 2.
Figure 2.
Cell type classification and cancer nuclei representation by deep learning. A) The confusion matrices for cell type classification into cancer vs noncancer nuclei show high precision. B) The scatter plots show high-fidelity reconstruction of the nuclei images using the deep convolutional autoencoder. C) The heatmap shows the pairwise Pearson correlation between deep embedding features and handcrafted features including nuclear size, shape, and texture features. Deep features that are uncorrelated with handcrafted features are highlighted in the shaded box. ASM = angular second moment; CRC = colorectal cancer; HNSCC = head and neck squamous cell carcinomas; max = maximum; min = minimum; NLST = National Lung Screening Trial; NSCLC = non–small cell lung cancer; TCGA = The Cancer Genome Atlas.
Figure 3.
Figure 3.
Unsupervised clustering reveals morphological subtypes of cancer cells. UMAP (Uniform Manifold Approximation and Projection) plot in the non–small cell lung cancer–The Cancer Genome Atlas cohort showing (A) 15 nuclei clusters and (B) cellular heterogeneity across cancer nuclei in the distribution of handcrafted features including area, circularity, energy, and correlation. C) UMAP plot of cancer nuclei and corresponding histogram showing frequency of cancer cells across different clusters for 2 patients in non–small cell lung cancer–The Cancer Genome Atlas: high entropy (left) and low entropy (right). The patient with high cancer cell diversity developed disease progression only 9 months after initial diagnosis. The other patient had not experienced disease progression after more than 10 years from initial diagnosis.
Figure 4.
Figure 4.
Relation between cancer cell morphological diversity and genome instability, tumor aneuploidy, and patient survival. Boxplots showing the distribution of cancer nuclei diversity measured by Simpson entropy are grouped by (A) chromosomal instability level and (B) aneuploidy level in 3 cancer types (low- and high-level groups were separated by the median value). C) Kaplan–Meier curves for progression-free survival showing association between cancer cell diversity (measured by Simpson entropy) and prognosis across 4 cohorts. P values were generated by log-rank test. CI = confidence interval; CRC = colorectal cancer; HNSCC = head and neck squamous cell carcinomas; HR = hazard ratio; NLST = National Lung Screening Trial; NSCLC = non–small cell lung cancer; TCGA = The Cancer Genome Atlas.
Figure 5.
Figure 5.
A random forest survival model of cancer cell diversity predicts prognosis. A) Kaplan–Meier curves of progression-free survival for stratification of patients by the cancer cell diversity score in the validation cohorts. B) Top-ranked features in the random survival forest across 3 cohorts. Avg = average; CI = confidence interval; CRC = colorectal cancer; HNSCC = head and neck squamous cell carcinomas; HR = hazard ratio; IQR = interquartile range; NLST = National Lung Screening Trial; NSCLC = non–small cell lung cancer; TCGA = The Cancer Genome Atlas.
Figure 6.
Figure 6.
The cancer cell diversity is prognostic independent of clinical risk factors. A) Forest plots showing the hazard ratio and P values obtained from a multivariate Cox regression analysis including the proposed diversity-based risk score and established clinicopathologic factors in all validation sets across 3 cancer types. B) Boxplots show the AUROC for predicting 5-year progression-free survival based on cancer stage, cancer cell diversity score, and linear combination model of the 2 in all validation sets. Stage is used in the combined model because it is the only statistically significant prognostic factor in each cohort. Each boxplot was calculated by bootstrapping with 1000 repetitions. All boxplots contain quartiles and median values; whiskers extend to 1.5 times the interquartile range. *P < .05; **P < .01; ***P < .001. AUROC = area under the receiver operating characteristic curve; CI = confidence interval; CRC = colorectal cancer; HNSCC = head and neck squamous cell carcinomas; NLST = National Lung Screening Trial; NSCLC = non–small cell lung cancer; TCGA = The Cancer Genome Atlas.

References

    1. McGranahan N, Swanton C.. Clonal heterogeneity and tumor evolution: past, present, and the future. Cell. 2017;168(4):613-628. - PubMed
    1. Dagogo-Jack I, Shaw AT.. Tumour heterogeneity and resistance to cancer therapies. Nat Rev Clin Oncol. 2018;15(2):81-94. - PubMed
    1. Turajlic S, Sottoriva A, Graham T, Swanton C.. Resolving genetic heterogeneity in cancer. Nat Rev Genet. 2019;20(7):404-416. - PubMed
    1. Keller L, Pantel K.. Unravelling tumour heterogeneity by single-cell profiling of circulating tumour cells. Nat Rev Cancer. 2019;19(10):553-567. - PubMed
    1. Andor N, Graham TA, Jansen M, et al.Pan-cancer analysis of the extent and consequences of intratumor heterogeneity. Nat Med. 2016;22(1):105-113. - PMC - PubMed