. 2023 Dec 6;15(48):55346-55357.
doi: 10.1021/acsami.3c12122. Epub 2023 Nov 20.

Particle ID: A Multiplexed Hydrogel Bead Platform for Biomedical Applications

Affiliations

Particle ID: A Multiplexed Hydrogel Bead Platform for Biomedical Applications

Lokman Alpsoy et al. ACS Appl Mater Interfaces. .

Abstract

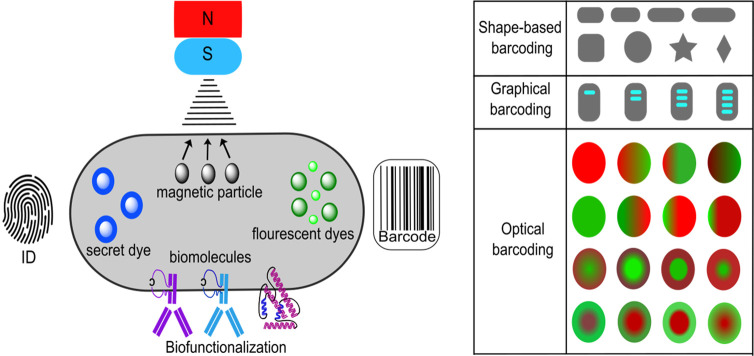
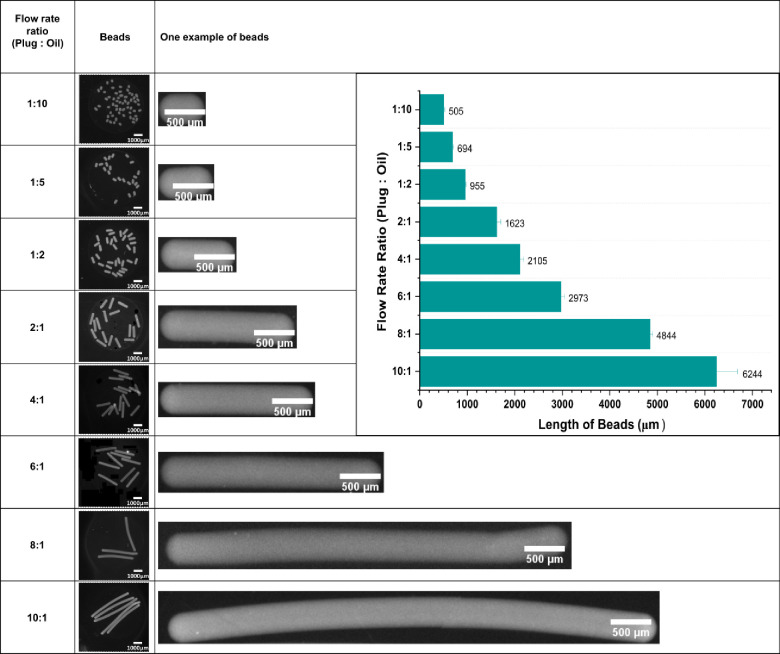
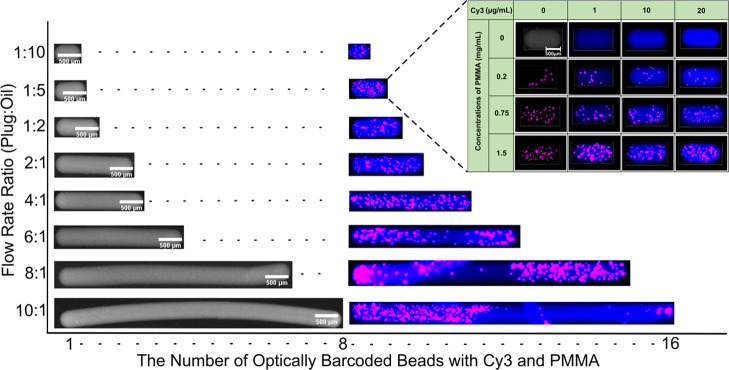
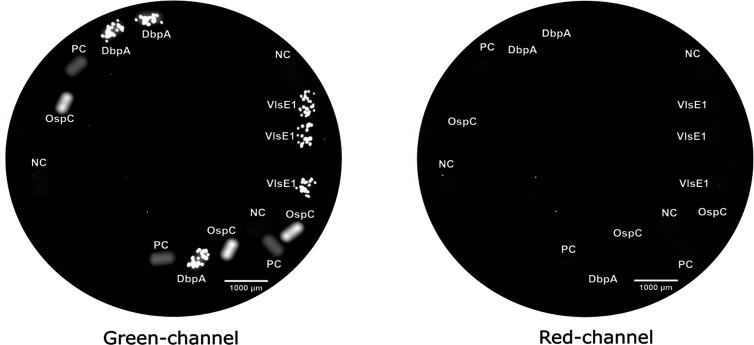
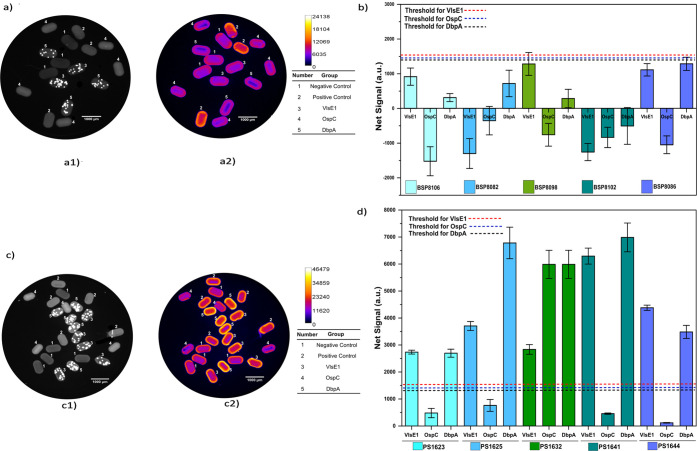
We present a new platform based on hydrogel beads for multiplex analysis that can be fabricated, barcoded, and functionalized in a single step using a simple microfluidic assembly and a photo-cross-linking process. The beads are generated in a two-phase flow fluidic system and photo-cross-linking of the polymer in the aqueous phase by C,H insertion cross-linking (CHic). The size and shape of the hydrogel particles can be controlled over a wide range by fluidic parameters. During the fabrication of the beads, they are barcoded by using physical and optical barcoding strategies. Magnetic beads and fluorescent particles, which allow identification of the production batch number, are added simultaneously as desired, resulting in complex, multifunctional beads in a one-step reaction. As an example of biofunctionalization, Borrelia antigens were immobilized on the beads. Serum samples that originated from infected and non-infected patients could be clearly distinguished, and the sensitivity was as good as or even better than ELISA, the state of the art in clinical diagnostics. The ease of the one-step production process and the wide range of barcoding parameters offer strong advantages for multiplexed analytics in the life sciences and medical diagnostics.

Keywords: 3D bead-based immunoassay; barcoding of beads; biofunctionalization of beads; borelliosis; hydrogel beads; multiplexing.


Conflict of interest statement

The authors declare no competing financial interest.

Figures

Figure 1
Figure 1
Illustration of barcoding strategies and functionalization of the hydrogel beads. The beads can incorporate magnetic particles or proteins and antibodies for biofunctionalization and fluorescent dyes for barcoding. For identification of the production batch, dyes, which are invisible in the fluorescent channels used to analyze the assay or the barcode, can be incorporated into the hydrogel beads. Shape, size, graphical, and optical barcoding strategies are used for barcoding of the beads.
Figure 2
Figure 2
Schematic representation of the indirect ELISA. An antigen-coated surface captures the target antibody from the sample, and employing a labeled secondary antibody enables the measurement of the presence or concentration of the target antibody.
Figure 3
Figure 3
Flowchart of the immunoassay protocol for the detection of Borreliosis biomarkers. Barcoded and biofunctionalized beads are incubated with diluted patient sera and fluorescent anti-IgG. The fluorescent signals of the beads and the antibodies can be read out in the green channel for barcoding and in the red channel for immunoassay.
Figure 4
Figure 4
Shape-based barcoding of the hydrogel beads. Image of the fabricated beads collected in the well of a microtiter plate (scale bar: 1000 μm); micrograph of one example bead from each group andh the length of the beads in the graph (n = 15). Increasing the flow ratio from 1:10 to 10:1 results in an increase of bead length in the range between 505 and 6244 μm, depending on the flow rate ratio plug/oil.
Figure 5
Figure 5
(a) The optically barcoded beads are represented by staining Cy3 (0, 1, 10, and 20 μg/mL) and PMMA fluorescent microparticles (0, 0.2, 0.75, and 1.5 μg/mL) and the mixture of them. Scale bar: 1000 μm. Exposure time: 200 ms. (b) One sample of optically barcoded bead from each of the groups. The intensity of the blue color is for the concentration of Cy3, and the number of purple particles is for the PMMA microparticle. Scale bar: 500 μm. Exposure time: 200 ms.
Figure 6
Figure 6
Combination of shape-based and optical (an example) barcoded hydrogel beads in a graph. Depending on the flow rate ratio, hydrogel beads were fabricated in eight different sizes. Sixteen optically barcoded beads for each size can also be manufactured. The total number of barcoded beads could be translated into the numerical code (CXY) by multiplexing 8 × 16 barcodes (shape-based barcode × optical barcode). Scale bar: 500 μm. Exposure time: 200 ms.
Figure 7
Figure 7
Hydrogel beads with incorporated magnetic particles move in an external magnetic field. In a few seconds, hydrogel beads in a well with a diameter of 2 cm can be collected by using a magnet. The arrow indicates the direction of movement.
Figure 8
Figure 8
Particle ID: identification of the bead production batch through adding an additional blue fluorescent dye at concentrations of 0.1, 0.2, and 0.4 mg/mL. The same beads analyzed in the green channel, in the red channel of a plate reader, and with a blue filter using fluorescence microscopy (scale bar: 1000 μm). The blue microparticles are invisible in the green channel (readout of the barcode of the beads) and in the red channel (readout of protein binding in the immunoassay) but can be used for identification and tracking of batch production data. In the last column, an example of a bead that contains blue fluorescent microparticles is presented (scale bar: 300 μm).
Figure 9
Figure 9
Signal intensities of the same well containing the same beads in the green and the red channel of the readout device at an exposure time of 50 ms (scale bar: 1000 μm). The signal intensity of the detection antibody in the immunoassay reaction (in red channel) is not affected by the signal intensities of the dyes used for barcoding (in green channel). The signal density of the beads in the red channel is almost the same as the background signal. NC: negative control; PC: positive control; VlsE1, OspC, and DbpA test groups for the detection of borreliosis biomarkers.
Figure 10
Figure 10
Average signal density of the beads from five negative sera (BSP8052, BSP8056, BSP8090, BSP8092, and BSP8118) (NC: negative control, PC: positive control. VlsE1, OspC, and DbpA: proteins from different Borrelia species). Error bars represent the standard deviation of three independent experiments (n = 75).
Figure 11
Figure 11
Representative assay results of a negative sample and a positive sample and net signal density of sera. (a) Representative assay results of a negative sample (BSP8090) recorded in the (a1) green and (a2) red channel. (a1) As shown in Figure 9, five different barcoded beads (see Table 1) give signals in the green channel. (a2) In the red channel (exposure time 10 ms), the signal density of the positive control (number 2) whose beads have anti-IgG is higher than the negative control (number 1) and test groups (numbers 3, 4, and 5). Calibration bars denote the signal density of the beads. A false-color image was used to demonstrate differences in the signal intensity of groups. (b) Net signal density of the healthy donor sera (n = 15, mean values and standard deviations of three independent experiments are shown). The dashed lines represent the detection thresholds for each protein (limit of detection). In all negative sera, the net signal densities of the test groups are below the thresholds calculated based on the analysis of five healthy donor sera. (c) Assay result of a positive sample (PS1641). (c1) Five different barcoded beads (Table 1) in the green channel. (c2) In the red channel, the signal density of the positive control (number 2), VlsE1 (number 3), and DbpA (number 5) groups is higher than the negative control (number 1) and the OspC test group (number 4). The calibration bar denotes the signal density of the beads. (d) The mean value of the net signal density of the five positive sera (n = 15, mean values and standard deviations of three independent experiments are shown). The thresholds that were obtained by characterizing five healthy donor sera as described in Fluorescence Measurements and Validation of Assay Results. The dashed lines represent the thresholds for each protein. PS1632, PS1625, PS1641, and PS1644 are positive for VlsE1 and DbpA but negative for OspC antigens. PS1632 is positive for all antigens.

Similar articles

Cited by

References

    1. Hortin G. L.; Sviridov D. The Dynamic Range Problem in The Analysis of the Plasma Proteome. J. Proteom. 2010, 73 (3), 629–636. 10.1016/j.jprot.2009.07.001. - DOI - PubMed
    1. Cheng T.; Zhan X. Pattern Recognition for Predictive, Preventive, and Personalized Medicine in Cancer. EPMA J. 2017, 8 (1), 51–60. 10.1007/s13167-017-0083-9. - DOI - PMC - PubMed
    1. Dejager W.; Rijkers G. Solid-Phase and Bead-Based Cytokine Immunoassay: A Comparison. Methods 2006, 38 (4), 294–303. 10.1016/j.ymeth.2005.11.008. - DOI - PubMed
    1. Graham H.; Chandler D. J.; Dunbar S. A. The Genesis and Evolution of Bead-Based Multiplexing. Methods 2019, 158, 2–11. 10.1016/j.ymeth.2019.01.007. - DOI - PubMed
    1. Wilson R.; Cossins A. R.; Spiller D. G. Encoded Microcarriers for High-throughput Multiplexed Detection. Angew. Chem., Int. Ed. 2006, 45 (37), 6104–6117. 10.1002/anie.200600288. - DOI - PubMed

LinkOut - more resources