

Graph neural network-based breast cancer diagnosis using ultrasound images with optimized graph construction integrating the medically significant features
- PMID: 37982829
- PMCID: PMC10725367
- DOI: 10.1007/s00432-023-05464-w
Graph neural network-based breast cancer diagnosis using ultrasound images with optimized graph construction integrating the medically significant features
Abstract
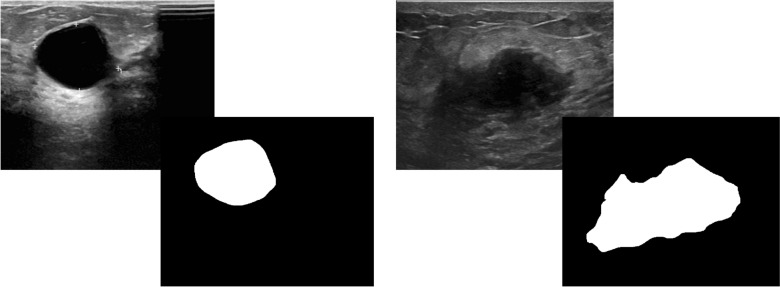
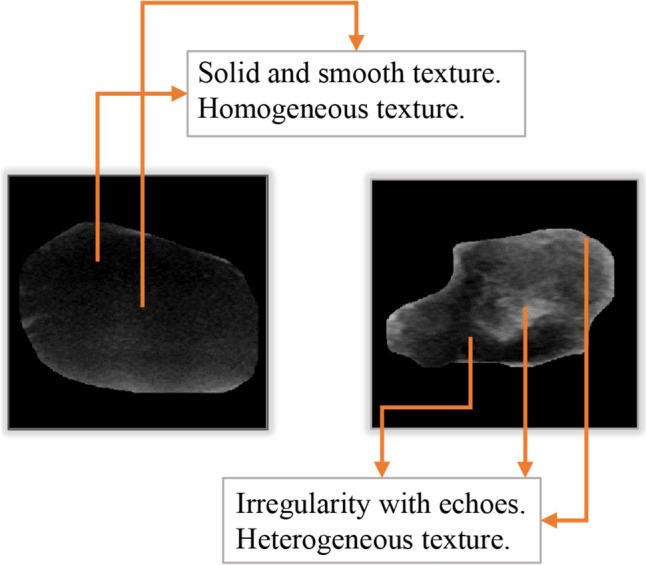
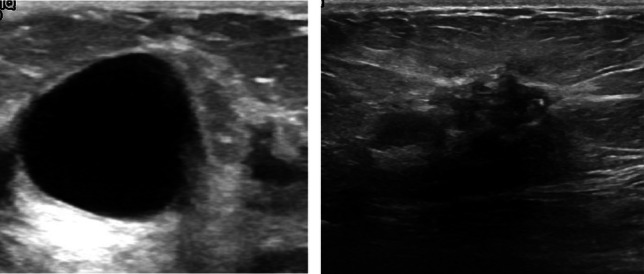
Purpose: An automated computerized approach can aid radiologists in the early diagnosis of breast cancer. In this study, a novel method is proposed for classifying breast tumors into benign and malignant, based on the ultrasound images through a Graph Neural Network (GNN) model utilizing clinically significant features.
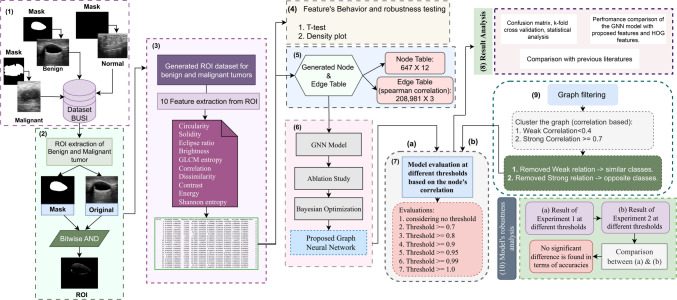
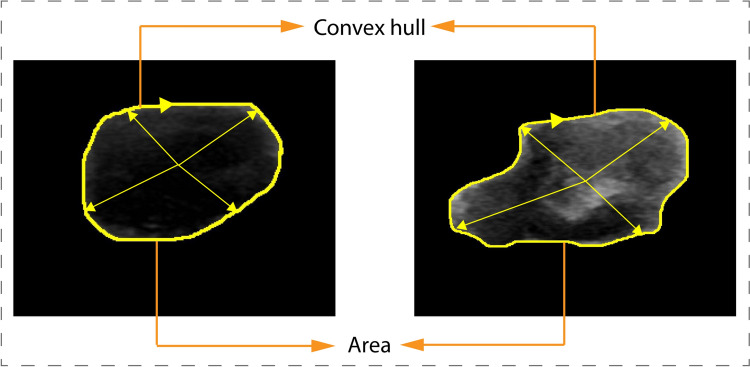
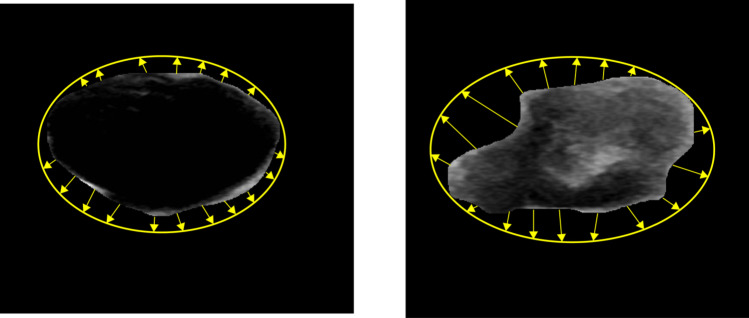
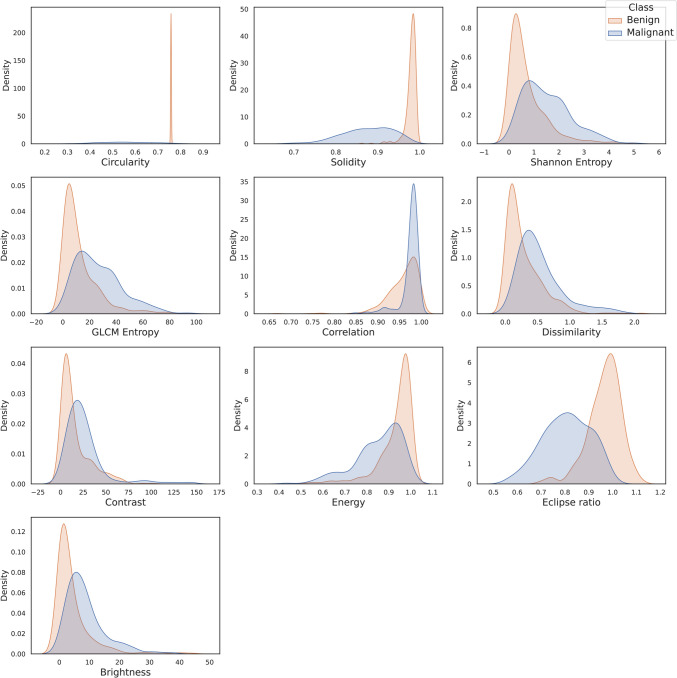
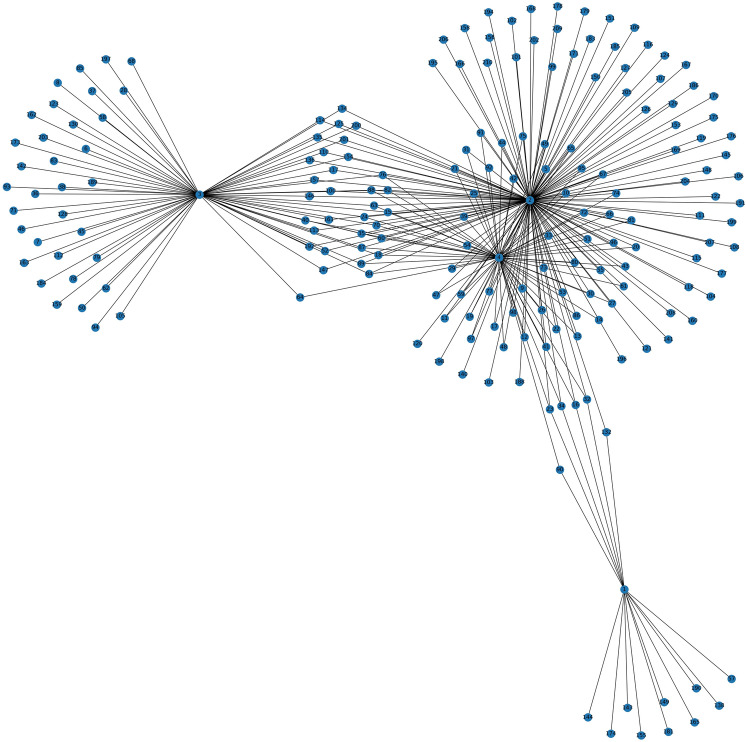
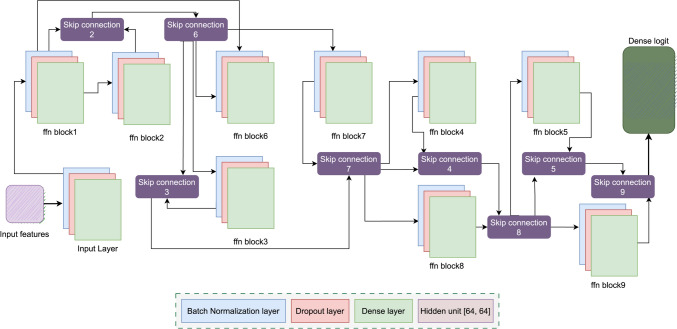
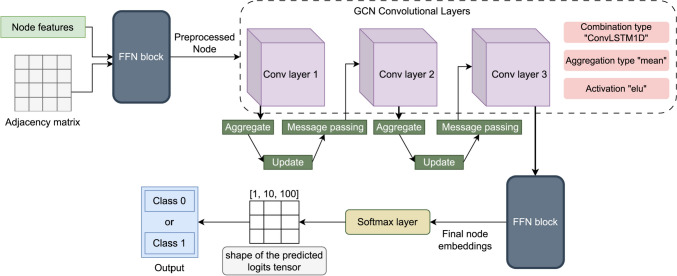
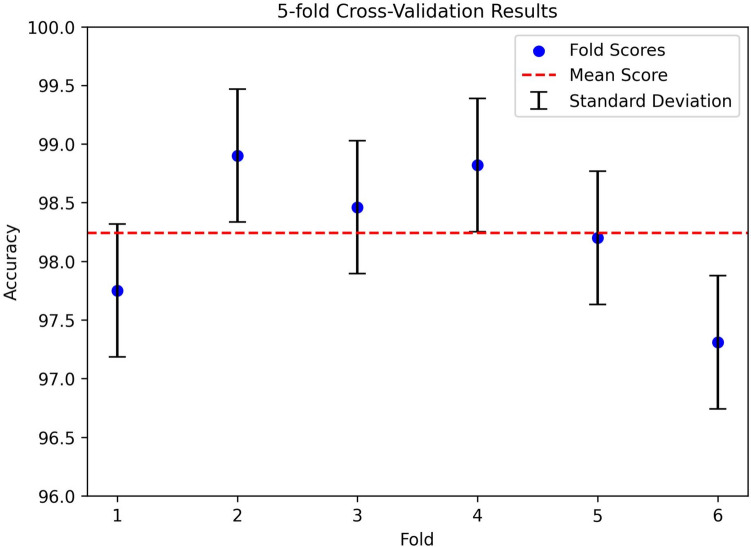
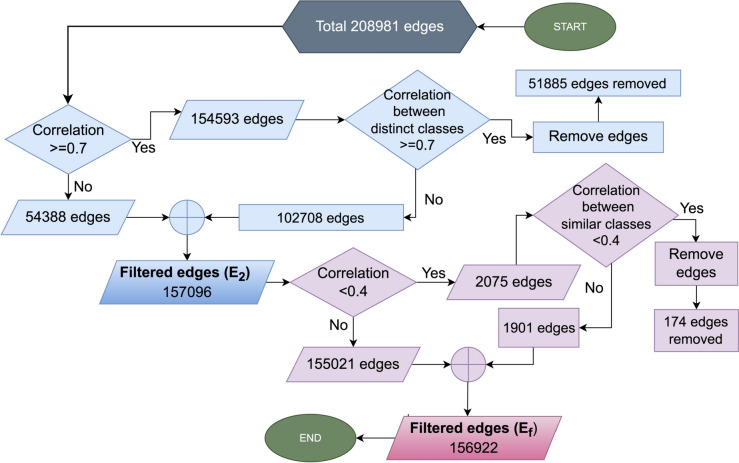
Method: Ten informative features are extracted from the region of interest (ROI), based on the radiologists' diagnosis markers. The significance of the features is evaluated using density plot and T test statistical analysis method. A feature table is generated where each row represents individual image, considered as node, and the edges between the nodes are denoted by calculating the Spearman correlation coefficient. A graph dataset is generated and fed into the GNN model. The model is configured through ablation study and Bayesian optimization. The optimized model is then evaluated with different correlation thresholds for getting the highest performance with a shallow graph. The performance consistency is validated with k-fold cross validation. The impact of utilizing ROIs and handcrafted features for breast tumor classification is evaluated by comparing the model's performance with Histogram of Oriented Gradients (HOG) descriptor features from the entire ultrasound image. Lastly, a clustering-based analysis is performed to generate a new filtered graph, considering weak and strong relationships of the nodes, based on the similarities.
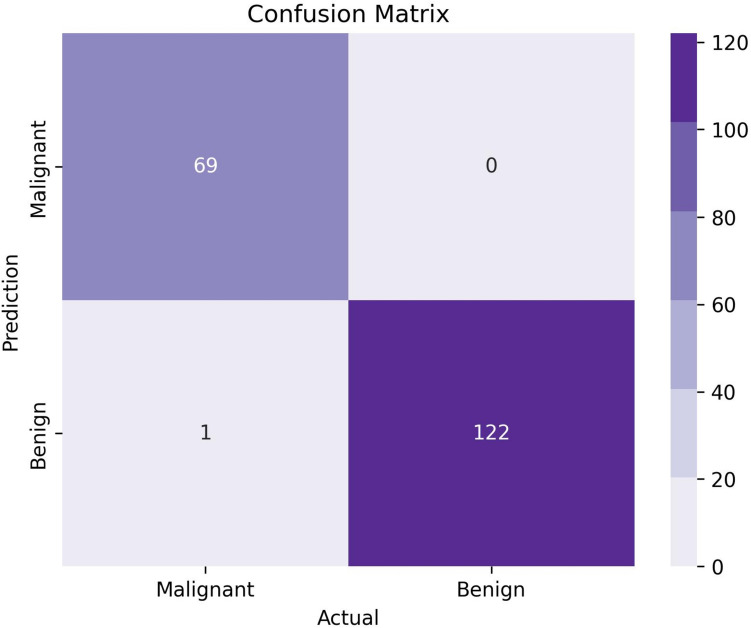
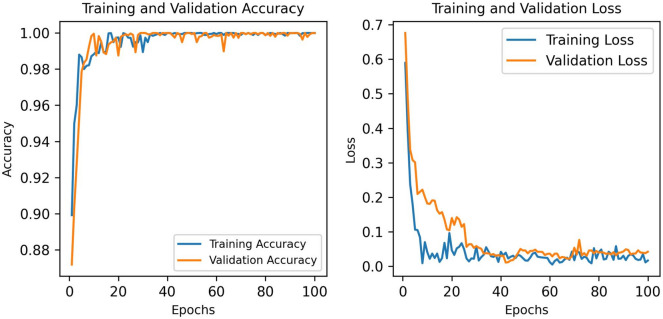
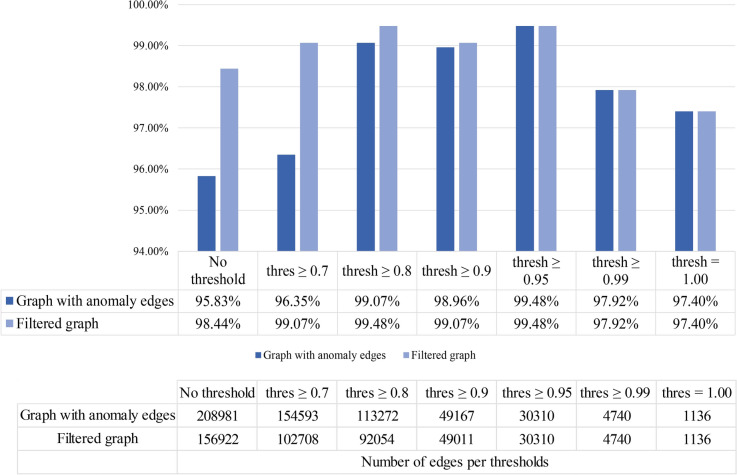
Results: The results indicate that with a threshold value of 0.95, the GNN model achieves the highest test accuracy of 99.48%, precision and recall of 100%, and F1 score of 99.28%, reducing the number of edges by 85.5%. The GNN model's performance is 86.91%, considering no threshold value for the graph generated from HOG descriptor features. Different threshold values for the Spearman's correlation score are experimented with and the performance is compared. No significant differences are observed between the previous graph and the filtered graph.
Conclusion: The proposed approach might aid the radiologists in effective diagnosing and learning tumor pattern of breast cancer.
Keywords: Clustering analysis; Feature extraction; GNN; Graph; Spearman correlation; Threshold.
© 2023. The Author(s).
Conflict of interest statement
The authors declare no competing interests regarding the publication of this paper.
Figures
References
-
- Abadal S, Jain A, Guirado R, López-Alonso J, Alarcón E (2022) Computing graph neural networks: a survey from algorithms to accelerators. ACM Comput Surveys. 10.1145/3477141
-
- Asif NA, Sarker Y, Chakrabortty RK, Ryan MJ, Hafiz Ahamed M, Saha DK, Badal FR et al (2021) Graph neural network: a comprehensive review on non-euclidean space. IEEE Access. Institute of Electrical and Electronics Engineers Inc. 10.1109/ACCESS.2021.3071274
MeSH terms
LinkOut - more resources
Full Text Sources
Medical
