Clinical Trial
. 2024 Feb 1;30(3):489-497.
doi: 10.1158/1078-0432.CCR-23-1631.

A Phase Ib First-In-Patient Study Assessing the Safety, Tolerability, Pharmacokinetics, and Pharmacodynamics of Ponsegromab in Participants with Cancer and Cachexia

Affiliations
Clinical Trial

A Phase Ib First-In-Patient Study Assessing the Safety, Tolerability, Pharmacokinetics, and Pharmacodynamics of Ponsegromab in Participants with Cancer and Cachexia

Jeffrey Crawford et al. Clin Cancer Res. .

Abstract

Purpose: Cachexia is common in patients with advanced cancer and is associated with elevated serum growth differentiation factor 15 (GDF-15) concentrations. This first-in-patient (phase Ib), 24-week study assessed use of ponsegromab, a mAb against GDF-15, in adults with advanced cancer, cachexia, and elevated GDF-15 serum concentration.

Patients and methods: Participants (n = 10) received open-label ponsegromab subcutaneous 200 mg every 3 weeks for 12 weeks in addition to standard-of-care anticancer treatment. Ponsegromab safety, tolerability, and pharmacokinetics were assessed in addition to serum GDF-15 concentrations and exploratory measures of efficacy.

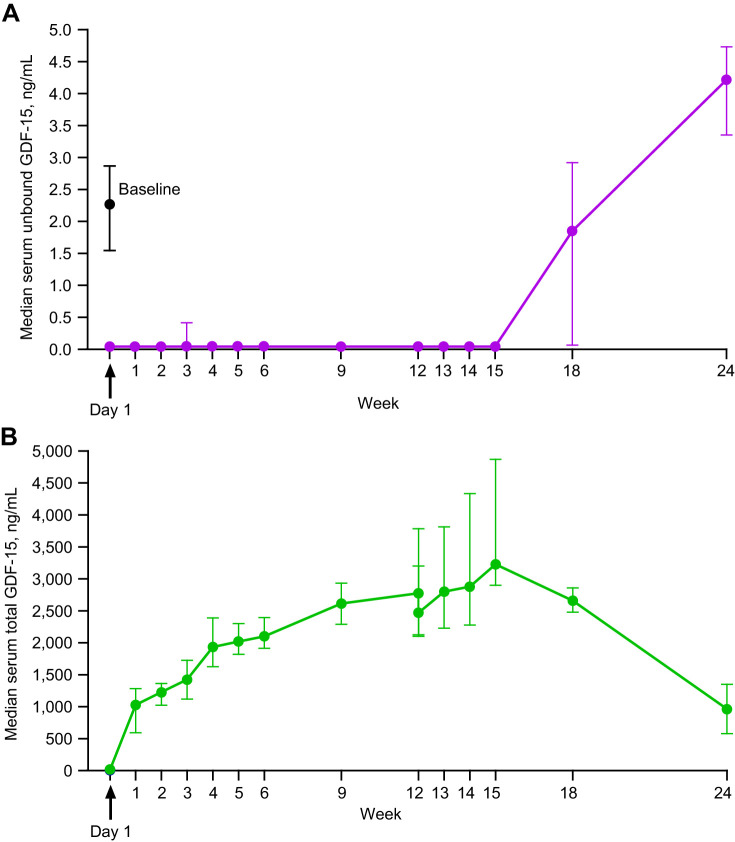
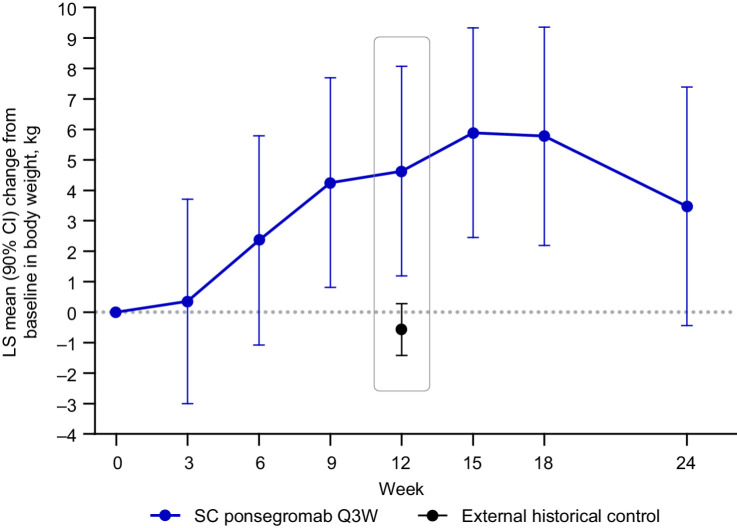
Results: No treatment-related treatment-emergent adverse events, injection site reactions, or adverse trends in clinical laboratory tests, vital signs, or electrocardiogram parameters attributable to ponsegromab were identified. Median serum unbound GDF-15 concentration at baseline was 2.269 ng/mL. Following initiation of study treatment, median unbound GDF-15 concentrations were below the lower limit of quantification (0.0424 ng/mL) from day 1 (3 hours postdose) through week 15. Increases in body weight were observed at all time points during the treatment and follow-up periods. A least-squares mean (SE) increase of 4.63 (1.98) kg was observed at week 12, an increase of approximately 6.6% relative to baseline. Ponsegromab-mediated improvements in actigraphy-based assessments of physical activity and in quality of life, including appetite as assessed by Functional Assessment of Anorexia-Cachexia Therapy total and subscale scores, were also observed.

Conclusions: Ponsegromab was well tolerated, suppressed serum GDF-15 concentrations, and demonstrated preliminary evidence of efficacy. These findings support the continued development of ponsegromab for the treatment of cachexia.


Figures

Figure 1. Median serum unbound (blue) and total (red) ponsegromab concentration–time profiles (semi-log scale). Day 1 values represent median concentration 3 hours after ponsegromab administration. Week 12 values represent median concentrations prior to ponsegromab administration and 3 hours after ponsegromab administration. Error bars represent upper (Q3) and lower (Q1) quartiles. The lower limit of quantification was 20.0 ng/mL for unbound ponsegromab and 100 ng/mL for total ponsegromab. Summary statistics were generated by setting concentration values below the lower limit of quantification to 0 ng/mL. If error bars are not shown, they are either obscured by the symbol for the median value (colored circles) and/or below the lower limit of quantification. The number of participants was as follows: day 1 = 7, weeks 1–14 = 8 (week 12 n was 8 for predose and 6 for postdose), weeks 15–18 = 7, and week 24 = 5.
Figure 1.
Median serum unbound (blue) and total (red) ponsegromab concentration–time profiles (semi-log scale). Day 1 values represent median concentration 3 hours after ponsegromab administration. Week 12 values represent median concentrations prior to ponsegromab administration and 3 hours after ponsegromab administration. Error bars represent upper (Q3) and lower (Q1) quartiles. The lower limit of quantification was 20.0 ng/mL for unbound ponsegromab and 100 ng/mL for total ponsegromab. Summary statistics were generated by setting concentration values below the lower limit of quantification to 0 ng/mL. If error bars are not shown, they are either obscured by the symbol for the median value (colored circles) and/or below the lower limit of quantification. The number of participants was as follows: day 1 = 7, weeks 1–14 = 8 (week 12 n was 8 for predose and 6 for postdose), weeks 15–18 = 7, and week 24 = 5.
Figure 2. Median serum unbound (A) and total GDF-15 concentration–time profiles (B). Error bars represent upper (Q3) and lower (Q1) quartiles. Summary statistics were generated by setting concentration values that were below the lower limit of quantification to 0.0424 ng/mL for unbound GDF-15 and to 0.183 ng/mL for total GDF-15, which represent the lower limit for each of these assays. If error bars are not shown, they are either obscured by the symbol for the median value (colored circles) and/or below the lower limit of quantification. A, the black circle at day 1 represents the median baseline GDF-15 concentration prior to ponsegromab administration, and the purple circle at day 1 represents the median concentration 3 hours after administration. The baseline concentration in B was 4.260 ng/mL, but the black circle is obscured in the figure by the postdose data point (green circle). Likewise, pre- and postdose samples are shown at week 12, but these values were both below the lower limit of quantification in A. The number of participants with unbound measurements was as follows: day 1 = 10, week 1–15 = 8, week 18 = 7, and week 24 = 6. The number of participants with total measurements was as follows: day 1 = 10, week 1–14 = 8, week 15–18 = 7, and week 24 = 6.
Figure 2.
Median serum unbound (A) and total GDF-15 concentration–time profiles (B). Error bars represent upper (Q3) and lower (Q1) quartiles. Summary statistics were generated by setting concentration values that were below the lower limit of quantification to 0.0424 ng/mL for unbound GDF-15 and to 0.183 ng/mL for total GDF-15, which represent the lower limit for each of these assays. If error bars are not shown, they are either obscured by the symbol for the median value (colored circles) and/or below the lower limit of quantification. A, the black circle at day 1 represents the median baseline GDF-15 concentration prior to ponsegromab administration, and the purple circle at day 1 represents the median concentration 3 hours after administration. The baseline concentration in B was 4.260 ng/mL, but the black circle is obscured in the figure by the postdose data point (green circle). Likewise, pre- and postdose samples are shown at week 12, but these values were both below the lower limit of quantification in A. The number of participants with unbound measurements was as follows: day 1 = 10, week 1–15 = 8, week 18 = 7, and week 24 = 6. The number of participants with total measurements was as follows: day 1 = 10, week 1–14 = 8, week 15–18 = 7, and week 24 = 6.
Figure 3. Least squares mean change in body weight. The number of participants for ponsegromab was 9 at week 3, 8 at weeks 6–15, 7 at week 18, and 6 at week 24. The effective number of participants for the external historical control at week 12 was 120. Change in weight was analyzed using an MMRM model (see Methods for details). The external historical control was derived from a meta-analysis of historical data in placebo-treated cancer cachexia populations (see Methods for details). CI, confidence interval; LS, least-squares; MMRM, mixed-model repeated measures; SC, subcutaneous; Q3W, every three weeks.
Figure 3.
Least squares mean change in body weight. The number of participants for ponsegromab was 9 at week 3, 8 at weeks 6–15, 7 at week 18, and 6 at week 24. The effective number of participants for the external historical control at week 12 was 120. Change in weight was analyzed using an MMRM model (see Methods for details). The external historical control was derived from a meta-analysis of historical data in placebo-treated cancer cachexia populations (see Methods for details). CI, confidence interval; LS, least-squares; MMRM, mixed-model repeated measures; SC, subcutaneous; Q3W, every three weeks.

References

    1. Ahmad SS, Ahmad K, Shaikh S, You HJ, Lee EY, Ali S, et al. . Molecular mechanisms and current treatment options for cancer cachexia. Cancers 2022;14:2107. - PMC - PubMed
    1. Balsano R, Kruize Z, Lunardi M, Comandatore A, Barone M, Cavazzoni A, et al. . Transforming growth factor-beta signaling in cancer-induced cachexia: from molecular pathways to the clinics. Cells 2022;11:2671. - PMC - PubMed
    1. Welsh JB, Sapinoso LM, Kern SG, Brown DA, Liu T, Bauskin AR, et al. . Large-scale delineation of secreted protein biomarkers overexpressed in cancer tissue and serum. Proc Natl Acad Sci USA 2003;100:3410–5. - PMC - PubMed
    1. Uhlen M, Zhang C, Lee S, Sjöstedt E, Fagerberg L, Bidkhori G, et al. . A pathology atlas of the human cancer transcriptome. Science 2017;357. - PubMed
    1. Breit SN, Brown DA, Tsai VW-W. The GDF15-GFRAL pathway in health and metabolic disease: friend or foe? Annu Rev Physiol 2021;83:127–51. - PubMed

Publication types

Substances

Grants and funding