. 2023 Nov 20:11:e47833.
doi: 10.2196/47833.

Machine Learning Models for Blood Glucose Level Prediction in Patients With Diabetes Mellitus: Systematic Review and Network Meta-Analysis

Affiliations

Machine Learning Models for Blood Glucose Level Prediction in Patients With Diabetes Mellitus: Systematic Review and Network Meta-Analysis

Kui Liu et al. JMIR Med Inform. .

Abstract

Background: Machine learning (ML) models provide more choices to patients with diabetes mellitus (DM) to more properly manage blood glucose (BG) levels. However, because of numerous types of ML algorithms, choosing an appropriate model is vitally important.

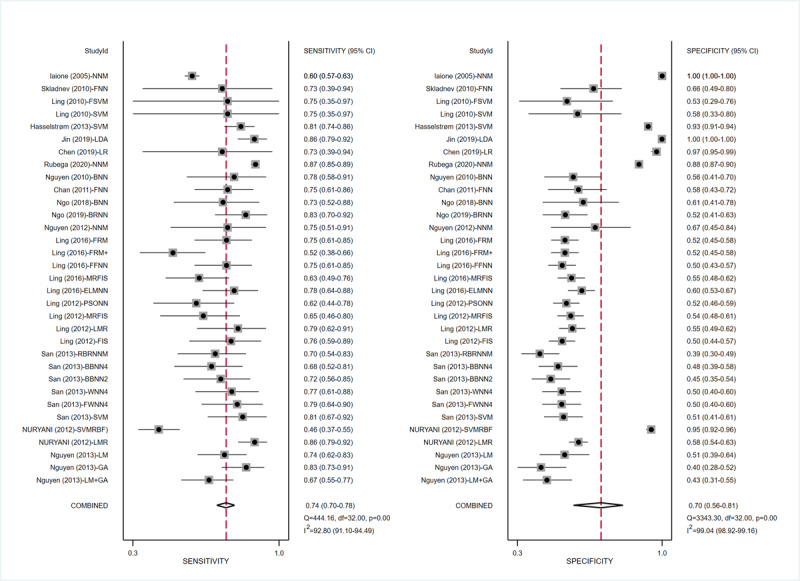
Objective: In a systematic review and network meta-analysis, this study aimed to comprehensively assess the performance of ML models in predicting BG levels. In addition, we assessed ML models used to detect and predict adverse BG (hypoglycemia) events by calculating pooled estimates of sensitivity and specificity.

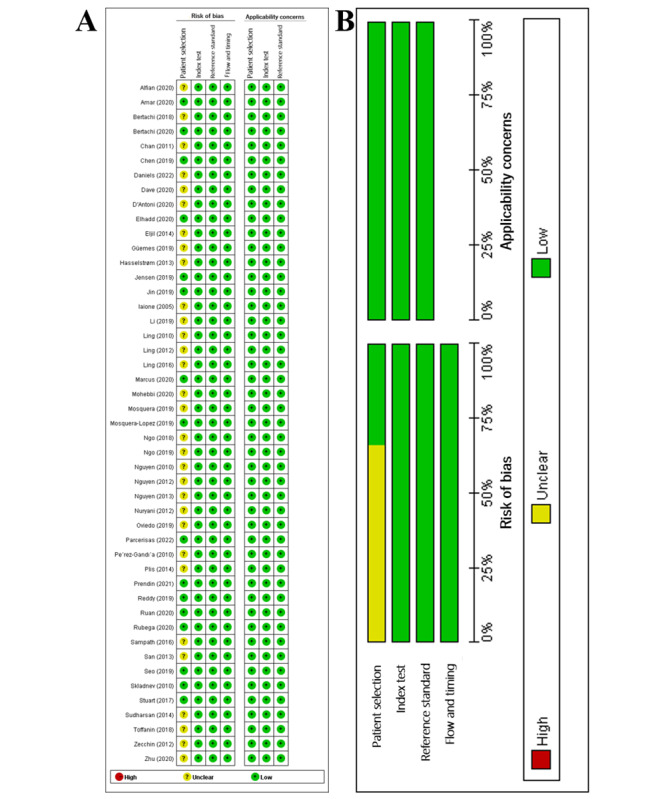
Methods: PubMed, Embase, Web of Science, and Institute of Electrical and Electronics Engineers Explore databases were systematically searched for studies on predicting BG levels and predicting or detecting adverse BG events using ML models, from inception to November 2022. Studies that assessed the performance of different ML models in predicting or detecting BG levels or adverse BG events of patients with DM were included. Studies with no derivation or performance metrics of ML models were excluded. The Quality Assessment of Diagnostic Accuracy Studies tool was applied to assess the quality of included studies. Primary outcomes were the relative ranking of ML models for predicting BG levels in different prediction horizons (PHs) and pooled estimates of the sensitivity and specificity of ML models in detecting or predicting adverse BG events.

Results: In total, 46 eligible studies were included for meta-analysis. Regarding ML models for predicting BG levels, the means of the absolute root mean square error (RMSE) in a PH of 15, 30, 45, and 60 minutes were 18.88 (SD 19.71), 21.40 (SD 12.56), 21.27 (SD 5.17), and 30.01 (SD 7.23) mg/dL, respectively. The neural network model (NNM) showed the highest relative performance in different PHs. Furthermore, the pooled estimates of the positive likelihood ratio and the negative likelihood ratio of ML models were 8.3 (95% CI 5.7-12.0) and 0.31 (95% CI 0.22-0.44), respectively, for predicting hypoglycemia and 2.4 (95% CI 1.6-3.7) and 0.37 (95% CI 0.29-0.46), respectively, for detecting hypoglycemia.

Conclusions: Statistically significant high heterogeneity was detected in all subgroups, with different sources of heterogeneity. For predicting precise BG levels, the RMSE increases with a rise in the PH, and the NNM shows the highest relative performance among all the ML models. Meanwhile, current ML models have sufficient ability to predict adverse BG events, while their ability to detect adverse BG events needs to be enhanced.

Trial registration: PROSPERO CRD42022375250; https://www.crd.york.ac.uk/prospero/display_record.php?RecordID=375250.

Keywords: blood glucose; blood glucose management; diabetes; hypoglycemia; machine learning.


Conflict of interest statement

Conflicts of Interest: None declared.

Figures

Figure 1
Figure 1
Flow diagram of identifying and including studies. IEEE: Institute of Electrical and Electronics Engineers.
Figure 2
Figure 2
Quality assessment of included studies. Risk of bias and applicability concerns graph (A) and risk of bias and applicability concerns summary (B).
Figure 3
Figure 3
Network map of ML models for predicting BG levels in different PHs. PH=30 (A), 60 (B), 15 (C), and 45 minutes (D). ARIMA: autoregressive integrated moving average; ARM: autoregression model; ARMA: autoregressive moving average; ARJNN: ARTiDe jump neural network; BG: blood glucose; CRNN-MTL: convolutional recurrent neural network multitask learning; CRNN-MTL-GV: convolutional recurrent neural network multitask learning glycemic variability; CRNN-STL: convolutional recurrent neural network single-task learning; CRNN-TL: convolutional recurrent neural network transfer learning; DFFNN: delayed feed-forward neural network; DRNN: dilated recurrent neural network; DT: decision tree; FC: fully connected (neural network); fNN: feed-forward neural network; GCN: gradually connected neural network; JNN: jump neural network; kNN: k-nearest neighbor; LGBM: light gradient boosting machine; LSTM: long short-term memory; LVX: latent variable with exogenous input; ML: machine learning; NARX: one neural network model; NN-LPA: neural network–linear prediction algorithm; NNM: neural network model; PH: prediction horizon; RF: random forest; RNN: recurrent neural network; SAX: one symbolic model; SVR: support vector regression.
Figure 4
Figure 4
SUCRA curves of ML models for predicting BG levels in different PHs. PH=30 (A), 60 (B), 15 (C), and 45 minutes (D). ARIMA: autoregressive integrated moving-average; ARM: autoregression model; ARMA: autoregressive moving average; ARJNN: ARTiDe jump neural network; BG: blood glucose; CRNN-MTL: convolutional recurrent neural networks multitask learning; CRNN-MTL-GV: convolutional recurrent neural networks multitask learning glycemic variability; CRNN-STL: convolutional recurrent neural networks single-task learning; CRNN-TL: convolutional recurrent neural networks transfer learning; DFFNN: delayed feed-forward neural network; DRNN: dilated recurrent neural network; DT: decision tree; FC: fully connected (neural network); fNN: feed-forward neural network; GCN: gradually connected neural network; JNN: jump neural network; kNN: k-nearest neighbor; LGBM: light gradient boosting machine; LSTM: long short-term memory; LVX: latent variable with exogenous input; ML: machine learning; NARX: one neural network model; NN-LPA: neural network–linear prediction algorithm; NNM: neural network model; PH: prediction horizon; RF: random forest; RNN: recurrent neural network; SAX: one symbolic model; SVR: support vector regression.
Figure 5
Figure 5
Sensitivity and specificity forest plots of ML models for predicting adverse BG events. The horizontal lines indicate 95% CIs. The square markers represent the effect value of a single study, and the diamond marker represents the combined results of all studies. The vertical line shows the line of no effects. BG: blood glucose; ML: machine learning.
Figure 6
Figure 6
SROC curves of all ML algorithms (A), NNM algorithms (B), RF algorithms (C), SVM algorithms (D), and ensemble learning algorithms (E) for predicting adverse BG events. The hollow circles represent results of all studies, and the red diamonds represent the summary result of all studies. AUC: area under the curve; BG: blood glucose; ML: machine learning; NNM: neural network model; RF: random forest; SROC: summary receiver operating characteristic; SVM: support vector machine.
Figure 7
Figure 7
Sensitivity and specificity forest plots of NNM algorithms (A), RF models (B), SVM algorithms (C), and ensemble learning algorithms (D) for predicting adverse BG events. The horizontal lines indicate 95% CIs. The square markers represent the effect value of a single study, and the diamond marker represents the combined results of all studies. The vertical line shows the line of no effects. BG: blood glucose; NNM: neural network model; RF: random forest; SROC: summary receiver operating characteristic; SVM: support vector machine.
Figure 8
Figure 8
Sensitivity and specificity forest plots of ML models for detecting adverse BG events. The horizontal lines indicate 95% CIs. The square markers represent the effect value of a single study, and the diamond marker represents the combined results of all studies. The vertical line shows the line of no effects. BG: blood glucose; ML: machine learning.
Figure 9
Figure 9
SROC curves of all ML algorithms (A), NNM algorithms (B), and SVM algorithms (C) for detecting adverse BG events. The hollow circles represent results of all studies, and the red diamonds represent the summary result of all studies. AUC: area under the curve; BG: blood glucose; ML: machine learning; NNM: neural network model; SROC: summary receiver operating characteristic; SVM: support vector machine.
Figure 10
Figure 10
Sensitivity and specificity forest plots of NNM algorithms (A) and SVM algorithms (B) for detecting adverse BG events. The horizontal lines indicate 95% CIs. The square markers represent the effect value of a single study, and the diamond marker represents the combined results of all studies. The vertical line shows the line of no effects. BG: blood glucose; NNM: neural network model; SVM: support vector machine.

References

    1. Oviedo S, Vehí J, Calm R, Armengol J. A review of personalized blood glucose prediction strategies for T1DM patients. Int J Numer Method Biomed Eng. 2017 Jun;33(6):e2833. doi: 10.1002/cnm.2833. - DOI - PubMed
    1. Saeedi P, Petersohn I, Salpea P, Malanda B, Karuranga S, Unwin N, Colagiuri S, Guariguata L, Motala AA, Ogurtsova K, Shaw JE, Bright D, Williams R, IDF Diabetes Atlas Committee Global and regional diabetes prevalence estimates for 2019 and projections for 2030 and 2045: results from the International Diabetes Federation Diabetes Atlas, 9 edition. Diabetes Res Clin Pract. 2019 Nov;157:107843. doi: 10.1016/j.diabres.2019.107843.S0168-8227(19)31230-6 - DOI - PubMed
    1. BMC Medicine Diabetes education for better personalized management in pediatric patients. BMC Med. 2023 Jan 24;21(1):30. doi: 10.1186/s12916-022-02709-2. https://bmcmedicine.biomedcentral.com/articles/10.1186/s12916-022-02709-2 10.1186/s12916-022-02709-2 - DOI - DOI - PMC - PubMed
    1. Chen D, Wang M, Shang X, Liu X, Liu X, Ge T, Ren Q, Ren X, Song X, Xu H, Sun M, Zhou H, Chang B. Development and validation of an incidence risk prediction model for early foot ulcer in diabetes based on a high evidence systematic review and meta-analysis. Diabetes Res Clin Pract. 2021 Oct;180:109040. doi: 10.1016/j.diabres.2021.109040.S0168-8227(21)00399-5 - DOI - PubMed
    1. Li Y, Su X, Ye Q, Guo X, Xu B, Guan T, Chen A. The predictive value of diabetic retinopathy on subsequent diabetic nephropathy in patients with type 2 diabetes: a systematic review and meta-analysis of prospective studies. Ren Fail. 2021 Dec;43(1):231–240. doi: 10.1080/0886022X.2020.1866010. https://europepmc.org/abstract/MED/33478336 - DOI - PMC - PubMed

LinkOut - more resources