. 2023 Nov 20;18(11):e0294438.
doi: 10.1371/journal.pone.0294438. eCollection 2023.

Differential vascular endothelial cell toxicity of established and novel BCR-ABL tyrosine kinase inhibitors

Affiliations

Differential vascular endothelial cell toxicity of established and novel BCR-ABL tyrosine kinase inhibitors

Yihua Wang et al. PLoS One. .

Abstract

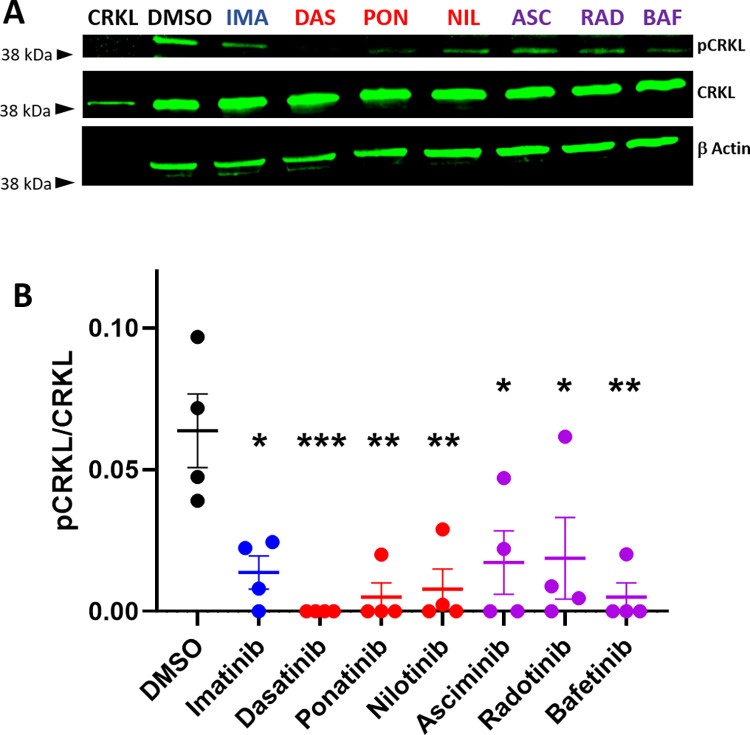
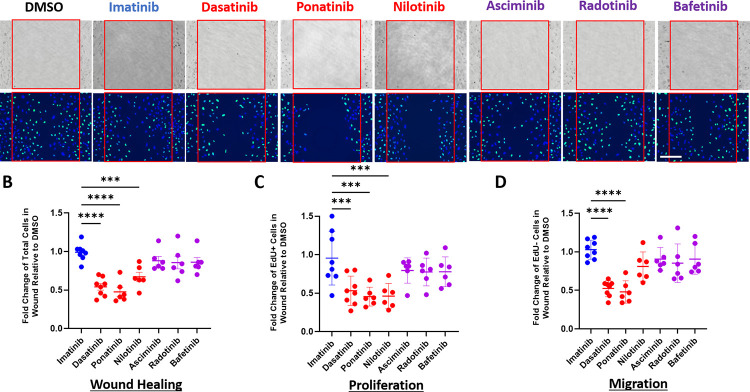
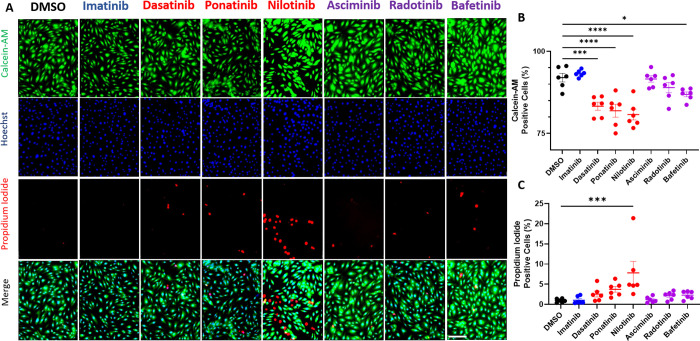
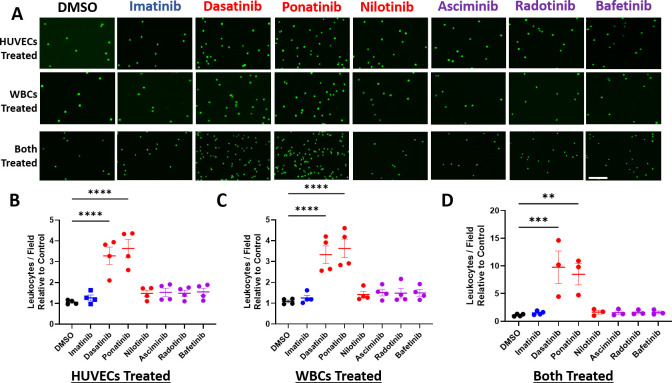
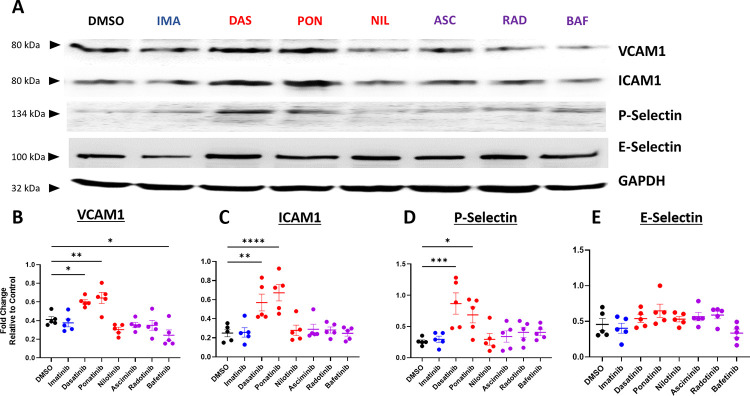
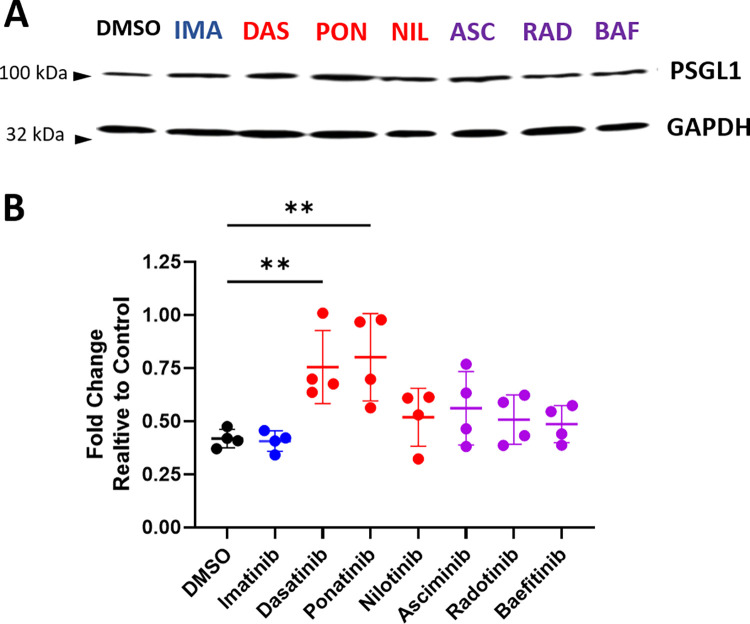
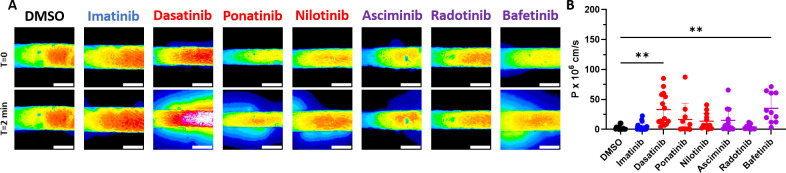
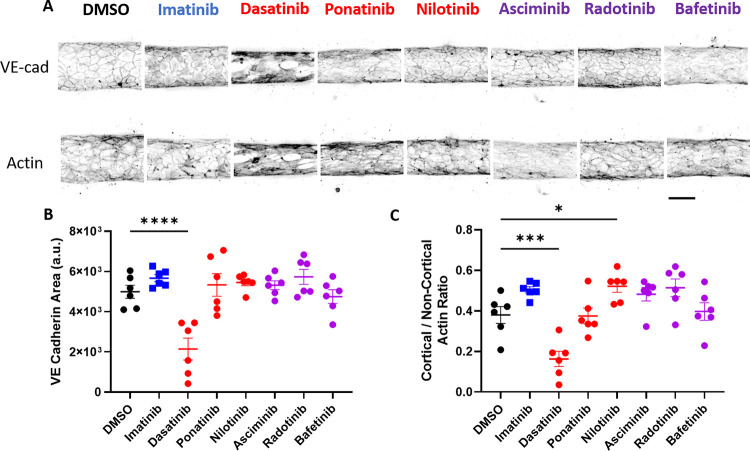
BCR-ABL tyrosine kinase inhibitors (TKIs) have dramatically improved survival in Philadelphia chromosome-positive leukemias. Newer BCR-ABL TKIs provide superior cancer outcomes but with increased risk of acute arterial thrombosis, which further increases in patients with cardiovascular comorbidities and mitigates survival benefits compared to imatinib. Recent studies implicate endothelial cell (EC) damage in this toxicity by unknown mechanisms with few side-by-side comparisons of multiple TKIs and with no available data on endothelial impact of recently approved TKIs or novels TKIs being tested in clinical trials. To characterize BCR-ABL TKI induced EC dysfunction we exposed primary human umbilical vein ECs in 2D and 3D culture to clinically relevant concentrations of seven BCR-ABL TKIs and quantified their impact on EC scratch-wound healing, viability, inflammation, and permeability mechanisms. Dasatinib, ponatinib, and nilotinib, the TKIs associated with thrombosis in patients, all significantly impaired EC wound healing, survival, and proliferation compared to imatinib, but only dasatinib and ponatinib impaired cell migration and only nilotinib enhanced EC necrosis. Dasatinib and ponatinib increased leukocyte adhesion to ECs with upregulation of adhesion molecule expression in ECs (ICAM1, VCAM1, and P-selectin) and leukocytes (PSGL1). Dasatinib increased permeability and impaired cell junctional integrity in human engineered microvessels, consistent with its unique association with pleural effusions. Of the new agents, bafetinib decreased EC viability and increased microvessel permeability while asciminib and radotinib did not impact any EC function tested. In summary, the vasculotoxic TKIs (dasatinib, ponatinib, nilotinib) cause EC toxicity but with mechanistic differences, supporting the potential need for drug-specific vasculoprotective strategies. Asciminib and radotinib do not induce EC toxicity at clinically relevant concentrations suggesting a better safety profile.


Conflict of interest statement

The authors have declared that no competing interests exist.

Figures

Fig 1
Fig 1. BCR-ABL TKIs inhibit ABL kinase activity in human endothelial cells (EC).
Human umbilical vein ECs were treated with the indicated BCR-ABL TKI or DMSO control at the Cmax concentration for 2 hours. A. Representative images of western blots for the ABL kinase target p-Y207 CRKL (top), total CRKL (middle) and β-actin loading control (bottom). B. Quantification of the ratio of p-CRKL to total CRKL. N = 4 independent experiments. One way ANOVA with Tukey’s multiple comparison test. *p<0.05, **p<0.01, ***p<0.001.
Fig 2
Fig 2. Vasculotoxic BCR-ABL TKIs, but not the novel TKIs, impair human endothelial cell wound healing.
A scratch wound was made in a HUVEC monolayer and then cells were treated with the indicated BCR-ABL TKI or DMSO along with EdU. A. Representative light microscope images immediately after generating the scratch (top row) and fluorescent microscope images (bottom row) at 18 hours after the wound with staining for nuclei (blue) or Edu-incorporated nuclei (green). Red square highlights the wounded area. Scale Bar = 200 μM. B. Quantification of wound healing (total cells in the scratch relative to DMSO). C. Quantification of proliferation (EdU positive cells in the scratch relative to DMSO). D. Quantification of migration (EdU negative cells in the scratch relative to DMSO). B-D. Data are presented as mean ± SEM, with n = 6–8 independent experiments per treatment. One way ANOVA with Dunnett’s multiple comparisons test with comparison of each mean to imatinib. **p<0.01, ***p<0.001, ****p<0.0001.
Fig 3
Fig 3. Dasatinib, ponatinib, nilotinib, and bafetinib, but not asciminib or radotinib, decrease endothelial cell viability.
A. Representative images of HUVECs treated with each indicated TKI for 24 hours and stained for with calcenin-AM (viable cells), hoescht (all cells), and propidium iodide (necrotic cells). Scale Bar = 200 μM. B. Quantification of percent viable (calcein-AM positive/ hoescht positive) cells after treatment with each TKI or DMSO control as indicated. C. Quantification of percent necrotic (propidium iodide positive/ hoescht positive) cells after treatment with TKI or DMSO control as indicated. Data are presented as mean ± SEM, with N = 6 independent experiments per treatment. Data were analyzed with one-way ANOVA with Dunnett’s post-hoc test with comparisons of each condition to DMSO. **p<0.01, ***p<0.001, ****p<0.0001.
Fig 4
Fig 4. Dasatinib and ponatinib act on HUVECs and leukocytes to enhance leukocyte-endothelial cell adhesion.
A. Representative images of U937 cells adherent to HUVECs after pre-treatment of HUVECs alone (top row), U937 cells alone (middle row), or pre-treatment of both cell types (bottom row). Scale Bar = 200 μM. B. Quantification of the number of adherent U937 cells relative to DMSO control after HUVEC pre-treatment with TKI. C. Quantification of adherent U937 cell relative to DMSO control after U937 leukocytes were pre-treated with TKI. D. Quantification of adherent U937 cells relative to DMSO control after both U937 cells and HUVECs were pre-treated with each TKI. Data are presented as mean ± SEM, with N = 3–4 independent experiments per treatment. Statistical analysis by one way ANOVA with Dunnett’s multiple comparisons test with comparison of each mean to DMSO. **p<0.01, ***p<0.001, ****p<0.0001.
Fig 5
Fig 5. Dasatinib and ponatinib induce expression of leukocyte adhesion molecules on HUVECs.
A. Representative western blots for VCAM1, ICAM1, P-Selectin, and E-Selectin of HUVECs treated for 24 hours with the indicated TKIs. B-E. Quantification of VCAM1 (B), ICAM1 (C), P-Selectin (D), and E-Selectin (E) relative to GAPDH after treatment with TKI or DMSO control. Data are presented as mean ± SEM, with N = 5 independent experiments per treatment. Statistical analysis by one way ANOVA with Dunnett’s multiple comparisons test with comparison of each mean to DMSO. *p<0.05, **p<0.01, ***p<0.001.
Fig 6
Fig 6. Dasatinib and ponatinib induce expression of the P-selectin glycoprotein ligand-1 on leukocytes.
A. Representative western blot of U937 cells treated for 24 hours with the indicated TKIs. B. Quantification of PSGL1 relative to GAPDH loading control for cells treated with indicated TKI versus DMSO control. Data presented as mean ± SEM, with N = 4 independent experiments per treatment. Statistical analysis by one way ANOVA with Dunnett’s multiple comparisons test with comparison of each mean to DMSO. ** p < 0.01.
Fig 7
Fig 7. Dasatinib and bafetinib increase the permeability of human engineered microvessels.
A. Representative images from T = 0 (top row) and T = 2 minutes (bottom row) of hEMVs treated with the indicated BCR-ABL TKI or vehicle control. B. Quantification of vessel permeability of hEMVs treated with each TKI or DMSO control. Data presented as mean ± SEM, with n = 9–19 independent experiments per treatment. Statistical analysis by Brown-Forsythe ANOVA with Dunnett’s T3 multiple comparisons test with comparison of each mean to DMSO. ** p < 0.01. Scale bar = 150 μM.
Fig 8
Fig 8. Dasatinib induces changes to the actin cytoskeleton and cell-cell junctions in human engineered microvessels (hEMVs).
A. Representative images of hEMVs stained for VE-Cadherin (top row) or Actin (bottom row) after treatment with indicated BCR-ABL TKI or vehicle control for 3 hours. Scale bar = 150 μM. B. Quantification of VE-Cadherin staining for hEMVs treated with each TKI or DMSO control. C. Quantification of the ratio of junctional to cytoplasmic actin. Statistical analysis by one way ANOVA with Dunnett’s multiple comparisons test with comparison of each mean to DMSO. *, p <0.05, *** p < 0.001 **** p < 0.0001.

Similar articles

Cited by

References

    1. Kurzrock R, Gutterman JU, Talpaz M. The molecular genetics of Philadelphia chromosome-positive leukemias. N Engl J Med. 1988;319(15):990–8. doi: 10.1056/NEJM198810133191506 - DOI - PubMed
    1. SEER CML Facts [Internet].
    1. Bower H, Bjorkholm M, Dickman PW, Hoglund M, Lambert PC, Andersson TM. Life Expectancy of Patients With Chronic Myeloid Leukemia Approaches the Life Expectancy of the General Population. J Clin Oncol. 2016;34(24):2851–7. doi: 10.1200/JCO.2015.66.2866 - DOI - PubMed
    1. Huang X, Cortes J, Kantarjian H. Estimations of the increasing prevalence and plateau prevalence of chronic myeloid leukemia in the era of tyrosine kinase inhibitor therapy. Cancer. 2012;118(12):3123–7. doi: 10.1002/cncr.26679 - DOI - PMC - PubMed
    1. Braun TP, Eide CA, Druker BJ. Response and Resistance to BCR-ABL1-Targeted Therapies. Cancer Cell. 2020;37(4):530–42. doi: 10.1016/j.ccell.2020.03.006 - DOI - PMC - PubMed

MeSH terms

Substances