Review
. 2023 Dec;17(1):2281714.
doi: 10.1080/19336950.2023.2281714. Epub 2023 Nov 20.

Voltage gated sodium and calcium channels: Discovery, structure, function, and Pharmacology

Affiliations
Review

Voltage gated sodium and calcium channels: Discovery, structure, function, and Pharmacology

William A Catterall. Channels (Austin). 2023 Dec.

Abstract

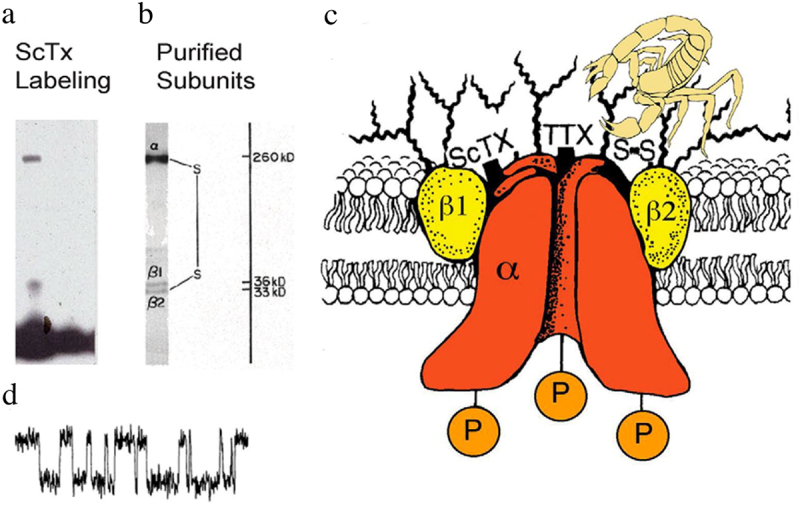
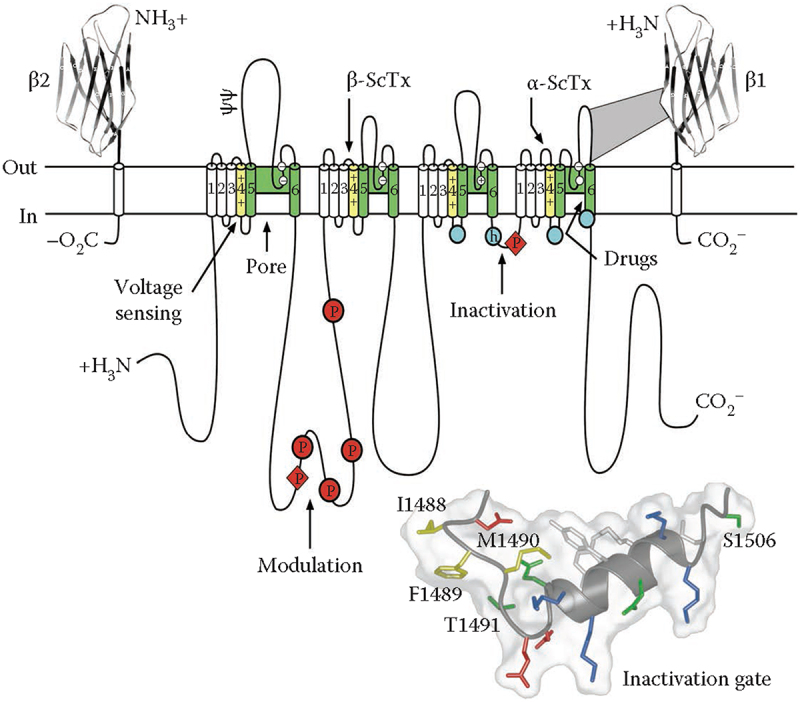
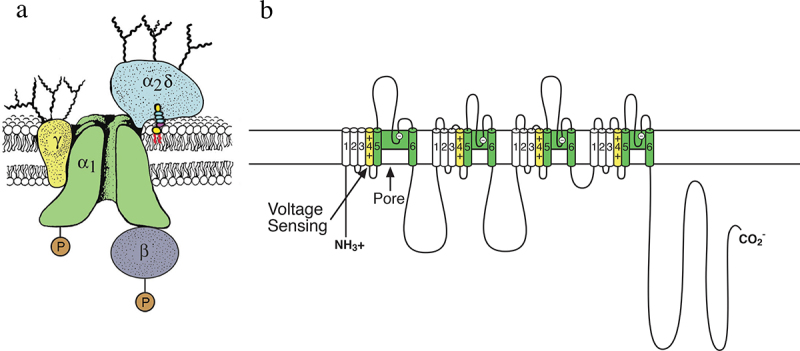
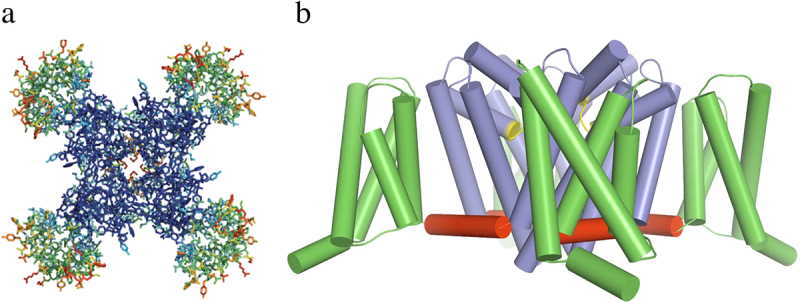
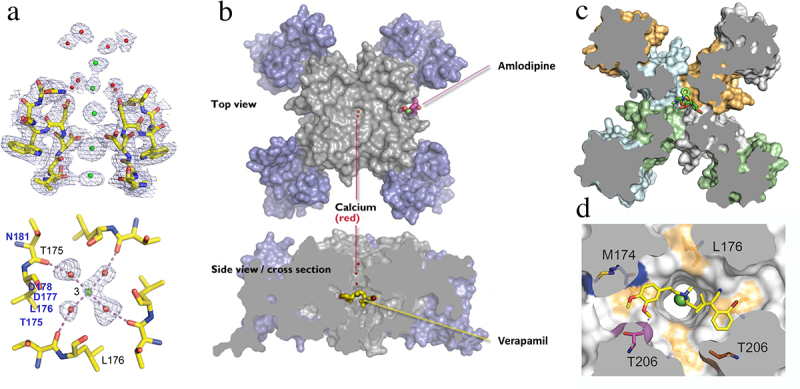
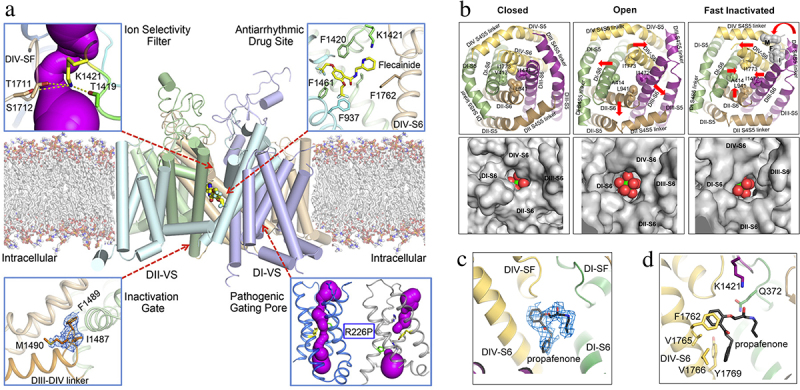
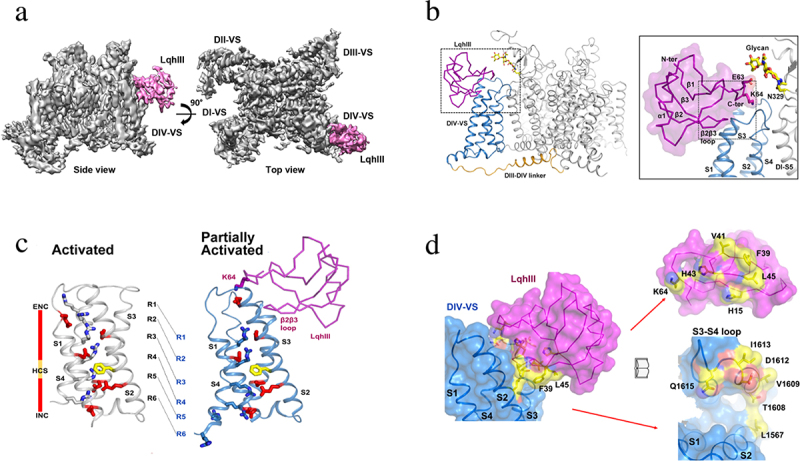
Voltage-gated sodium channels initiate action potentials in nerve and muscle, and voltage-gated calcium channels couple depolarization of the plasma membrane to intracellular events such as secretion, contraction, synaptic transmission, and gene expression. In this Review and Perspective article, I summarize early work that led to identification, purification, functional reconstitution, and determination of the amino acid sequence of the protein subunits of sodium and calcium channels and showed that their pore-forming subunits are closely related. Decades of study by antibody mapping, site-directed mutagenesis, and electrophysiological recording led to detailed two-dimensional structure-function maps of the amino acid residues involved in voltage-dependent activation and inactivation, ion permeation and selectivity, and pharmacological modulation. Most recently, high-resolution three-dimensional structure determination by X-ray crystallography and cryogenic electron microscopy has revealed the structural basis for sodium and calcium channel function and pharmacological modulation at the atomic level. These studies now define the chemical basis for electrical signaling and provide templates for future development of new therapeutic agents for a range of neurological and cardiovascular diseases.

Keywords: X-ray crystallography; calcium channel; cryogenic electron microscopy; protein structure; sodium channel.


Conflict of interest statement

No potential conflict of interest was reported by the author(s).

Figures

Figure 1.
Figure 1.
Subunit structure of voltage-gated sodium channels. a) SDS polyacrylamide gel electrophoresis illustrating the α and β subunits of rat brain sodium channels covalently labeled with125I-labeled leiurus quinquestriatus scorpion toxin (ScTx) and imaged by autoradiography. Adapted from Beneski and Catterall, 1980 [16]. b) SDS polyacrylamide gel electrophoresis patterns illustrating the α and β subunits of the brain Na+ channels. Sodium channel purified from rat brain showing the α, β1, and β2 subunits and their molecular weights. Adapted from Hartshorne et al., 1982 [19]. As illustrated, the α and β2 subunits are linked by a disulfide bond. Tetrodotoxin (TTX) and scorpion toxins (ScTx) bind to the α subunits of Na+ channels as indicated and were used as molecular tags to identify and purify the sodium channel protein from brain. c) drawing of the subunit structure of the brain Na+ channel based on biochemical data. Ψ, sites of N-linked glycosylation. Adapted from Catterall, 1984 [27]. d) single channel currents conducted by a single purified Na+ channel incorporated into a planar bilayer [23].
Figure 2.
Figure 2.
The primary structures of the subunits of the voltage-gated sodium channels. Cylinders represent alpha helical segments. Bold lines represent the polypeptide chains of each subunit with length approximately proportional to the number of amino acid residues in the brain sodium channel subtypes. The extracellular domains of the β1 and β2 subunits are shown as immunoglobulin-like folds. Ψ, sites of N-linked glycosylation; P in red circles, sites of demonstrated protein phosphorylation by PKA (circles) and PKC (diamonds); green, pore-lining segments; white circles, the outer and inner (DEKA) rings of amino residues that form the ion selectivity filter and the tetrodotoxin binding site; yellow, S4 voltage sensors; h in blue circle, inactivation particle in the inactivation gate loop; blue circles, sites implicated in forming the inactivation gate receptor. Sites of binding of α- and β-scorpion toxins and a site of interaction between α and β1 subunits are also shown. Tetrodotoxin is a specific blocker of the pore of Na+ channels, whereas the α- and β-scorpion toxins block fast inactivation and enhance activation, respectively, and thereby generate persistent Na+ current that causes hyperexcitability and depolarization block of nerve conduction. Adapted from Catterall, 2000 [34]. Inset. Structure of the fast inactivation gate in solution determined by NMR. Adapted from Rohl et al. [86].
Figure 3.
Figure 3.
The subunit structure of calcium channels purified from skeletal muscle. a) a biochemical model of the skeletal muscle calcium channel taken from the original description of the subunit structure of skeletal muscle Ca2+ channels but with the mature α2δ subunit depicted following proteolytic processing, disulfide bond formation and attachment of a glycosylphosphatidylinositol membrane anchor. Adapted from Takahashi et al., 1987 [48]. P, sites of phosphorylation by cAMP-dependent protein kinase and protein kinase C. Ψ, sites of N-linked glycosylation. b) transmembrane folding models of the CaV1.1 subunits. Predicted alpha helices are depicted as cylinders. The lengths of lines correspond approximately to the lengths of the polypeptide segments represented. Adapted from Catterall, 1991 [49].
Figure 4.
Figure 4.
Structure of the bacterial sodium channel NaVAb. a) top view of NaVAb channels colored according to crystallographic temperature factors of the main-chain (blue <50 Å2 to red > 150 Å2). The four pore modules in the center are rigid in the crystal structure and therefore are blue. The four voltage-sensing modules surround the pore and are more mobile, as illustrated by warmer colors. b) side view of NaVAb. Voltage sensing module (S1-S4), green; pore module (S5, S6, and P loop), blue; selectivity filter, yellow; S4-S5 linker, red. Adapted from Payandeh et al.,2011 [97].
Figure 5.
Figure 5.
Architecture of the NaVAb voltage sensing module and pore module. a) side view of the voltage-sensing module of NaVAb illustrating the conformations of the S1-S4 helices and the size of the extracellular aqueous cleft with the R1-R4 gating charges (blue), extracellular negative cluster (ENC, red), intracellular negative cluster (INC, red), and hydrophobic constriction site (HCS, green). b) side view of the pore-forming module of two subunits of NaVAb. S5 and S6 transmembrane helices, purple: P helix loop, green; P2 helix green; water-filled space revealed by MOLE, gray. Note that the two S6 segments are crossed at their intracellular ends, forming the closed conformation of the activation gate. Adapted from Payandeh et al., 2011 [97].
Figure 6.
Figure 6.
Sodium channel activation and pore gating mechanism of NaVAb. a) gating charge movement. Four Arg gating charges, R1–R4 (blue); the extracellular negative charge (ENC) cluster of E32 and N49(K) and the intracellular negative charge (INC) cluster of E59 and E80 (red); Phe in the hydrophobic constriction site (HCS) (green); and conserved W76 (gray) and E96 (yellow) are shown as sticks. S4 (magenta) moves outward by 11.5 Å, passing two gating charges through the HCS. Part of S3 is omitted for clarity. b) sideview of the structures focusing on S4 (magenta) and the S4-S5 linker (blue), with the S0–S3 segments shown in gray and the pore module in yellow. The S4 segment moves outward across the membrane from the resting to the activated states, whereas the S1–S3 segments remain relatively unchanged with respect to the membrane. The S4-S5 linker acts as an elbow that connects the S4 movement to modulate the pore. c) bottom (intracellular) view of the structures in (b), with S0–S4 omitted for clarity. The S4-S5 linker (blue) undergoes a large conformational change that tightens the collar around the S5 (yellow) and S6 segments (red or green) of the PM in the resting state and loosens the collar in the activated state. d) space-filling model of the structures in (c) at high magnification. Adapted from Wisedchaisri et al., 2019 [98].
Figure 7.
Figure 7.
Mechanism of sodium conductance and selectivity. a) top view of the ion selectivity filter illustrating the high field strength site formed by four E177 residues. Hydrogen bonds between T175 and W179 are indicated by gray dashes. b) side view of the ion selectivity filter. E177 (purple) interactions with Q172, S178 and the backbone of S180 are shown for one subunit; putative cations or water molecules (red spheres). Electron-density around L176 (gray) and a bound water molecule are shown in gray mesh. Na+-coordination sites: SiteHFS, SiteCEN and SiteIN. Adapted from (Payandeh et al. 2011) [97]. c) E177 dunking. Movement of Na+ through the ion selectivity filter catalyzed by inward movement (dunking) of the side chains of E177 via a single torsion angle bend. Adapted from Chakrabarti et al., 2013 [99].
Figure 8.
Figure 8.
Slow inactivation and drug block of Na+ channels. a) top view of the collapse of the pore during slow inactivation of NaVAb. Two S6 segments move inward the central axis of the pore and two move outward to produce an asymmetric, partially collapsed conformation. The selectivity filter structure has changed from nearly square in the pre-open state of NaVAb/I217C to a partially collapsed parallelogram in the inactivated state of NaVAb/WT-CD. b) the central cavity is partially collapsed. c) the activation gate is tightly closed, but collapsed into a two-fold symmetric conformation. Adapted from Payandeh et al, 2012 [102]. d) structure of NaVAb with the selectivity filter (SF), central cavity (CC), and activation gate (AG) highlighted. e) lidocaine bound in the central cavity at the base of the selectivity filter. f) flecainide bound at the local anesthetic/antiarrhythmic receptor site in the central cavity at the base of the selectivity Filter.
Figure 9.
Figure 9.
Calcium and drugs binding to the pore module of CaVAb. a) side view of the ion selectivity filter of CaVAb from X-ray crystallography. a) the ion selectivity filter of CaVAb at high resolution. Green balls, calcium ions; red balls, water; mesh, electron density. Top. side view; bottom, bottom view illustrating a single calcium ion with a square array of four waters of hydration bound. Adapted from Tang et al., 2014 [113]. b) structure of CaVAb in top and side views by X-ray crystallography. Blue, voltage sensor; gray, pore module. Bound amlodipine and verapamil, yellow sticks. c) top view of a cross-section of CaVAb with diltiazem bound in its receptor site as indicated (green sticks). Adapted from Tang et al., 2018 [138]. d) bottom X-ray crystallographic view of a cross-section in high resolution with verapamil (yellow sticks) bound in its receptor site and a calcium ion (green) bound in the pore. Adapted from Tang et al., 2014 [113].
Figure 10.
Figure 10.
The cardiac sodium channel NaV1.5 at high resolution. a) graphical abstract. Center. NaV1.5 structure. Upper left, sodium permeation pathway in the pore module, purple. Upper right, bound flecainide. Lower right, arrhythmia mutation R227P in the voltage sensor. The pathogenic gating pore caused by this mutation creates a complete water-filled pathway through the voltage sensor, as revealed with the program MOLE (purple). Lower left. IFM motif of the fast inactivation gate. b) bottom view of the structure of the activation gate formed by the inner ends of the alpha-helical S6 segments. Top row, backbone structure in closed, open, and fast inactivated states. Bottom row. A sodium ion (yellow) with waters of hydration (red). Adapted from Jiang et al., 2020 [147]. c) propafenone binding site in side view. d) propafenone binding site in top view.
Figure 11.
Figure 11.
Receptor site for the deathstalker scorpion toxin LqhIII on NaV1.5. a) spacefilling side view and top view of NaV1.5 (gray) with LqhIII bound (purple). b) close-up view of bound LqhIII (purple) to its receptor site on the NaV1.5 backbone structure. Inset. higher resolution image of the interface between LqhIII and NaV1.5. c) superposition of the voltage sensor in the unmodified activated state and the toxin-modified partially activated state. d) mutational map of the interface residues in the LqhIII receptor site illustrated with “open book” format. LqhIII, purple; NaV1.5, blue. Amino acid residues highlighted in yellow and orange are required for high-affinity binding. Adapted from Jiang et al., 2021 [168].

References

    1. Hodgkin AL, Huxley AF.. A quantitative description of membrane current and its application to conduction and excitation in nerve. J Physiol. 1952;117(4):500–23. doi: 10.1113/jphysiol.1952.sp004764 - DOI - PMC - PubMed
    1. Hall AE, Hutter OF, Noble D. Current-voltage relations of Purkinje fibres in sodium-deficient solutions. J Physiol. 1963;166:2225–2240. doi: 10.1113/jphysiol.1963.sp007102 - DOI - PMC - PubMed
    1. Adrian RH, Chandler WK, Hodgkin AL. Voltage clamp experiments in striated muscle fibres. J Physiol. 1970;208(3):607–644. doi: 10.1113/jphysiol.1970.sp009139 - DOI - PMC - PubMed
    1. Hille B. Ionic channels of excitable membranes. 3rd ed. Sunderland (MA): Sinauer Associates Inc.; 2001.
    1. Eckert R, Brehm P. Ionic mechanisms of excitation in Paramecium. Annu Rev Biophys Bioeng. 1979;8(1):353–383. doi: 10.1146/annurev.bb.08.060179.002033 - DOI - PubMed

MeSH terms

LinkOut - more resources