. 2024 Jan;11(2):e2302776.
doi: 10.1002/advs.202302776. Epub 2023 Nov 20.

Targeting the Mitochondrial Chaperone TRAP1 Alleviates Vascular Pathologies in Ischemic Retinopathy

Affiliations

Targeting the Mitochondrial Chaperone TRAP1 Alleviates Vascular Pathologies in Ischemic Retinopathy

So-Yeon Kim et al. Adv Sci (Weinh). 2024 Jan.

Abstract

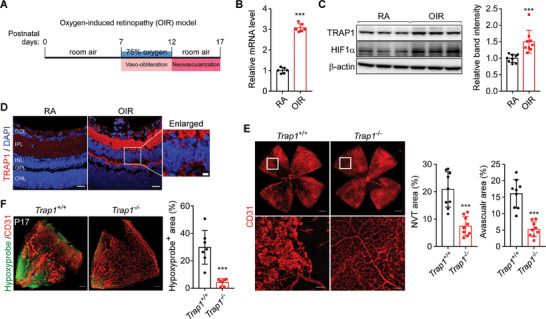
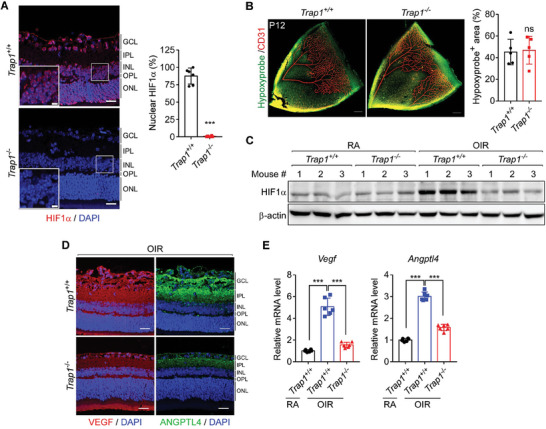
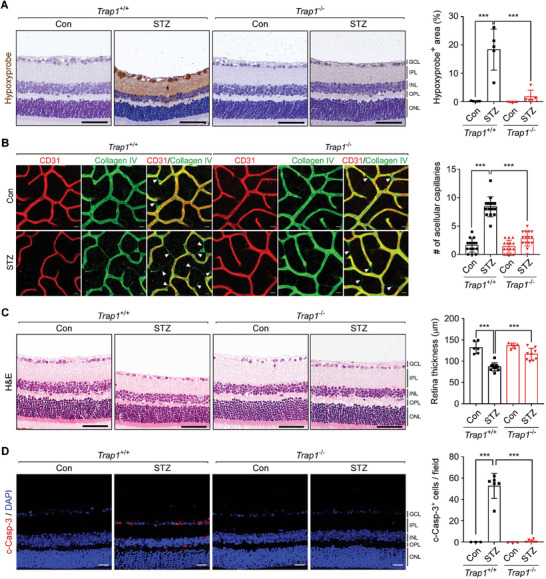
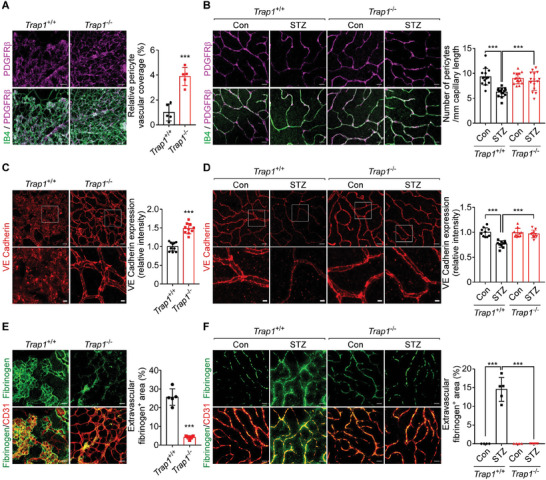
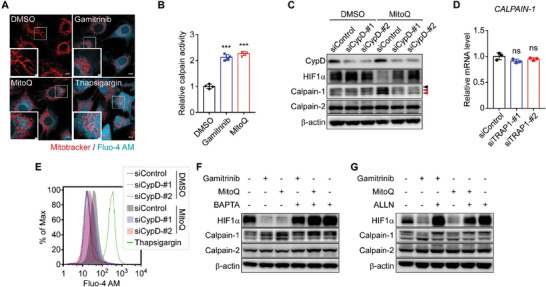
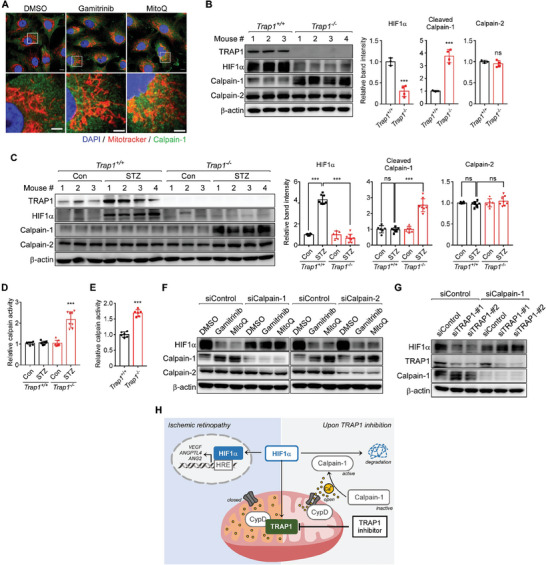
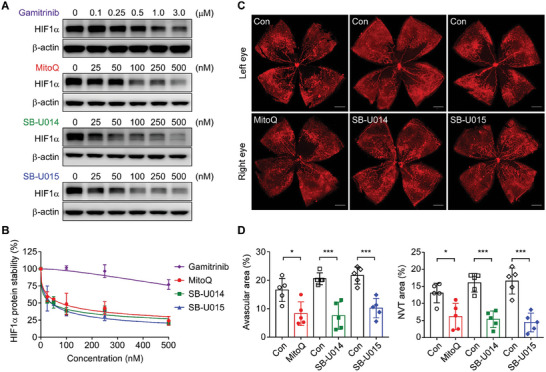
Activation of hypoxia-inducible factor 1α (HIF1α) contributes to blood-retinal barrier (BRB) breakdown and pathological neovascularization responsible for vision loss in ischemic retinal diseases. During disease progression, mitochondrial biology is altered to adapt to the ischemic environment created by initial vascular dysfunction, but the mitochondrial adaptive mechanisms, which ultimately contribute to the pathogenesis of ischemic retinopathy, remain incompletely understood. In the present study, it is identified that expression of mitochondrial chaperone tumor necrosis factor receptor-associated protein 1 (TRAP1) is essential for BRB breakdown and pathologic retinal neovascularization in mouse models mimicking ischemic retinopathies. Genetic Trap1 ablation or treatment with small molecule TRAP1 inhibitors, such as mitoquinone (MitoQ) and SB-U015, alleviate retinal pathologies via proteolytic HIF1α degradation, which is mediated by opening of the mitochondrial permeability transition pore and activation of calcium-dependent protease calpain-1. These findings suggest that TRAP1 can be a promising target for the development of new treatments against ischemic retinopathy, such as retinopathy of prematurity and proliferative diabetic retinopathy.

Keywords: calcium; calpain-1; hypoxia-inducible factor 1α (HIF1α); ischemic retinopathy; mitochondrial permeability transition pore (mPTP); tumor necrosis factor receptor-associated protein 1 (TRAP1).


Conflict of interest statement

B.H.K. is the founder of SmartinBio. Inc. Other authors declare that they have no competing interests.

Figures

Figure 1
Figure 1
Contribution of TRAP1 to the development of ischemic retinopathy. A) Schematic for the experimental procedures of OIR mice. OIR mice were generated as described in the Experimental Section. P7 mice were exposed to hyperoxia (75% oxygen) for 5 days (vaso‐obliteration), and then returned to room air for 5 days (compensatory neovascularization). At P17, mice were sacrificed for analyses. B) Quantification of TRAP1 mRNA. Retinas collected from OIR mice and age‐matched control mice (RA, room air) were analyzed by quantitative real time PCR (qPCR) (n = 6; duplicate experiment of 3 mice/group). C) Quantification of TRAP1 protein levels. Left. RA and OIR mouse retinas were comparatively analyzed by western blotting. Right. The band intensities of TRAP1 were normalized to those of β‐actin in mouse retinas and compared (n = 10 mice/group). D) Immunohistochemical staining of TRAP1 in mouse retinas. Mouse retinal sections were stained with an anti‐TRAP1 antibody (red) and DAPI (blue), and analyzed by confocal microscopy. Scale bar, 20 µm and 5 µm (enlarged image). GCL, ganglion cell layer; IPL, inner plexiform layer; INL, inner nuclear layer; OPL, outer plexiform layer; ONL, outer nuclear layer (n = 3 mice/RA, n = 6 mice/OIR). E) Normalized retinal blood vessels in Trap1 −/− OIR mice. Left. Retinas collected from Trap1 +/+ and Trap1 −/− OIR mice were flat‐mounted and stained with an anti‐CD31 antibody. Scale bars, 500 µm (top) and 100 µm (bottom). Right. Quantification of neovascular tuft (NVT) and avascular areas. Retinal vessel images (n = 9 mice/group) were quantitatively analyzed as reported previously.[ 13a ] F) Hypoxyprobe staining of OIR mouse retinas. Left. Whole‐mounted retinas from OIR mice (P17) were stained with Hypoxyprobe (green) and an anti‐CD31 antibody (red) to visualize hypoxic regions and blood vessels, respectively. Hypoxic areas were significantly decreased in Trap1 −/− OIR mice relative to Trap1 +/+ OIR mice. Scale bar, 200 µm. Right. Quantification of Hypoxyprobe‐positive areas (n = 7 mice/group). Data information: Data are expressed as mean ± SEM. Student t‐test, *** P < 0.001.
Figure 2
Figure 2
Regulation of HIF1α stability and angiogenic factor expression by TRAP1. A) HIF1α expression in P17 OIR mouse retinas. Left. Retinal sections collected from Trap1 +/+ and Trap1 −/− OIR mice were stained with an anti‐HIF1α antibody (red) and DAPI (blue), and imaged by confocal microscopy. Scale bars, 20 µm and 5 µm (inset). Right Quantification of the ratio (%) of HIF1α/DAPI double‐positive areas to DAPI‐positive areas (n = 6 mice/group). B) Identification of hypoxic areas in P12 OIR mouse retinas. Left. Whole‐mount retinas were stained with Hypoxyprobe (green) and an anti‐CD31 antibody (red) to visualize hypoxic regions and blood vessels, respectively. Scale bar, 200 µm. Right. Quantification of hypoxic areas. Hypoxyprobe‐positive areas were quantified from the obtained images (n = 5 mice/group). C) Expression of HIF1α in P12 control (RA) and OIR mouse retinas. Western blot analysis was performed to measure HIF1α expression in the retinas of Trap1 +/+ and Trap1 −/− RA and OIR mice (n = 3 mice/group). D) VEGF and ANGPTL4 expression in mouse P17 OIR retinas. Retinal sections from Trap1 +/+ and Trap1 −/− OIR mice were stained with anti‐VEGF (red) and anti‐ANGPTL4 (green) antibodies, and analyzed by confocal microscopy (n = 3 mice/group). Scale bar, 20 µm. E) Quantitation of Vegf and Angptl4 mRNAs in P17 OIR mouse retinas. mRNA levels in control (RA) and OIR Trap1 +/+ and Trap1 −/− mouse retinas were analyzed by qPCR and compared (n = 6; duplicate experiment of 3 mice/group). Data information: Data are expressed as mean ± SEM. Student t‐test, *** P < 0.001; ns, not significant.
Figure 3
Figure 3
Trap1 KO decreases vascular abnormalities in STZ mice. A) Hypoxyprobe staining of the retinas of 16‐week post‐STZ injection Trap1 +/+ and Trap1 −/− mice of 25 weeks old (Figure S6A, Supporting information). Left. Retinal sections of Trap1 +/+ and Trap1 −/− STZ mice were analyzed by Hypoxyprobe staining. Scale bar, 50 µm. Right. Quantitation of Hypoxyprobe‐positive areas (n = 5 mice/group). B) Decreased retinal capillary degeneration in Trap1 −/− STZ mice. Left. STZ and control (Con) retinas from Trap1 +/+ and Trap1 −/− mice were flat‐mounted and stained with anti‐CD31 (red) and anti‐collagen IV antibodies (green) to visualize blood vessels and basement membranes, respectively. White triangles indicate acellular capillaries. Scale bar, 20 µm. Right. Quantification of acellular capillaries. The number of acellular capillaries was counted in each microscopic field (n = 15; 5 mice/group, 3 fields/mouse). C) Thinning of STZ mouse retinas. Left. Retinal sections collected from Trap1 +/+ and Trap1 −/− STZ mice were analyzed by H&E staining. Scale bar, 50 µm. Right. Quantification of retinal thickness (control n = 6, STZ n = 10 mice/group). D) Cell death in STZ mouse retinas. Left. Retinal sections of Trap1 +/+ and Trap1 −/− STZ mice were analyzed by cleaved caspase‐3 (c‐Casp‐3, red) staining. Scale bar, 20 µm. Right. Quantification of c‐Casp‐3‐positive cells in STZ mouse retinas (control n = 3, STZ n = 6 mice/group). Data information: Data are expressed as mean ± SEM. Student t‐test, *** P < 0.001.
Figure 4
Figure 4
TRAP1 regulation of vascular organization and permeability. A) Pericyte vascular coverage in P17 OIR mouse retinas. Left. Whole‐mount retinas collected from Trap1 +/+ and Trap1 −/− P17 OIR mice were stained with an anti‐PDGFR‐β antibody (magenta) and IB4 (green) to label PCs and ECs, respectively, and analyzed by confocal microscopy. Scale bar, 50 µm. Right. The ratio of the PDGFR+ area to the IB4+ area was calculated to measure pericyte coverage in vascularized areas (n = 5 mice/group). Neovascular tufts were not included in analysis. B) Pericyte coverage in STZ mouse retinas. Left. Whole‐mount retinas collected from STZ mice were analyzed by confocal microscopy as in (A). Scale bar, 20 µm. Right. The number of PCs per millimeter of capillary length was counted (n = 15; 5 mice/group, 3 fields/mouse). C) Endothelial junction integrity in P17 OIR mouse retinas. Left. Whole‐mount retinas collected from Trap1 +/+ and Trap1 −/− OIR mice were stained with an anti‐VE‐cadherin antibody to visualize adherens junctions. Scale bars, 20 µm (top) and 5 µm (bottom). Right. The intensities of VE‐cadherin staining were calculated and compared (n = 10; 4 mice/group, 2–3 fields/mouse). D) Endothelial junction integrity in STZ mouse retinas. Left. Whole‐mount retinas collected from STZ mice were analyzed by confocal microscopy as in (C). Scale bar, 20 µm (top) and 5 µm (bottom). Right. Quantification of VE‐cadherin staining intensity (n = 10; 4 mice/group, 2–3 fields/mouse). E) Vascular leakage in P17 OIR mouse retinas. Left. Whole‐mount retinas collected from Trap1 +/+ and Trap1 −/− OIR mice were stained with anti‐fibrinogen (green) and anti‐CD31 (red) antibodies. Scale bars, 50 µm. Right. Quantification of fibrinogen signals (n = 5 mice/group, 1 field/mouse). F) Vascular leakage in STZ mouse retinas. Left. Whole‐mount retinas collected from STZ mice were analyzed by confocal microscope as in (E). Scale bars, 10 µm. Right. Quantification of fibrinogen signal (n = 4–5; 4 mice/group, 1–2 fields/mouse). Data information: Data are expressed as mean ± SEM. Student t‐test, *** P < 0.001.
Figure 5
Figure 5
TRAP1 inhibition induces mPTP opening, mitochondrial calcium discharge, and calpain‐1 activation. A) Visualization of cytoplasmic calcium. Fluo‐4 AM‐labeled MIO‐M1 cells were incubated with the TRAP1 inhibitors gamitrinib and MitoQ[ 32 , 41 ] for 6 h or thapsigargin for 30 min under hypoxia, and analyzed by confocal microscopy. Scale bars, 10 µm and 2 µm (inset). B) Calpain activation by TRAP1 inhibitors. MIO‐M1 cells were treated with a TRAP1 inhibitor, 3 µM gamitrinib or 0.5 µm MitoQ, for 6 h under hypoxia (n = 4). Enzyme activity was measured using a fluorogenic calpain substrate as described in the Experimental Section. C) Restored HIF1α expression upon CypD inhibition. MIO‐M1 cells were incubated with control or CypD‐targeting siRNAs, treated with the TRAP1 inhibitor MitoQ for 6 h under hypoxia, harvested, and analyzed by western blotting. Black and red arrows indicate pro and autolyzed forms of calpain‐1, respectively. D) Calpain‐1 mRNA expression upon TRAP1 depletion. MIO‐M1 cells were incubated with TRAP1‐targeting siRNAs for 48 h, exposed to hypoxia for 6 h, harvested, and analyzed by qPCR (n = 4). E) Modestly elevated cytosolic calcium by TRAP1 inhibition. After siRNA knockdown of CypD, Fluo‐4 AM‐labeled MIO‐M1 cells were incubated under hypoxic conditions with MitoQ for 6 h. Cells were then analyzed by flow cytometry to detect cytoplasmic calcium. F) Inhibition of HIF1α degradation by calcium chelation. MIO‐M1 cells were incubated with TRAP1 inhibitors, 3 µm gamitrinib, and 0.5 µM MitoQ, and a cell‐permeable calcium chelator, BAPTA (10 µM), for 6 h as indicated under hypoxia and analyzed by western blotting. G) Blocked HIF1α degradation by calpain inhibition. MIO‐M1 cells under hypoxia were incubated with 3 µm gamitrinib, 0.5 µm MitoQ, and 10 µm ALLN (calpain inhibitor) as indicated for 6 h and analyzed by western blotting. Data information: Data are expressed as mean ± SEM. Student t‐test, *** P < 0.001; ns, not significant.
Figure 6
Figure 6
TRAP1 inhibition triggers calcium/calpain‐1‐dependent HIF1α degradation. A) Staining of mitochondria and calpain‐1. MitoTracker‐labeled MIO‐M1 cells were exposed to 3 µm gamitrinib or 0.5 µm MitoQ for 6 h under hypoxia and analyzed by immunocytochemistry with an anti‐calpain‐1 antibody. Scale bars, 10 µm (top) and 5 µm (bottom). B) Calpain autolysis in OIR mouse retinas. Left. Retinas collected from Trap1 +/+ (n = 3 mice) and Trap1 −/− (n = 4 mice) OIR mice were analyzed by western blotting. Right. Protein band intensities of HIF1α, cleaved calpain‐1, and calpain‐2 were normalized to those of β‐actin and compared. C) Calpain autolysis in STZ mouse retinas. Left. Retinal samples collected from STZ (n = 4 mice) and age‐matched control (n = 3 mice) mice with the Trap1 +/+ or Trap1 −/− genotype were analyzed by western blotting. Right. Protein band intensities were analyzed as in (B). D,E) Calpain activity in mouse retinas. Calpain enzyme activities were analyzed in retinas collected from Trap1 +/+ and Trap1 −/− STZ (D, n = 8 mice/group) and OIR (E, n = 6 mice/group) mice and compared. F) Depletion of calpains by siRNAs. Calpain‐1‐ and calpain‐2‐targeting siRNA‐treated MIO‐M1 cells were incubated with 3 µm gamitrinib or 0.5 µm MitoQ for 6 h under hypoxia and analyzed by western blotting. G) Depletion of calpain‐1 and TRAP1 by siRNAs. MIO‐M1 cells treated with siRNAs as indicated were exposed to hypoxia for 6 h and analyzed by western blotting. H) HIF1α degradation following TRAP1 inhibition. TRAP1 inhibition caused mild mitochondrial calcium discharge into the cytoplasm by opening CypD‐regulated mPTPs. Subsequent activation of calpain‐1 proteolytically degrades HIF1α. Data information: Data are expressed as mean ± SEM. Student t‐test, *** P < 0.001; ns, not significant.
Figure 7
Figure 7
Normalized retinal vascularization upon topical application of TRAP1 inhibitors. A) HIF1α degradation induced by TRAP1 inhibitors. MIO‐M1 cells were incubated with various concentrations of TRAP1 inhibitors as indicated for 6 h under hypoxia and analyzed by western blotting. B) Quantification of HIF1α protein degradation. The HIF1α band intensities in western blot data obtained as in (A) were analyzed and compared. The data are mean ± SEM from four independent experiments. C) Vascular structure of P17 OIR mouse retinas after topical drug application. Vehicle and 2 mM TRAP1 inhibitors were topically administered to the left and right eyes, respectively, of OIR mice at P12 once per day for 5 days. At P17, mice were sacrificed and analyzed by whole‐mount staining with an anti‐CD31 antibody and confocal microscopy. Scale bar, 500 µm. D) Quantification of avascular areas and neovascular tuft. Retinal images collected as in (C) were quantitatively analyzed (n = 5 mice/group). Data information: Data are expressed as mean ± SEM. Student t‐test, *** P < 0.001; * P <0.5.

References

    1. a) Nunnari J., Suomalainen A., Cell 2012, 148, 1145. - PMC - PubMed
    2. b) Vyas S., Zaganjor E., Haigis M. C., Cell 2016, 166, 555. - PMC - PubMed
    1. Suomalainen A., Battersby B. J., Nat. Rev. Mol. Cell Biol. 2018, 19, 77. - PubMed
    1. a) Rasola A., Neckers L., Picard D., Trends Cell Biol. 2014, 24, 455. - PMC - PubMed
    2. b) Kang B. H., Plescia J., Dohi T., Rosa J., Doxsey S. J., Altieri D. C., Cell 2007, 131, 257. - PubMed
    3. c) Felts S. J., Owen B. A. L., Nguyen P., Trepel J., Donner D. B., Toft D. O., J. Biol. Chem. 2000, 275, 3305. - PubMed
    1. a) Park H.‐K., Hong J.‐H., Oh Y. T., Kim S. S., Yin J., Lee A.n‐J., Chae Y. C., Kim J. H., Park S.‐H., Park C.‐K., Park M.‐J., Park J. B., Kang B. H., Cancer Res. 2019, 79, 1369.; - PubMed
    2. b) Park H.‐K., Lee J.i‐E., Lim J., Kang B. H., Mol Cancer 2014, 13, 148. - PMC - PubMed
    1. Casson R. J., Chidlow G., Crowston J. G., Williams P. A., Wood J. P. M., Prog. Retin. Eye Res. 2021, 81, 100881. - PubMed

Publication types

Substances