

Amino Acid-Starved Cancer Cells Utilize Macropinocytosis and Ubiquitin-Proteasome System for Nutrient Acquisition
- PMID: 37983609
- PMCID: PMC10767443
- DOI: 10.1002/advs.202304791
Amino Acid-Starved Cancer Cells Utilize Macropinocytosis and Ubiquitin-Proteasome System for Nutrient Acquisition
Abstract
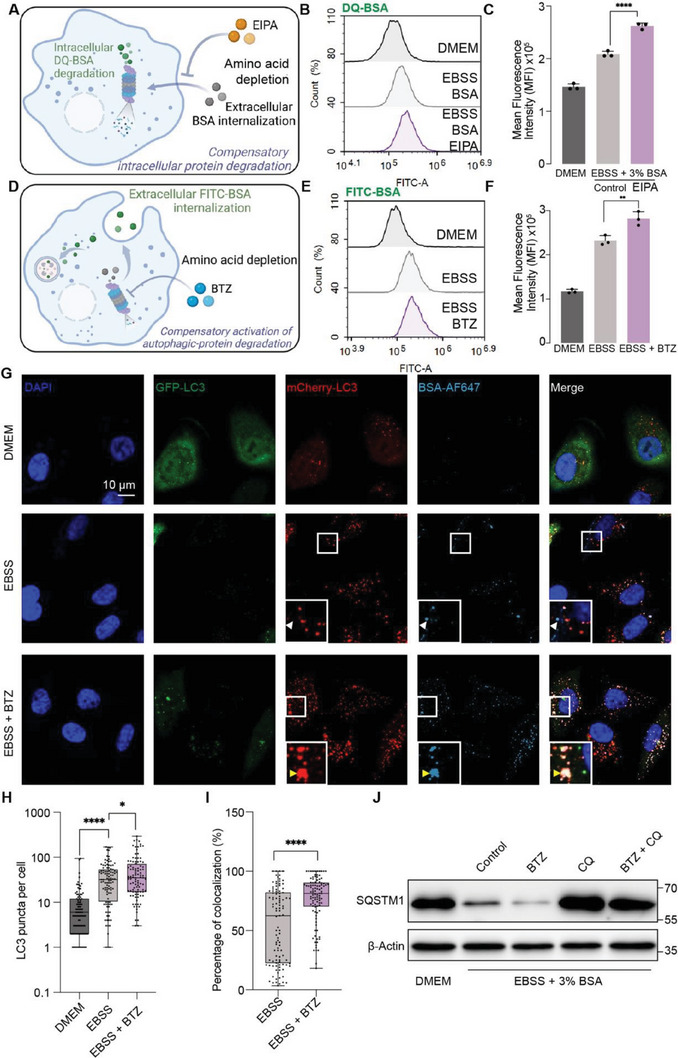
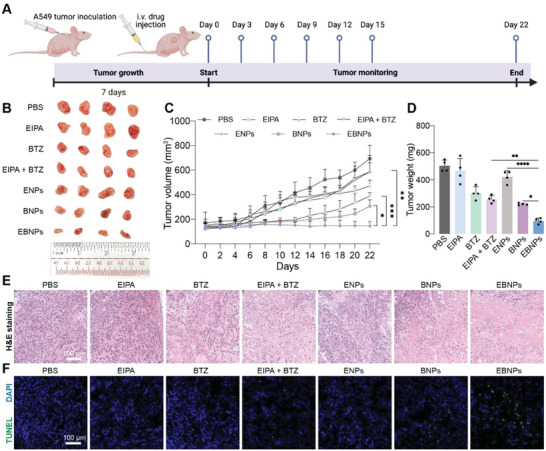
To grow in nutrient-deprived tumor microenvironment, cancer cells often internalize and degrade extracellular proteins to refuel intracellular amino acids. However, the nutrient acquisition routes reported by previous studies are mainly restricted in autophagy-lysosomal pathway. It remains largely unknown if other protein degradation systems also contribute to the utilization of extracellular nutrients. Herein, it is demonstrated that under amino acid starvation, extracellular protein internalization through macropinocytosis and protein degradation through ubiquitin-proteasome system are activated as a nutrient supply route, sensitizing cancer cells to proteasome inhibition. By inhibiting both macropinocytosis and ubiquitin-proteasome system, an innovative approach to intensify amino acid starvation for cancer therapy is presented. To maximize therapeutic efficacy and minimize systemic side effects, a pH-responsive polymersome nanocarrier is developed to deliver therapeutic agents specifically to tumor tissues. This nanoparticle system provides an approach to exacerbate amino acid starvation for cancer therapy, which represents a promising strategy for cancer treatment.
Keywords: amino acid starvation; cancer starvation therapy; macropinocytosis; pH-responsive polymersomes; ubiquitin-proteasome system.
© 2023 The Authors. Advanced Science published by Wiley-VCH GmbH.
Conflict of interest statement
The authors declare no conflict of interest.
Figures


Similar articles
-
Ubiquitin-proteasome-dependent muscle proteolysis responds slowly to insulin release and refeeding in starved rats.J Physiol. 2003 Feb 1;546(Pt 3):765-76. doi: 10.1113/jphysiol.2002.032367. J Physiol. 2003. PMID: 12563002 Free PMC article.
-
Starvation-induced proteasome assemblies in the nucleus link amino acid supply to apoptosis.Nat Commun. 2021 Nov 30;12(1):6984. doi: 10.1038/s41467-021-27306-4. Nat Commun. 2021. PMID: 34848715 Free PMC article.
-
Measuring the Overall Rate of Protein Breakdown in Cells and the Contributions of the Ubiquitin-Proteasome and Autophagy-Lysosomal Pathways.Methods Mol Biol. 2018;1844:261-276. doi: 10.1007/978-1-4939-8706-1_17. Methods Mol Biol. 2018. PMID: 30242715 Free PMC article.
-
To deliver or to degrade - an interplay of the ubiquitin-proteasome system, autophagy and vesicular transport in plants.FEBS J. 2016 Oct;283(19):3534-3555. doi: 10.1111/febs.13712. FEBS J. 2016. PMID: 26991113 Review.
-
Substrate recognition in selective autophagy and the ubiquitin-proteasome system.Biochim Biophys Acta. 2014 Jan;1843(1):163-81. doi: 10.1016/j.bbamcr.2013.03.019. Epub 2013 Mar 29. Biochim Biophys Acta. 2014. PMID: 23545414 Review.
Cited by
-
Cellular Regulation of Macropinocytosis.Int J Mol Sci. 2024 Jun 26;25(13):6963. doi: 10.3390/ijms25136963. Int J Mol Sci. 2024. PMID: 39000072 Free PMC article. Review.
-
Methionine Dependency and Restriction in Cancer: Exploring the Pathogenic Function and Therapeutic Potential.Pharmaceuticals (Basel). 2025 Apr 28;18(5):640. doi: 10.3390/ph18050640. Pharmaceuticals (Basel). 2025. PMID: 40430461 Free PMC article. Review.
-
Nutrient restriction protects against valve interstitial cell calcification by upregulating ubiquitin mediated proteolysis.Front Cardiovasc Med. 2025 Jul 21;12:1586775. doi: 10.3389/fcvm.2025.1586775. eCollection 2025. Front Cardiovasc Med. 2025. PMID: 40761233 Free PMC article.
-
Survival strategies of cancer cells: the role of macropinocytosis in nutrient acquisition, metabolic reprogramming, and therapeutic targeting.Autophagy. 2025 Apr;21(4):693-718. doi: 10.1080/15548627.2025.2452149. Epub 2025 Jan 26. Autophagy. 2025. PMID: 39817564 Free PMC article. Review.
-
Dynamic crosstalk between amino acid metabolism and cancer drug efficacy: From mechanisms to therapeutic opportunities.iScience. 2025 Apr 11;28(5):112405. doi: 10.1016/j.isci.2025.112405. eCollection 2025 May 16. iScience. 2025. PMID: 40625405 Free PMC article. Review.
References
-
- a) Pan M., Zorbas C., Sugaya M., Ishiguro K., Kato M., Nishida M., Zhang H.‐F., Candeias M. M., Okamoto A., Ishikawa T., Soga T., Aburatani H., Sakai J., Matsumura Y., Suzuki T., Proud C. G., Lafontaine D. L. J., Osawa T., Nat. Commun. 2022, 13, 3706; - PMC - PubMed
- b) Palm W., Park Y., Wright K., Pavlova N. N., Tuveson D. A., Thompson C. B., Cell 2015, 162, 259; - PMC - PubMed
- c) Leprivier G., Remke M., Rotblat B., Dubuc A., Mateo A.‐R. F., Kool M., Agnihotri S., El‐Naggar A., Yu B., Prakash Somasekharan S., Faubert B., Bridon G., Tognon C. E., Mathers J., Thomas R., Li A., Barokas A., Kwok B., Bowden M., Smith S., Wu X., Korshunov A., Hielscher T., Northcott P. A., Galpin J. D., Ahern C. A., Wang Y., Mccabe M. G., Collins V. P., Jones R. G., et al., Cell 2013, 153, 1064. - PMC - PubMed
-
- Mizushima N., Curr. Opin. Cell Biol. 2010, 22, 132. - PubMed
-
- a) Sha Z., Zhao J., Goldberg A. L., The Ubiquitin Proteasome System, Humana Press, Totowa, New Jersey: 2018.
- b) Rock K. L., Gramm C., Rothstein L., Clark K., Stein R., Dick L., Hwang D., Goldberg A. L., Cell 1994, 78, 761. - PubMed
Publication types
MeSH terms
Substances
Grants and funding
LinkOut - more resources
Full Text Sources
Medical