. 2023 Nov;13(11):e1466.
doi: 10.1002/ctm2.1466.

The m5 C methyltransferase NSUN2 promotes codon-dependent oncogenic translation by stabilising tRNA in anaplastic thyroid cancer

Affiliations

The m5 C methyltransferase NSUN2 promotes codon-dependent oncogenic translation by stabilising tRNA in anaplastic thyroid cancer

Peng Li et al. Clin Transl Med. 2023 Nov.

Abstract

Background: Translation dysregulation plays a crucial role in tumourigenesis and cancer progression. Oncogenic translation relies on the stability and availability of tRNAs for protein synthesis, making them potential targets for cancer therapy.

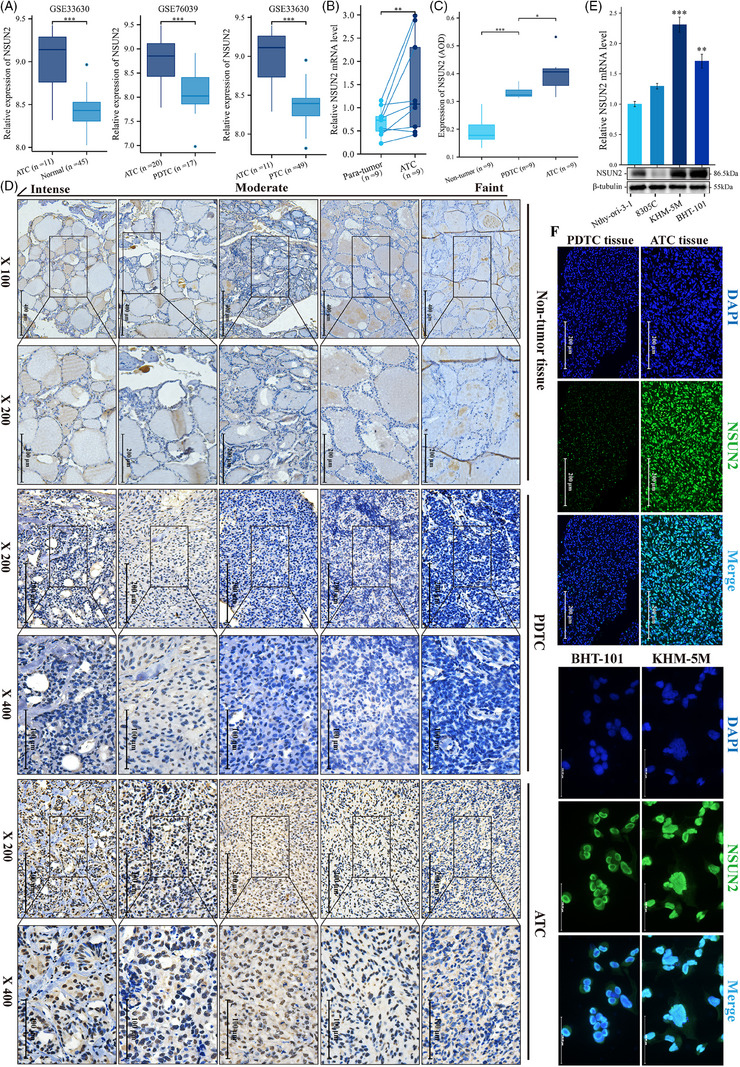
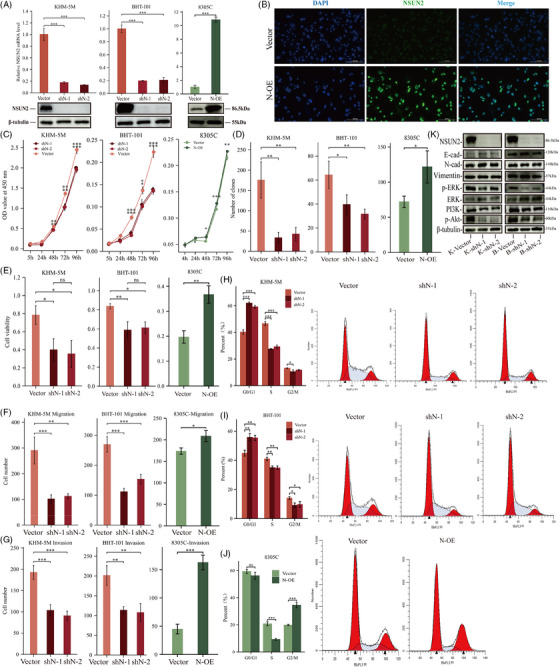
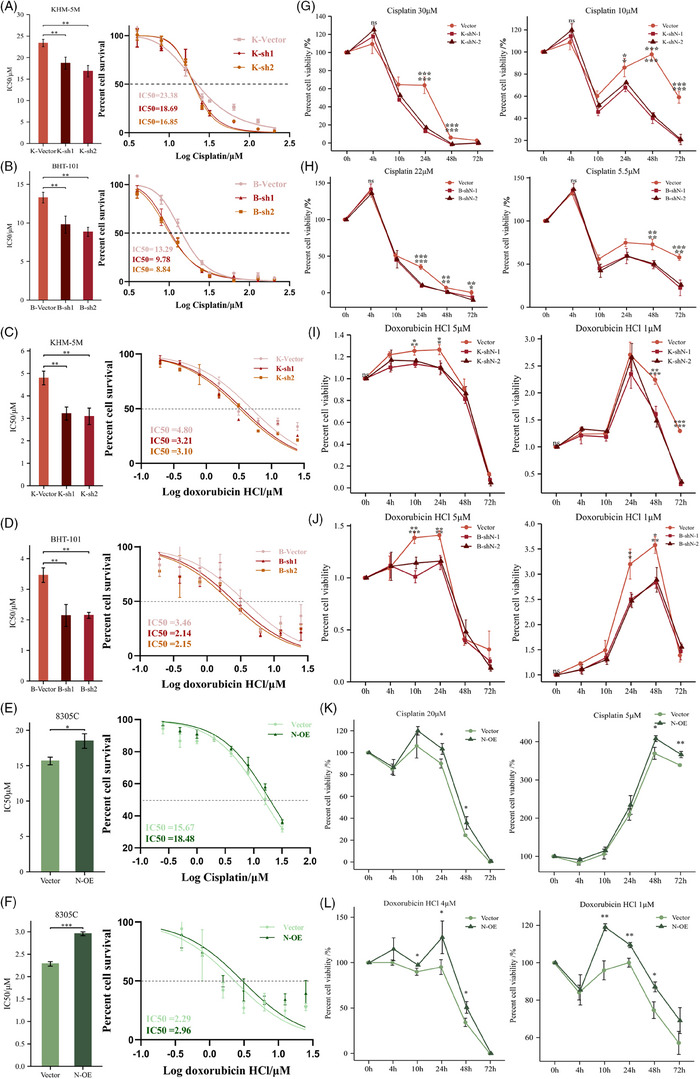
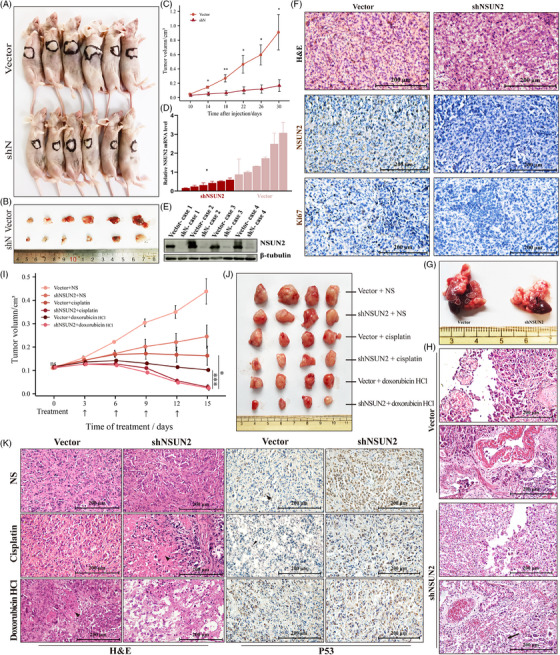
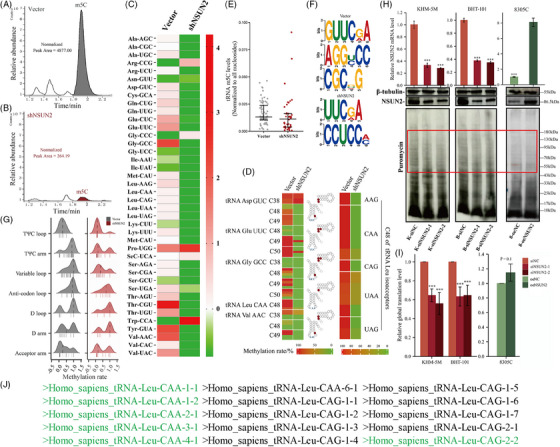
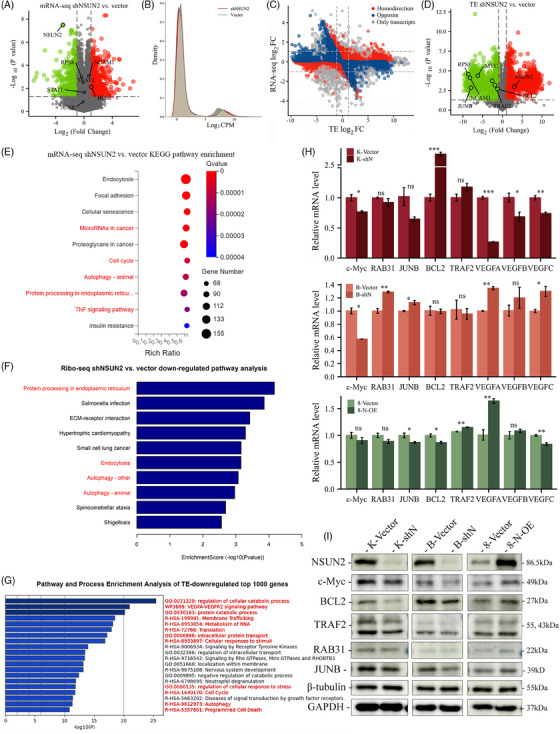
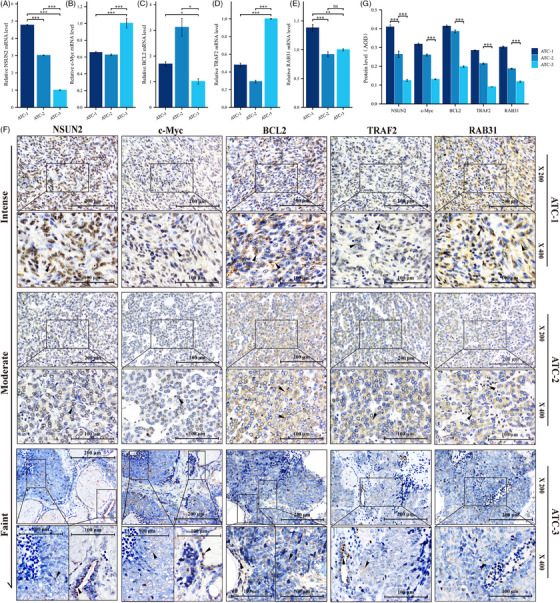
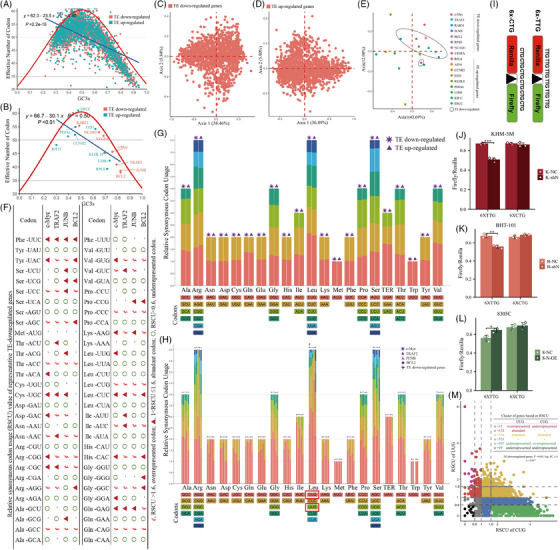
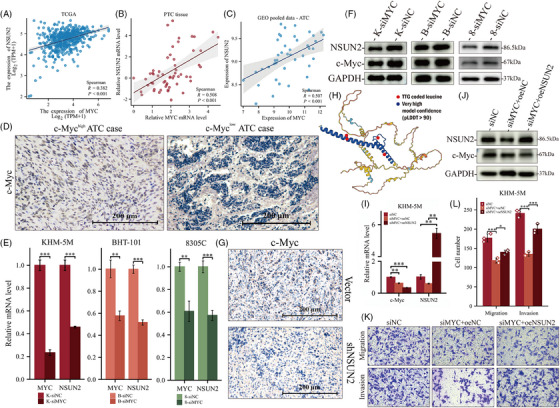
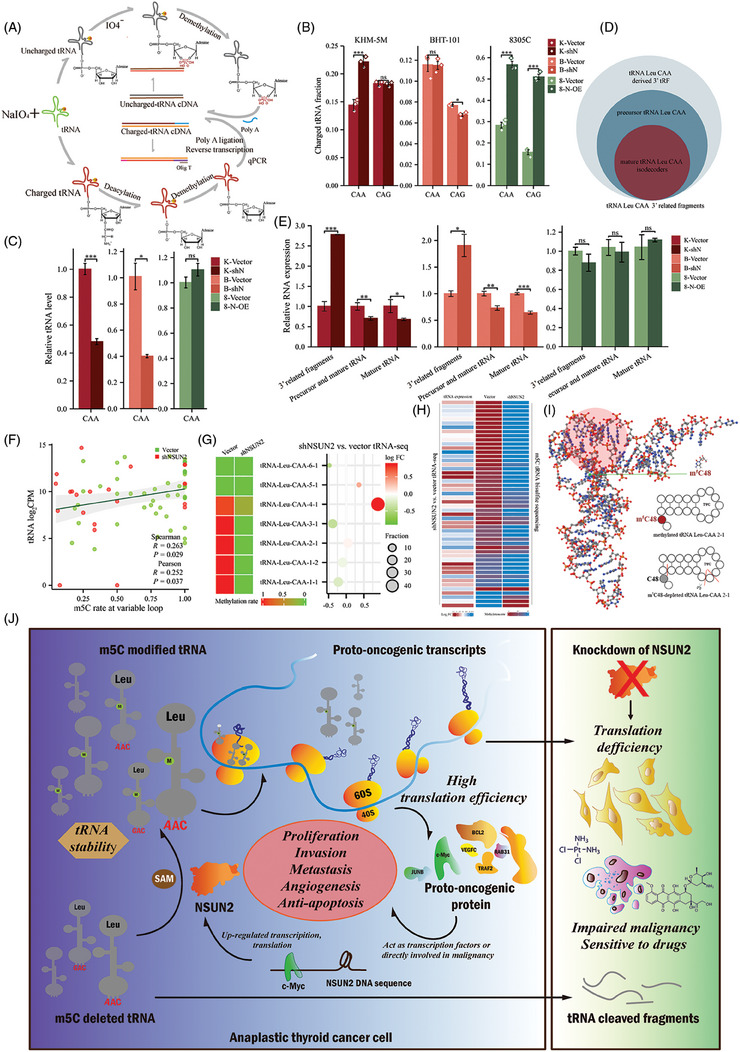
Methods: This study performed immunohistochemistry analysis to assess NSUN2 levels in thyroid cancer. Furthermore, to elucidate the impact of NSUN2 on anaplastic thyroid cancer (ATC) malignancy, phenotypic assays were conducted. Drug inhibition and time-dependent plots were employed to analyse drug resistance. Liquid chromatography-mass spectrometry and bisulphite sequencing were used to investigate the m5 C methylation of tRNA at both global and single-base levels. Puromycin intake and high-frequency codon reporter assays verified the protein translation level. By combining mRNA and ribosome profiling, a series of downstream proteins and codon usage bias were identified. The acquired data were further validated by tRNA sequencing.

Results: This study observed that the tRNA m5 C methyltransferase NSUN2 was up-regulated in ATC and is associated with dedifferentiation. Furthermore, NSUN2 knockdown repressed ATC formation, proliferation, invasion and migration both in vivo and in vitro. Moreover, NSUN2 repression enhanced the sensitivity of ATC to genotoxic drugs. Mechanically, NSUN2 catalyses tRNA structure-related m5 C modification, stabilising tRNA that maintains homeostasis and rapidly transports amino acids, particularly leucine. This stable tRNA has a substantially increased efficiency necessary to support a pro-cancer translation program including c-Myc, BCL2, RAB31, JUNB and TRAF2. Additionally, the NSUN2-mediated variations in m5C levels and different tRNA Leu iso-decoder families, partially contribute to a codon-dependent translation bias. Surprisingly, targeting NSUN2 disrupted the c-Myc to NSUN2 cycle in ATC.

Conclusions: This research revealed that a pro-tumour m5C methyltransferase, dynamic tRNA stability regulation and downstream oncogenes, c-Myc, elicits a codon-dependent oncogenic translation network that enhances ATC growth and formation. Furthermore, it provides new opportunities for targeting translation reprogramming in cancer cells.

Keywords: NSUN2; anaplastic thyroid cancer; c-Myc; codon; drug-resistance; global translation; leucine; m5C; tRNA.


Conflict of interest statement

The authors declare no conflict of interest.

Figures

FIGURE 1
FIGURE 1
Expression of NSUN2 in anaplastic thyroid cancer. (A) Box plots showing the expression of NSUN2 between ATC and normal, PDTC or PTC samples from two different publicly available RNA‐seq datasets GSE33630 and GSE76039. (B) qRT‐PCR showing the relative expression of NSUN2 in ATC (n = 9) and paired para‐tumour tissue (n = 9). Wilcoxon signed rank test, p = 0.008. (C) Quantification of NSUN2 staining in normal thyroid, PDTC and ATC tissue by average optical density (AOD). Tukey HSD test. (D) IHC staining for NSUN2 in normal thyroid, PDTC and ATC tissue. Grouped by faint, moderate and intense staining. (E) qRT‐PCR and WB showing the relative expression of NSUN2 in ATC and normal thyroid cell lines. Wilcoxon signed rank test. (F) IF staining showed NSUN2 (green fluorescence) located in nuclear.
FIGURE 2
FIGURE 2
NSUN2 promotes malignancy of ATC. (A) qPCR and WB validated the expression level of NSUN2 in vector, shN and N‐OE cell lines. Tukey HSD test. (B) IF staining showed overexpressed NSUN2 (green fluorescence) located in nuclear. (C) CCK‐8 assay screening for effects of NSUN2 knockdown on KHM‐5 M and BHT‐101, NSUN2 overexpression on 8305C proliferation from day 0 to day 4. Pairwise comparisons of estimated marginal means. (D) Statistical analysis of colony formation for vector, shN and N‐OE. (E) Statistical analysis of EdU assay for vector, shN and N‐OE. (F and G) Quantitative analysis of vector, shN and N‐OE cell migration (F) and invasion (G) assessed by in vitro transwell assay. (H–J) Flow cytometry showed NSUN2 promotes ATC cells transition from G0/G1 phase to S phase and G2/M phase. (K) WB shows changes of key protein expression in representative signal pathways in vector and shN cell.
FIGURE 3
FIGURE 3
IC50 and time‐dependent curves of ATC cells exposed to cisplatin and doxorubicin HCl. (A–F) Cell growth inhibitory assay and statistical comparisons to evaluate the impacts of NSUN2 knockdown on the response of KHM‐5 M and BHT‐101 cells to cisplatin and doxorubicin HCl (A–D). Cell growth inhibitory assay and statistical comparisons to evaluate the impacts of NSUN2 overexpression on the response of 8305C cells to cisplatin (E) and doxorubicin HCl (F). IC50: half‐maximal inhibitory concentration. Tukey HSD test. (G–L) Time plot of the response of vector, shN and N‐OE to high or low concentrations of cisplatin and doxorubicin HCl. Pairwise comparisons of estimated marginal means.
FIGURE 4
FIGURE 4
NSUN2 knockdown slows ATC growth in vivo and lung metastasis, increasing the efficacy of chemotherapy drugs. (A and B) Overview of tumours in xenograft mice model subcutaneously implanted with shN and vector cells. Scale bars, 200 μm. (C) Growth curves of tumour volumes formed by shN and vector cells. Data were presented as the mean ± SEM. (D) qRT‐PCR analysis of NSUN2 mRNA level in xenograft tumours. (E) WB showing the protein level of NSUN2 in xenograft tumours. (F) Haematoxylin–eosin staining and IHC staining of NSUN2 and Ki67 in tumour samples in xenograft mice model subcutaneously implanted with shN and vector cells. Scale bars, 200 μm. (G) Representative images of tumours in lung metastasis mice model intracardiac‐injected with shN and vector cells. shN cells injection developed less metastatic nodules than vector cells injection. (H) Haematoxylin–eosin staining of lung‐metastatic nodules in model intracardiac‐injected with shN and vector cells. Scale bars, 200 μm. (I) Overview of cisplatin‐ or doxorubicin HCl‐treated tumours in xenograft mice model subcutaneously implanted with shN and vector cells. NS indicates normal saline, as control. (J) Growth curves of cisplatin‐ or doxorubicin HCl‐treated tumour volumes formed by shN and vector cells. Data were presented as the mean ± SEM. (K) Haematoxylin–eosin and IHC staining of drug‐treated tumours in xenograft mice model subcutaneously implanted with shN and vector cells. Scale bars, 200 μm.
FIGURE 5
FIGURE 5
The deletion of cytoplasmic tRNA methylation induced by NSUN2 knockdown showed a species bias and secondary structure bias, and led to a decrease in the overall protein translation level. (A and B) LC–MS analysis of total 5‐methylcytidine (m5C) levels in purified tRNA from vector (A) and shN (B) cells. (C) Heatmap of m5C‐modified cytoplasmic tRNAs in the NSUN2 knockdown and control cells. Each cell shows the summarised m5C level of a representative tRNA isodecoder. The colour represents the relative intensity of methylation changes. (D) Heatmap illustrating the methylation levels of different cytosines on candidate tRNAs, as determined by bisulphite sequencing of tRNA preparations from the NSUN2 knockdown and control cells. A gradient from green to red indicates the methylation rate from 0 to 100%. (E) Quantification of m5C level on m5C‐modified tRNAs. (F) Motif sequence at m5C sites, p value < .001, E value < 0.01. (G) Ridge plot showing the change of m5C methylation rate density on tRNA secondary structure between vector and shN cells. Each short vertical line represents methylation rate of a specific m5C site. (H) The effects of NSUN2 knockdown and expression on protein synthesis in KHM‐5 M, BHT‐101 and 8305C as analysed by puromycin intake assay. (I) Statistical analysis on the basis of puromycin incorporation to monitor protein synthesis. Data are shown as mean ± SD of N = 3 biological replicates. (J) Human genome mature tRNA Leu‐CAA and CAG, the green part indicates that there are detectable m5C modification sites on the tRNA sequence.
FIGURE 6
FIGURE 6
The transcriptomic and translational changes caused by NSUN2 deletion are mainly concentrated in the tumourigenesis and development‐related pathways, and NSUN2 knockdown mechanically leads to codon‐dependent translation attenuation. (A) Volcano plots of mRNA‐seq for the differences in vector and shN groups determined by t‐test. The y axis indicates the p values. The x axis indicates fold change (FC). The significantly down‐regulated (log2FC ≤−1, p < .05, green) or up‐regulated (log2FC ≥1, p < .05, red) genes were shown. Vertical dashed lines indicate cut‐off of log2FC (1 or −1); horizontal dashed lines indicate cut‐off of p value (.05). (B) Density plot showing translation changes upon NSUN2 knockdown by Ribo‐seq. (C) Scatterplot of the FCs of TE and mRNA abundance in NSUN2‐depleted KHM‐5 M (log2FC ≥ 1 and ≤−1; p < .05). Homo‐direction and opposite are used to describe the relative trend of mRNA level and translation level. (D) Volcano plots of TE differences in vector and shN groups. The y axis indicates the p values. The x axis indicates fold change (FC). The significantly TE‐down‐regulated (log2FC ≤−1, p < .05) or up‐regulated (log2FC ≥1, p < .05) genes were shown. Vertical dashed lines indicate cut‐off of log2FC (1 or −1); horizontal dashed lines indicate cut‐off of p value (.05). Representative genes were marked. (E) KEGG enrichment analysis for mRNA‐seq between shN and vector. (F) Pathway analysis for TE‐down‐regulated genes. (G) Pathway and process enrichment analysis of top 1000 TE‐down‐regulated genes. (H) qRT‐PCR analysis of representative TE‐down‐regulated genes. (I) Immunoblot detection of representative TE‐down‐regulated genes.
FIGURE 7
FIGURE 7
The correlation between NSUN2 and the expression of representative genes was also verified in ATC tissues. (A–E) qRT‐PCR analysis showed that there was no obvious correlation between c‐Myc (B), TRAF2 (C), BCL2 (D), RAB31 (E) and NSUN2 (A) mRNA levels in ATC tissues. (F) The ATC tissues were arranged according to the expression level of NSUN2 protein, and those with low expression of NSUN2 tended to have lower protein levels of c‐Myc, TRAF2 and RAB31. (G) Quantification of IHC staining in ATC tissue by average optical density (AOD), ANOVA.
FIGURE 8
FIGURE 8
Some TE‐down‐regulated genes showed codon usage bias. (A and B) ENC‐plot analysis of significantly TE‐changed (|log2FC| ≥1, p < .05) genes (A) and representative genes (B). The red curve was the expected ENC‐values versus GC3s. ENC, effective number of codons. GC3s, GC content in the third digit of the synonymous codon. (C–E) Correspondence analysis of TE‐down‐regulated (C), TE‐up‐regulated (D) and representative (E) genes. (A plot with Axis1 against Axis 2 was plotted based on RSCU values of these genes.) (F) The table lists the RSCU values for each codon of four representative TE‐down‐regulated genes. ¢ (RSCU > 1.6), overrepresented codon; ▲ (1 < RSCU ≤ 1.6), abundant codon; ○ (RSCU < .6), underrepresented codon. (G) Relative synonymous codon usage (RSCU) values of top 1000 TE‐down‐regulated and TE‐up‐regulated genes. (H) Comparison of RSCU values of TE‐down‐regulated genes as a whole and four representative genes alone. (I) Scheme illustrating the dual luciferase reporter system for assessing the TE of TTG‐rich protein in vector and shN ATC cells. (J–L) 6X‐TTG and 6X‐CTG reporter activity was quantified in vector and (J and K) shN ATC cells or (L) N‐OE cells. Data represent mean ± deviation for three biological replicates. (M) According to the RSCU values of UUG and CUG, the TE‐down‐regulated genes were divided into different clusters. The colour of dots is consistent with the font colour in the table. RSCU > 1.6, overrepresented; RSCU < .6, underrepresented; 1 < RSCU ≤ 1.6, abundant.
FIGURE 9
FIGURE 9
NSUN2 levels are regulated by c‐Myc, and the malignancy caused by c‐Myc can be partly performed by NSUN2. (A–C) Association between c‐Myc and NSUN2 in thyroid cancer. (A) PTC RNA‐seq data obtained from TCGA database. (B) PTC patients’ tissue from Xiangya Hospital. (C) ATC RNA‐seq pooled data from GSE33630, GES65144 and GSE76039. (D) IHC staining of c‐Myc in ATC tissue derived from Figure 1D. Scale bars, 200 μm. (E and F) qRT‐PCR (E) and WB (F) validated NSUN2 was down‐regulated upon c‐Myc knockdown in all ATC cell lines used in this article. (G) IHC staining of c‐Myc in tumours samples in xenograft mice model from Figure 4. Scale bars, 200 μm. (H) Three‐dimensional structure from AlphaFold (predicted) for c‐Myc protein. The blue part indicates very high model confidence (pLDDT > 90). The red dots indicate leucine encoded by TTG in c‐Myc protein. (I and J) Validation of c‐Myc knockdown and NSUN2 overexpression for rescue assay. (K and L) Transwell assay (K) and statistical analysis (L) showing that overexpression of NSUN2 partly rescued the decreased migration and invasion upon c‐Myc knockdown.
FIGURE 10
FIGURE 10
Depletion of NSUN2‐mediated m5C caused a decrease in tRNA and an increase in cleaved fragments. (A) A method for tRNA charging assay. (B) tRNA charging level of indicated isodecoder family was measured. Primers specific to Leu‐CAA and Leu‐CAG were used. (C) qRT‐PCR analysis of tRNA Leu‐CAA. (D) Relationship of tRNA related RNA fragments. (E) qRT‐PCR analysis of tRNA Leu related RNA fragments. (F) Correlation scatter plot showing that tRNA expression is positively associated with m5C modification at variable loop. (G) Comparison between tRNA Leu‐CAA isodecoders expression and m5C modification. The bubble size represents the proportion of tRNA Leu‐CAA isodecoders in vector cell. (H) Comparison between tRNA expression and m5C modification at variable loop. Each row represents the same tRNA isodecoder. (I) The 3D structure diagram shows the position of C48 (green dot) and TΨC loop/arm (red shaded part) in tRNA Leu‐CAA‐2‐1. The blue, red, white orange and grey sphere represents the nitrogen atom (N), oxygen atom (O), hydrogen atom (H), phosphorus atom (P) and the carbon atom (C). In the secondary structure of tRNA Leu‐CAA, short red line indicates the possible cleavage sites of tRNA after methylation deletion. (J) Working model for NSUN2 mediated tRNA m5C modification in regulation of ATC tumourigenesis. NSUN2 sustains tRNA stability by catalysing m5C modification and enhances translation in cancer.

References

    1. Kitahara CM, Sosa JA. Understanding the ever‐changing incidence of thyroid cancer. Nat Rev Endocrinol. 2020;16:617‐618. - PMC - PubMed
    1. Leboulleux S, Bournaud C, Chougnet CN, et al. Thyroidectomy without radioiodine in patients with low‐risk thyroid cancer. N Engl J Med. 2022;386:923‐932. - PubMed
    1. Wang W, Bai N, Li X. A critical analysis of the current TNM classification for differentiated thyroid carcinoma in young patients: time for a change? Front Endocrinol (Lausanne). 2022;13:939131. - PMC - PubMed
    1. Wirth LJ, Brose MS, Sherman EJ, et al. Open‐label, single‐arm, multicenter, phase II trial of lenvatinib for the treatment of patients with anaplastic thyroid cancer. J Clin Oncol. 2021;39:2359‐2366. - PMC - PubMed
    1. Wang W, Ouyang Q, Meng C, Jing L, Li X. Treatment optimization and prognostic considerations for primary squamous cell carcinoma of the thyroid. Gland Surg. 2019;8:683‐690. - PMC - PubMed

Publication types

MeSH terms

LinkOut - more resources