

Molecular view of ER membrane remodeling by the Sec61/TRAP translocon
- PMID: 37983950
- PMCID: PMC10702806
- DOI: 10.15252/embr.202357910
Molecular view of ER membrane remodeling by the Sec61/TRAP translocon
Abstract
Protein translocation across the endoplasmic reticulum (ER) membrane is an essential step during protein entry into the secretory pathway. The conserved Sec61 protein-conducting channel facilitates polypeptide translocation and coordinates cotranslational polypeptide-processing events. In cells, the majority of Sec61 is stably associated with a heterotetrameric membrane protein complex, the translocon-associated protein complex (TRAP), yet the mechanism by which TRAP assists in polypeptide translocation remains unknown. Here, we present the structure of the core Sec61/TRAP complex bound to a mammalian ribosome by cryogenic electron microscopy (cryo-EM). Ribosome interactions anchor the Sec61/TRAP complex in a conformation that renders the ER membrane locally thinner by significantly curving its lumenal leaflet. We propose that TRAP stabilizes the ribosome exit tunnel to assist nascent polypeptide insertion through Sec61 and provides a ratcheting mechanism into the ER lumen mediated by direct polypeptide interactions.
Keywords: cryo-EM; membrane proteins; protein translocation; secretory proteins; structural biology.
© 2023 The Authors. Published under the terms of the CC BY 4.0 license.
Conflict of interest statement
The authors declare that they have no conflict of interest.
Figures
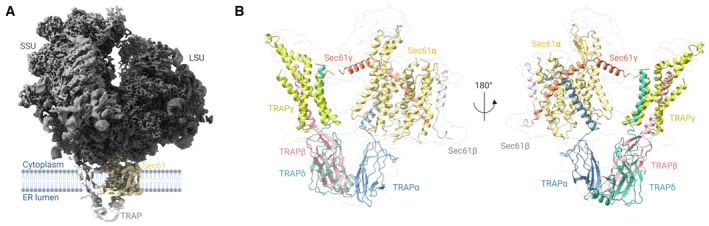
Density of the mammalian 80S ribosome/Sec61/TRAP complex obtained after locally filtering the homogenous refinement output map in cryoSPARC (sigma value: 0.6).
Close‐up of the Sec61/TRAP complex from the front (left) and back (right). Isolated complex subunits are shown for TRAPα (blue), TRAPβ (red), TRAPγ (yellow), and TRAPδ (green). Protein/ribosome structures were rendered with ChimeraX, and the schematics were created with
BioRender.com .
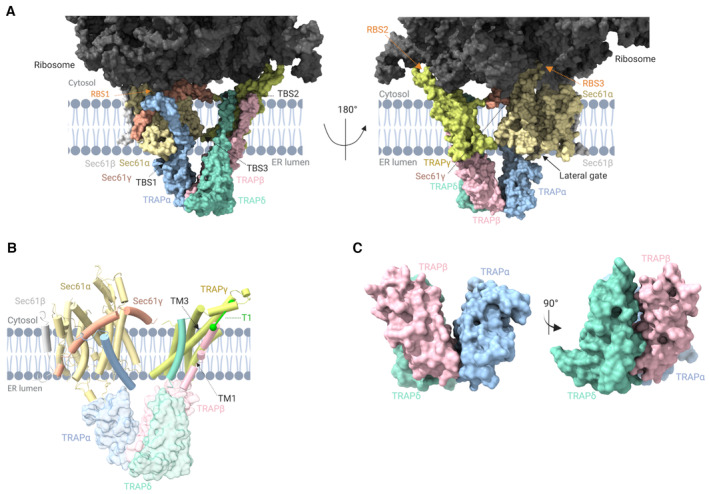
Overview of the Sec61/TRAP/ribosome complex structure highlighting the interaction sites of TRAP with ribosome (ribosome‐binding site, RBS1, RBS2, and RBS3, indicated with orange arrows) and TRAP with Sec61 complex (translocon‐binding site, TBS1, TBS2, and TBS3, indicated with black arrows).
Transmembrane domains of TRAPβ and TRAPδ interact with the transmembrane helices (TM1 and TM3) of TRAPγ to form a trimeric complex. TRAPα traverses the membrane diagonally away from the TRAPβ, TRAPδ, and TRAPγ complex and forms a connection with the backside of Sec61γ on the cytosolic part of Sec61. Identified interprotein crosslink T1 is indicated in green.
Formation of the trimeric TRAP complex among TRAPα, TRAPβ, and TRAPδ in the lumenal region of the ER. Data information: TRAP subunits colored as TRAPα:cyan, TRAPβ:pink, TRAPδ:green, and TRAPγ:yellow; Sec61 complex colored as Sec61α:light orange, Sec61β:gray, and Sec61γ:red. 28S rRNA in light green and 5.8S rRNA highlighted in green. All the ribosomal proteins are highlighted in different shades of gray color. Protein/ribosome structures were rendered with ChimeraX, and the schematics were created with
BioRender.com .
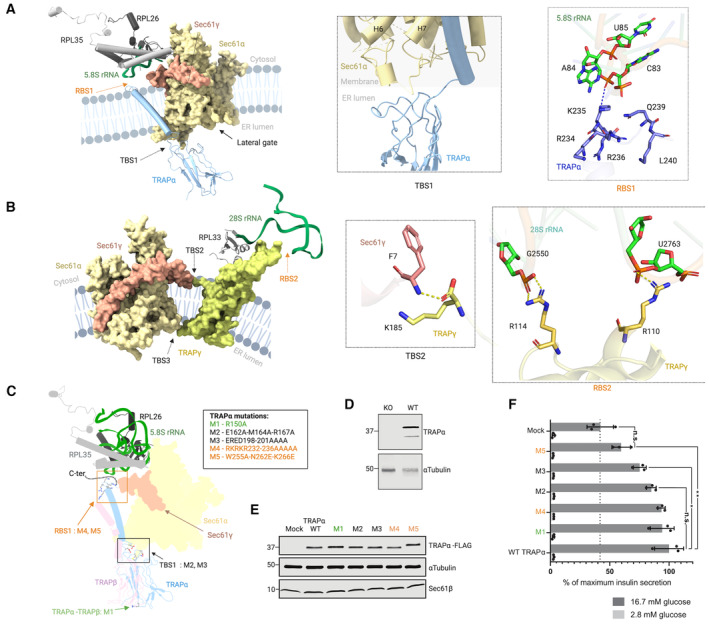
Interactions of TRAPα with Sec61α in the lumenal region (TBS1) and with the 5.8S ribosomal RNA in the cytoplasmic region (RBS1), TRAPα is color coded according to atom (nitrogen: blue, carbon: purple, oxygen: red) as is 5.8S ribosomal RNA (carbon: green, oxygen: red, and nitrogen: blue). Hydrogen bond is highlighted with the blue dashed line.
Interactions of Sec61γ with TRAPγ in the membrane region (TBS2), and TRAPγ with the 28S ribosomal RNA in the cytoplasmic region (RBS2), TRAPγ is color‐coded according to atom (nitrogen: blue, carbon: yellow, and oxygen: red) as is 28S ribosomal RNA (carbon: green, oxygen: red, and nitrogen: blue) and Sec61γ (nitrogen: blue, carbon: light red, and oxygen: red). Hydrogen bond is highlighted with yellow dashed line. Coloring of TRAP and Sec61 subunits and ribosomal proteins and RNA as in Fig 2.
TRAPα residues selected in the RBS1 site (M4 and M5), TBS1 site (M2 and M3), and in the dimer interface of TRAPα and TRAPβ (M1) for mutational study. The TRAPα C‐terminal end absent in the cryo‐EM structure is shown as dashed line.
Western blot analysis of wild‐type (WT) or TRAPα knock‐out (KO) INS‐1823/13 cells.
Western blot analysis of transient TRAPα‐FLAG‐expressing TRAPα knock‐out INS‐1823/13 cells.
Insulin secretion from INS‐1832/13 cells after glucose stimulation. TRAPα knock‐out INS‐1832/13 cells were transiently transfected with C‐terminally 3 × FLAG‐tagged wild‐type or mutant TRAPα‐encoding expression plasmids, and their insulin secretion was measured after stimulation with 2.8 or 16.7 mM glucose. Data are mean values ± SD from N = 3 independent experiments. Statistical significance was analyzed by unpaired T‐test, n.s. indicates no significant difference (P > 0.05). *P < 0.05. **P < 0.01.
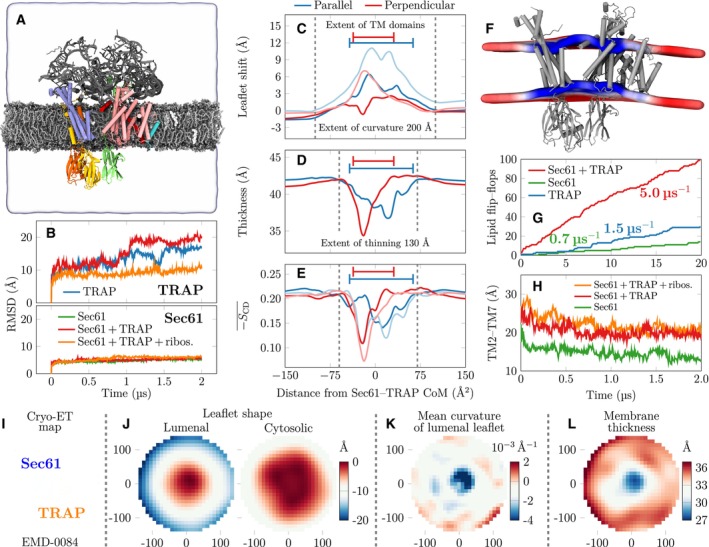
Snapshot of the initial conformation of the simulation system containing the Sec61/TRAP complex together with parts of the ribosome that interact with Sec61 or TRAP subunits. The distal parts of ribosome are restrained to model its large size without the need to model the entire ribosome. TRAP subunits are shown in green (TRAPα), yellow (TRAPβ), blue (TRAPγ), and orange (TRAPδ), whereas Sec61 subunits are shown in pink (Sec61α), cyan (Sec61β), or red (Sec61γ). The ribosomal proteins and RNA fragments included are drawn in gray. The lipids are shown in silver with gray head groups, and cholesterol in white. The extent of the simulation cell is highlighted by the transparent surface. The lipid hydrogens, water molecules, and ions are not rendered for clarity.
Root mean square deviation (RMSD) of the TRAP and Sec61 structures when simulated in different assemblies. Sec61 is always stable, yet TRAP conformation shows significant variations in the absence of ribosomal anchoring.
Quantitative characterization of membrane perturbations using g_lomepro (Gapsys et al, 2013). The vertical shift of the lipid phosphorus atoms. The profiles were calculated parallel to the axis connecting Sec61 and TRAP and perpendicular to it. Darker lines show the upper (cytosolic) leaflet and lighter ones the lower (lumenal) leaflet. The extent of the protein TM regions is highlighted.
Membrane thickness is calculated as the difference between the phosphorus profiles of the two leaflets in (C).
Local membrane ordering calculated as the average of the deuterium order parameters of carbons 2–15 in the palmitate chains of phospholipids.
The perturbation of the membrane in the simulation containing Sec61/TRAP anchored by the ribosome contacts. The average positions of the phosphorus atoms are shown by the colored surface cut at the protein location. The color depicts local thickness, ranging from 37 Å (blue) to 43 Å (red). Average of the protein‐free control simulation was 41.8 ± 0.6 Å.
Lipid flip–flops as a proxy to membrane perturbation and permeabilization. The cumulative POPC flip–flops in the coarse‐grained simulations. In simulations with individual TRAP subunits, no flip–flops were observed, but they are promoted by the bundle of TRAPβ, TRAPγ, and TRAPδ TM domains. Sec61 alone has a minor effect, but together with TRAP the lensing effect significantly accelerates flip–flops.
The distance of the lateral gate helices TM2 and TM7 in the atomistic simulations. The presence of TRAP seems to help maintain the gate in a more open conformation.
The section of the cryo‐ET map EMD‐0084 (Pfeffer et al, ; Martinez‐Sanchez et al, 2020) in the same orientation and positioning as panels (J–L) to highlight Sec61 and TRAP positioning.
Leaflet shapes are demonstrated by the height (color) with respect to the center that is set to 0. The cytosolic leaflet is mildly curved, corresponding to the overall microsome shape, and the height shows a change of ∼10 Å at a radial distance of ∼150 Å. The lumenal leaflet shows a change of ∼20 Å over the lateral distance of ∼150 Å, indicating a significant and localized curvature.
The cytosolic leaflet has localized negative mean curvature, which in the protein vicinity (within 40 Å from the center) corresponds to a radius of curvature of ∼320 Å, in line with our MD predictions. The local high curvature is absent in the cytosolic leaflet, and the average radius of curvature of 1,300 Å likely corresponds to a typical microsome size in the sample.
The local thickness shows significant membrane thinning from the average value of 34 to ∼29 Å in the protein vicinity.
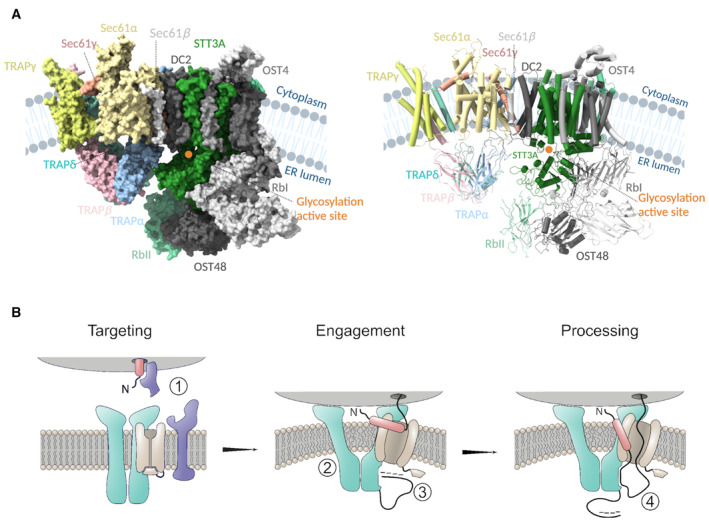
Cryo‐EM structure of our Sec61/TRAP complex and the structure of OST‐A (PDB ID: 6S7O) complex modeled in the cryo‐ET density of Sec61/TRAP and the OST complex (EMD‐3068), surface (right), and cartoon (left) representation. TRAP subunits colored as TRAPα:cyan, TRAPβ:pink, TRAPδ:green, and TRAPγ: yellow, and Sec61 complex colored as Sec61α:light orange, Sec61β:gray, and Sec61γ:red. Most of the OST subunits are colored in gray except STT3A and RbII which lie in proximity to the lumenal domains of the TRAP complex and are colored green and light green, respectively. The glycosylation active site of the STT3A domain is highlighted with an orange circle. Protein/ribosome structures were rendered with ChimeraX, and the schematics were created with
BioRender.com .Targeting of the ribosome–nascent chain complex (ribosome in gray, nascent chain's signal peptide in red, and its mature chain in black) is carried out by SRP and SRP receptor (in blue) (1). Docking of the ribosome induces a conformational change in the TRAP/Sec61 complex (TRAP in turquoise and Sec61 in light brown), resulting in membrane perturbation which increases the fluidity of the local lipid environment about the Sec61 lateral gate (2). After successful lateral gate engagement and plug displacement, nascent polypeptide is exposed to the ER lumen, where transient interactions with the negatively charged TRAPα flexible N‐terminal loop (in black) may encourage correct topology and complete lateral gate intercalation of the signal peptide (3). The TRAPα lumenal domain is proximal to the lumenal exit of Sec61, and it may directly bind the nascent polypeptide, serving to prevent back diffusion of translocation inefficient polypeptide sequences (4). Finally, interaction with TRAPα lumenal domain may also serve to transiently restrict the nascent polypeptide for presentation to downstream processing events.
References
-
- Amidror I (2002) Scattered data interpolation methods for electronic imaging systems: a survey. J Electron Imaging 11: 157–176
-
- Claxton D (2022) Surface curvature. https://www.mathworks.com/matlabcentral/fileexchange/11168‐surface‐curva.... [Online; Accessed November 30, 2022]
MeSH terms
Substances
Associated data
- Actions
Grants and funding
LinkOut - more resources
Full Text Sources
Research Materials
