

RZZ-Spindly and CENP-E form an integrated platform to recruit dynein to the kinetochore corona
- PMID: 37984321
- PMCID: PMC10711656
- DOI: 10.15252/embj.2023114838
RZZ-Spindly and CENP-E form an integrated platform to recruit dynein to the kinetochore corona
Abstract
Chromosome biorientation on the mitotic spindle is prerequisite to errorless genome inheritance. CENP-E (kinesin-7) and dynein-dynactin (DD), microtubule motors with opposite polarity, promote biorientation from the kinetochore corona, a polymeric structure whose assembly requires MPS1 kinase. The corona's building block consists of ROD, Zwilch, ZW10, and the DD adaptor Spindly (RZZS). How CENP-E and DD are scaffolded and mutually coordinated in the corona remains unclear. Here, we show that when corona assembly is prevented through MPS1 inhibition, CENP-E is absolutely required to retain RZZS at kinetochores. An RZZS phosphomimetic mutant bypasses this requirement, demonstrating the existence of a second receptor for polymeric RZZS. With active MPS1, CENP-E is dispensable for corona expansion, but strictly required for physiological kinetochore accumulation of DD. Thus, we identify the corona as an integrated scaffold where CENP-E kinesin controls DD kinetochore loading for coordinated bidirectional transport of chromosome cargo.
Keywords: CENP-E; centromere; kinetochore fibrous corona; mitosis; spindle assembly checkpoint.
© 2023 The Authors. Published under the terms of the CC BY 4.0 license.
Conflict of interest statement
The authors declare that they have no conflict of interest.
Figures
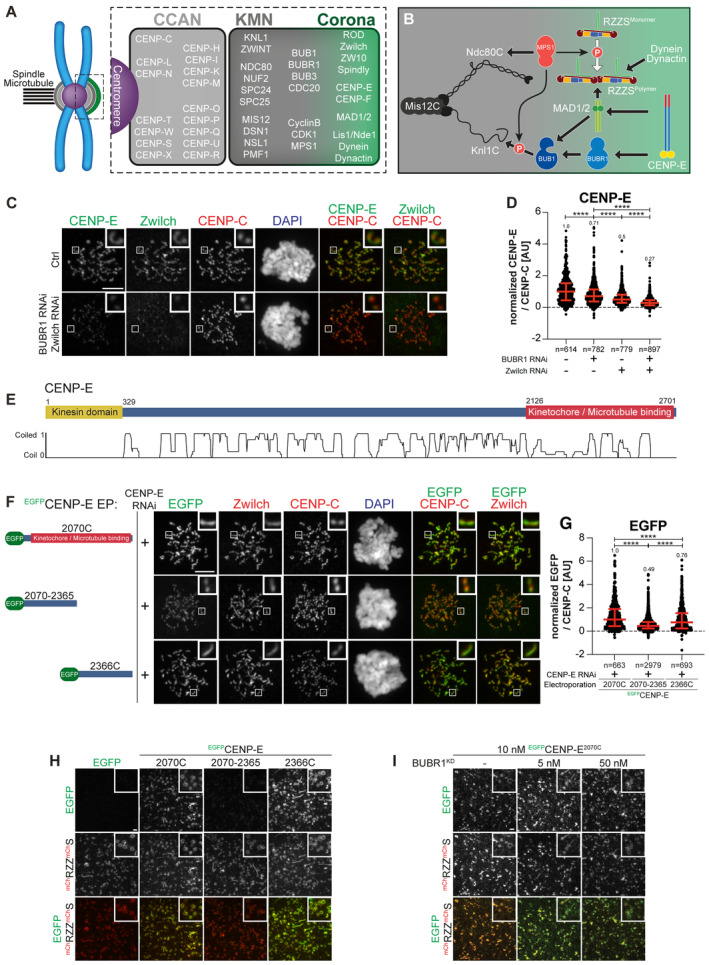
Organization of the human kinetochore and corona.
Drawing depicting the hierarchical organization of outer kinetochore and kinetochore corona components. Thick arrows indicate the recruitment of a protein to the protein indicated by the arrowhead. Thin arrows indicate phosphorylation. The white arrow indicates polymerization.
Representative images of the localization of CENP‐E after depletion of Zwilch and BUBR1 in HeLa cells. Zwilch RNAi treatment was performed with 100 nM siRNA for 72 h. Following 48 h after Zwilch RNAi treatment cells were transfected with 100 nM BUBR1 siRNA. Following 8 h after transfection, cells were synchronized in the G2 phase with 9 μM RO3306 for 15 h and then released into mitosis. Subsequently, cells were immediately treated with 3.3 μM Nocodazole, 10 μM MG132 for an additional hour. CENP‐C was used to visualize kinetochores and DAPI to stain DNA. Three biological replicates were performed. Scale bar: 5 μm.
Quantification of CENP‐E levels at kinetochores of the experiment shown in panel C. n refers to individually measured kinetochores.
Organization of CENP‐E with coiled‐coil prediction.
Representative images showing the localization of different EGFPCENP‐E constructs in prometaphase after depletion of CENP‐E with 60 nM siRNA. 13 h after RNAi treatment HeLa cells were electroporated with electroporation buffer or recombinant EGFPCENP‐E constructs as indicated. Following an 8 h recovery, cells were synchronized in the G2 phase with 9 μM RO3306 for 15 h and then released into mitosis. Subsequently, cells were immediately treated with 3.3 μM Nocodazole for an additional hour. CENP‐C was used to visualize kinetochores and DAPI to stain DNA. Three biological replicates were performed. Scale bar: 5 μm.
Quantification of EGFP levels at kinetochores of the experiment shown in panel F. n refers to individually measured kinetochores.
mCHRZZmChS ring‐binding assays showing the recruitment of various EGFPCENP‐E truncations (10 nM concentration) to mCHRZZmChS rings (approximately 40 nM concentration). The experiment was performed once. Scale bar: 5 μm.
RZZS ring‐binding assays showing the recruitment of EGFPCENP‐E2070C to mCHRZZmChS rings is unaffected by increasing concentrations of BUBR1KD. The experiment was performed once. Scale bar: 5 μm.
- A, B
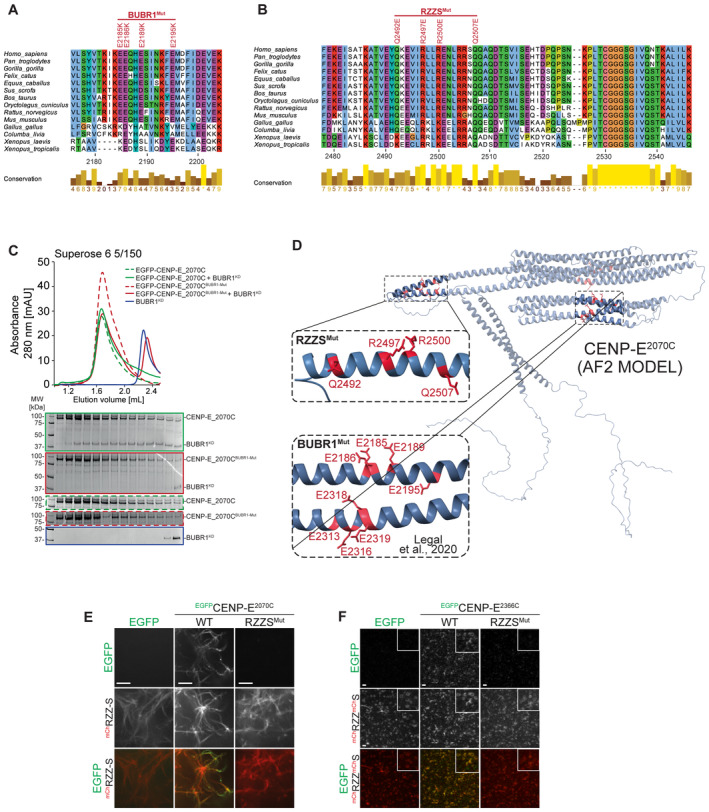
Multiple sequence alignment showing the kinetochore binding region of CENP‐E was generated in Jalview with the MAFFT algorithm. Residues are depicted according to CLUSTAL color code. Amino acid substitutions comprised in the BUBR1Mut and RZZSMut are labeled in red above the sequence alignment.
- C
Analytical SEC binding assays between the BUBR1 kinase domain (KD) and different EGFPCENP‐E2070C constructs. The complex run is represented as a continuous line, and the individual CENP‐E constructs with a dashed line. BUBR1: 8 μM, CENP‐E constructs: 16 μM. The experiment was performed once.
- D
AF2 Multimer model of CENP‐E2070C. Insets show the BUBR1Mut and RZZSMut (a previously published BUBR1Mut) (Legal et al, 2020) and surrounding sequence. The main chain is depicted in blue, and mutated residues in red.
- E
RZZS filament‐binding assay showing recruitment of EGFPCENP‐E2070C constructs to mChRZZS filaments. Scale bar: 5 μm. The experiment was performed once.
- F
RZZS ring‐binding assay showing recruitment of EGFPCENP‐E2070C constructs to mCHRZZmChS rings. The experiment was performed once. Scale bar: 5 μm.
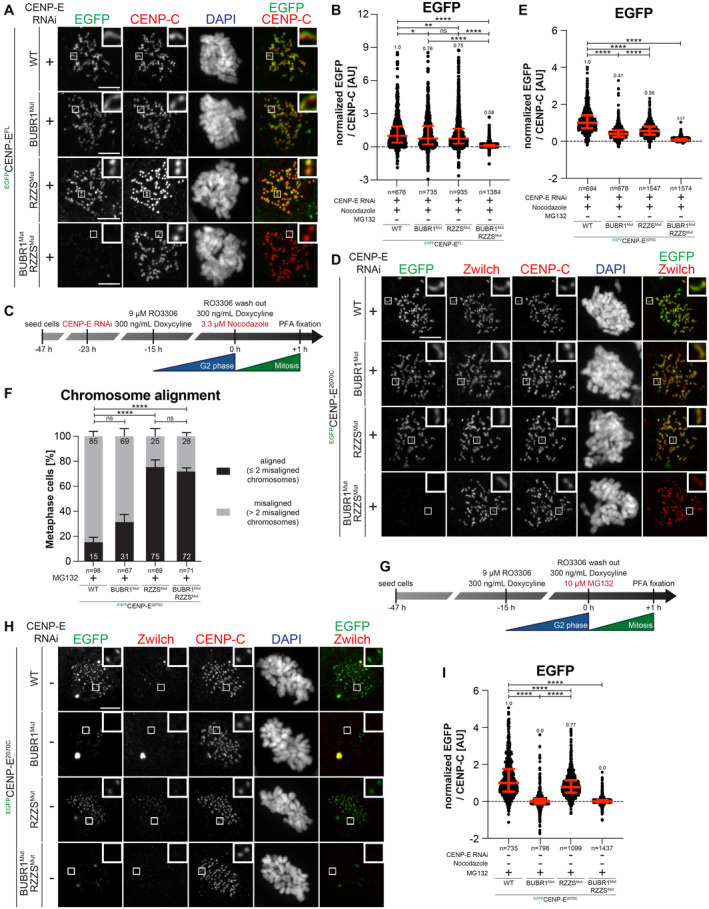
Representative images showing the localization of different EGFPCENP‐EFL constructs in stable DLD‐1 cell lines arrested in prometaphase. CENP‐E RNAi treatment was performed for 24 h with 60 nM siRNA. 8 h after RNAi treatment protein expression was induced through the addition of 10 ng/ml doxycycline and cells were synchronized in the G2 phase with 9 μM RO3306 for 15 h and then released into mitosis. Subsequently, cells were immediately treated with 3.3 μM Nocodazole and 10 ng/ml doxycycline for an additional hour. CENP‐C was used to visualize kinetochores and DAPI to stain DNA. Three biological replicates were performed. Scale bar: 5 μm.
Quantification of EGFP levels at the kinetochores of the experiment shown in panel A. n refers to individually measured kinetochores.
Schematic representation of the experimental scheme used for panels D and E.
Representative images showing the localization of different EGFPCENP‐E2070C mutants in stable DLD‐1 cell lines arrested in prometaphase. CENP‐E RNAi treatment was performed for 24 h with 60 nM siRNA. Eight hours after RNAi treatment, protein expression was induced through the addition of 300 ng/ml doxycycline and cells were synchronized in the G2 phase with 9 μM RO3306 for 15 h and then released into mitosis. Subsequently, cells were immediately treated with 3.3 μM Nocodazole and 300 ng/ml doxycycline for an additional hour. CENP‐C was used to visualize kinetochores and DAPI to stain DNA. Three biological replicates were performed. Scale bar: 5 μm.
Quantification of EGFP levels at the kinetochores of the experiment shown in panel D. n refers to individually measured kinetochores.
Chromosome alignment analysis of stable DLD‐1 cell lines expressing different EGFPCENP‐E2070C constructs. Before fixation, cells were synchronized in the G2 phase with 9 μM RO3306 for 15 h and then released into mitosis. Subsequently, cells were immediately treated with 10 μM MG132 for 2 h. n refers to the number of analyzed metaphase cells. Two biological replicates were performed.
Schematic representation of the experimental scheme used for panels H and I.
Representative images showing the localization of different EGFPCENP‐E2070C mutants in stable DLD‐1 cell lines arrested in metaphase. Thirty‐two hours after cells were seeded, protein expression was induced through the addition of 300 ng/ml doxycycline and cells were synchronized in the G2 phase with 9 μM RO3306 for 15 h and then released into mitosis. Subsequently, cells were immediately treated with 10 μM MG132 and 300 ng/ml doxycycline for 2 h. CENP‐C was used to visualize kinetochores and DAPI to stain DNA. Three biological replicates were performed. Scale bar: 5 μm.
Quantification of EGFP levels at kinetochores of the experiment shown in panel H. n refers to individually measured kinetochores.
- A
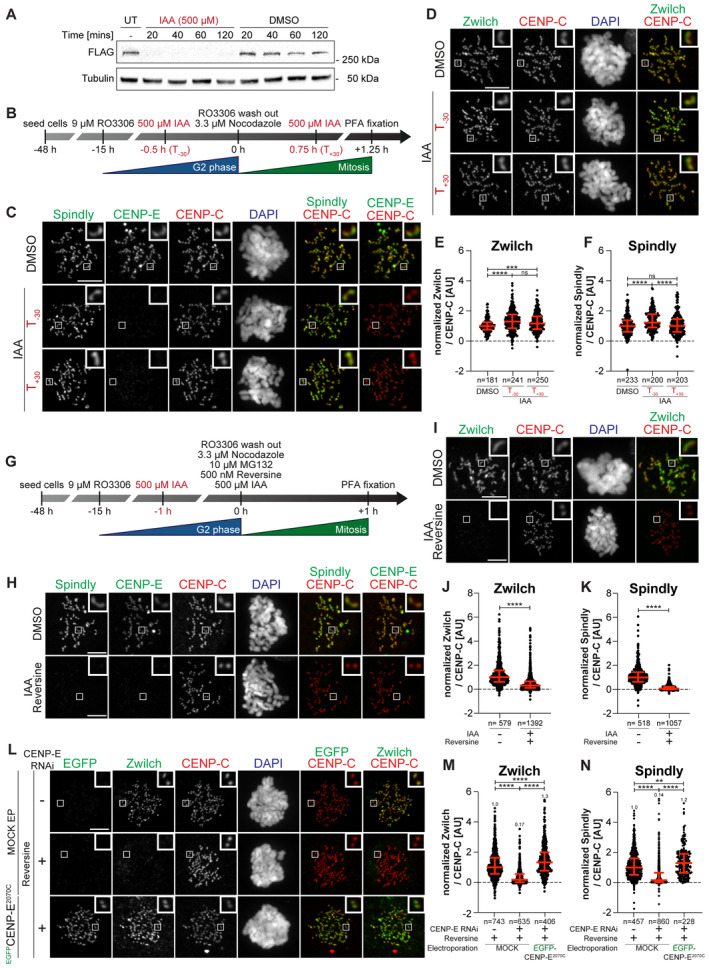
Immunoblot of mitotic RPE‐1 cells showing the levels of endogenous CENP‐EAID_3xFLAG treated with 500 μM IAA for the indicated duration. A quantity of 50 μg of cleared lysate was used for each condition, and Tubulin is shown as a loading control. The experiment was performed once.
- B
Schematic representation of the cell synchronization protocols for the experiment in panels C–F.
- C, D
Representative images showing the effect of degrading CENP‐EAID in RPE‐1 cells before or after mitotic entry, as shown in panel B. Before fixation, cells were synchronized in the G2 phase with 9 μM RO3306, released into mitosis and immediately treated with 3.3 μM Nocodazole. Cells were treated either 30 min before or 45 min after mitotic entry with 500 μM IAA. CENP‐C was used to visualize kinetochores and DAPI to stain DNA. Three biological replicates were performed. Scale bar: 5 μm. The mount is part of a larger experiment in which MAD1 was also visualized (displayed in Fig EV2H; omitted here). Therefore, the images in the CENP‐C and DAPI channels are duplicates of those shown in Fig EV2H (where Zwilch was omitted).
- E, F
Quantification of kinetochore levels of Zwilch and Spindly in cells depleted of the endogenous CENP‐E as shown in panels C and D. n refers to individually measured kinetochores.
- G
Schematic representation of the cell synchronization protocol for the experiment shown in panels H–K.
- H, I
Representative images showing the effects of degrading CENP‐EAID in RPE‐1 cells before mitotic entry, as shown in panel G. Before fixation, cells were synchronized in the G2 phase with 9 μM RO3306, released into mitosis and immediately treated with 3.3 μM Nocodazole, 10 μM MG132, 500 μM IAA and 500 nM reversine. Three biological replicates were performed. Scale bar: 5 μm.
- J, K
Quantification of kinetochore levels of Zwilch and Spindly in cells degraded of the endogenous CENP‐E and treated with reversine as shown in panels H and I. n refers to individually measured kinetochores.
- L
Representative images showing the localization of Zwilch in prometaphase after depletion of CENP‐E with 60 nM siRNA. Thirteen hours after RNAi treatment, HeLa cells were electroporated with electroporation buffer or EGFPCENP‐E2070C. Following an 8 h recovery, cells were synchronized in the G2 phase with 9 μM RO3306 for 15 h and then released into mitosis. Subsequently, cells were immediately treated with 3.3 μM Nocodazole, 10 μM MG132 and, where indicated, with 500 nM reversine, for an additional hour. CENP‐C was used to visualize kinetochores and DAPI to stain DNA. Three biological replicates were performed. Scale bar: 5 μm.
- M, N
Quantification of Zwilch and Spindly levels at kinetochores of the experiment shown in panel L.
- A
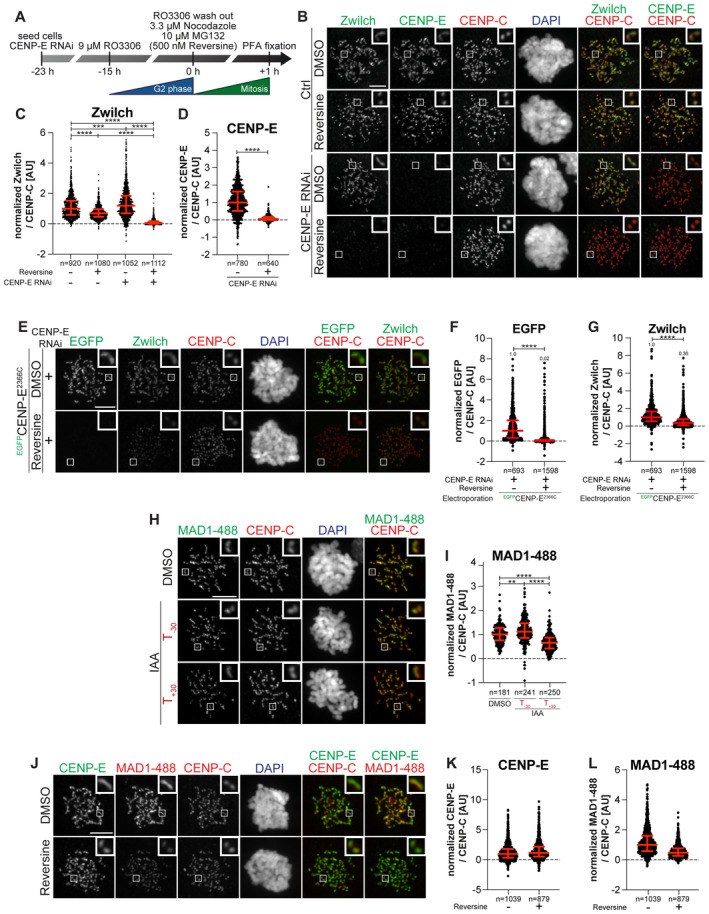
Schematic of the cell synchronization and imaging experiment shown in panel B.
- B
Representative images showing the localization of Zwilch in prometaphase after depletion of CENP‐E with 60 nM siRNA. Eight hours after RNAi treatment, HeLa cells were synchronized in the G2 phase with 9 μM RO3306 for 15 h and then released into mitosis. Subsequently, cells were immediately treated with 3.3 μM Nocodazole, 10 μM MG132 and, where indicated, with 500 nM reversine, for an additional hour. CENP‐C was used to visualize kinetochores and DAPI to stain DNA. Three biological replicates were performed. Scale bar: 5 μm.
- C, D
Quantification of Zwilch and CENP‐E levels at kinetochores of the experiment shown in panel B. n refers to individually measured kinetochores.
- E
Representative images showing the localization of Zwilch in prometaphase after depletion of CENP‐E with 60 nM siRNA. Thirteen hours after RNAi treatment HeLa cells were electroporated with electroporation buffer or EGFPCENP‐E2366C. Following an 8 h recovery, cells were synchronized in the G2 phase with 9 μM RO3306 for 15 h and then released into mitosis. Subsequently, cells were immediately treated with 3.3 μM Nocodazole, 10 μM MG132 and, where indicated, with 500 nM reversine, for an additional hour. CENP‐C was used to visualize kinetochores and DAPI to stain DNA. Three biological replicates were performed. Scale bar: 5 μm. The DMSO control in the upper raw is duplicated in Appendix Fig S2F.
- F, G
Quantification of EGFP and Zwilch levels at kinetochores of the experiment shown in panel E. n refers to individually measured kinetochores.
- H
Representative images showing the localization of MAD1 in RPE‐1 CENP‐EAID_3xFLAG cells treated as shown in Fig 3B. This mount is part of a larger experiment in which Zwilch was also visualized (in Fig 3D; omitted here). Therefore, the images in the CENP‐C and DAPI channels are duplicates of those shown in Fig 3D, where MAD1 was instead omitted.
- I
Quantification of MAD1 levels at kinetochores of the experiment shown in panel H. n refers to individually measured kinetochores.
- J
Representative images showing the localization of MAD1 after inhibition of MPS1. Thirty‐two hours after seeding, HeLa cells were synchronized in the G2 phase with 9 μM RO3306 for 15 h and then released into mitosis. Subsequently, cells were immediately treated with 3.3 μM Nocodazole, 10 μM MG132 and, where indicated, with 500 nM reversine, for an additional hour. CENP‐C was used to visualize kinetochores and DAPI to stain DNA. Three biological replicates were performed. Scale bar: 5 μm.
- K, L
Quantification of CENP‐E and MAD1 levels at kinetochores of the experiment shown in panel J. n refers to individually measured kinetochores. Red bars represent the median and interquartile range.
- A
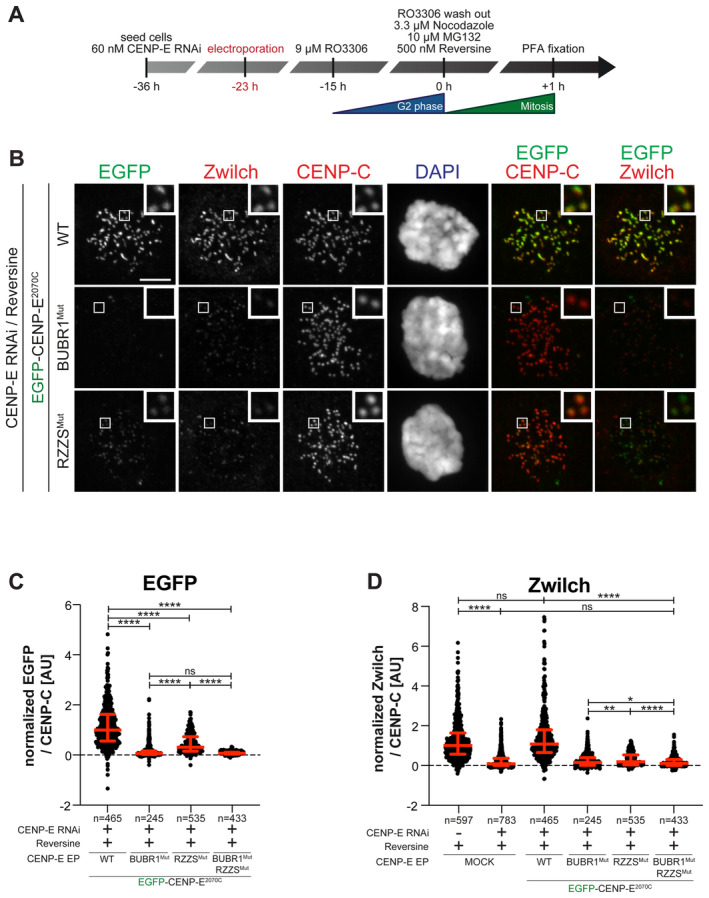
Schematic representation of the cell synchronization protocols for the experiment in panel B.
- B
Representative images showing the localization of different EGFPCENP‐E2070C constructs in prometaphase after depletion of CENP‐E with 60 nM siRNA. Thirteen hours after RNAi treatment cells were electroporated with recombinant EGFPCENP‐E2070C constructs as indicated. Following an 8 h recovery, cells were synchronized in the G2 phase with 9 μM RO3306 for 15 h and then released into mitosis. Subsequently, cells were immediately treated with 3.3 μM Nocodazole, 10 μM MG132 and, where indicated, with 500 nM reversine, for an additional hour. CENP‐C was used to visualize kinetochores and DAPI to stain DNA. The experiment was performed once. Scale bar: 5 μm.
- C, D
Quantification of EGFP and Zwilch levels at kinetochores of the experiment shown in panel B. n refers to individually measured kinetochores.
- A
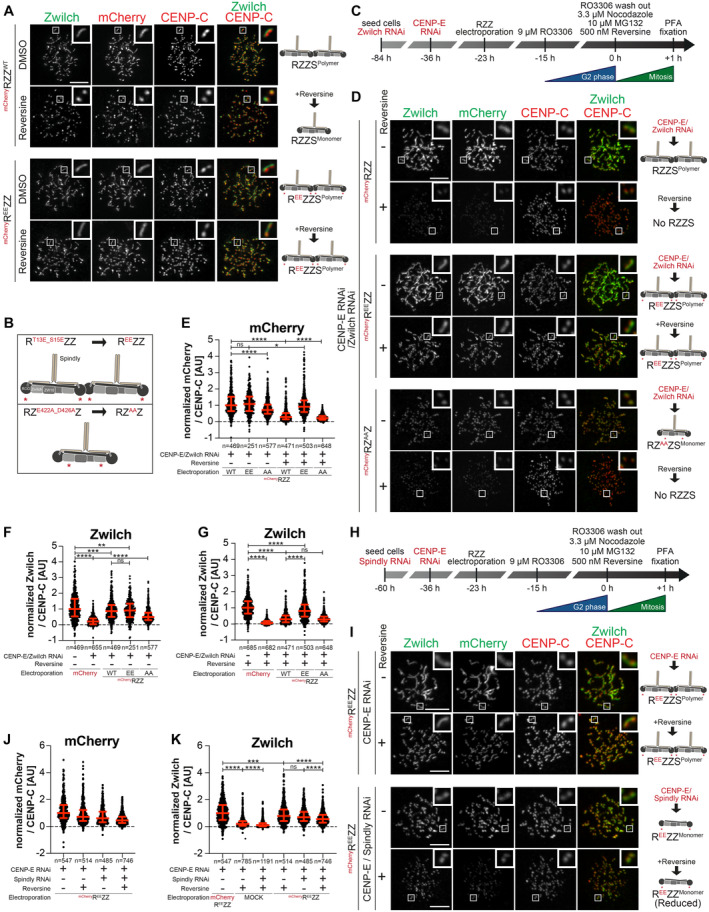
Representative images showing HeLa cells electroporated with the indicated mChRZZ constructs. Before fixation, cells were synchronized in the G2 phase with 9 μM RO3306 for 15 h and then released into mitosis. Subsequently, cells were immediately treated with 3.3 μM Nocodazole, 10 μM MG132 and, where indicated, with 500 nM reversine, for an additional hour. CENP‐C was used to visualize the kinetochores and DAPI to stain DNA. Three biological replicates were performed. Scale bar: 5 μm.
- B
A schematic of the mChRZZ constructs utilized in panel D.
- C
A schematic of the cell synchronization and imaging experiment shown in panels D–G.
- D
Representative images showing the localization of Zwilch in prometaphase after depletion of CENP‐E with 60 nM siRNA and Zwilch with 100 nM siRNA as shown schematically in panel C. Thirteen hours after CENP‐E RNAi treatment HeLa cells were electroporated with mCherry or different mChRZZ constructs as indicated. Following an 8 h recovery, cells were synchronized in the G2 phase with 9 μM RO3306 for 15 h and then released into mitosis. Subsequently, cells were immediately treated with 3.3 μM Nocodazole, 10 μM MG132 and, where indicated, with 500 nM reversine, for an additional hour. CENP‐C was used to visualize kinetochores and DAPI to stain DNA. Three biological replicates were performed. Scale bar: 5 μm.
- E–G
Quantification of mCherry and Zwilch levels at kinetochores of the experiment shown in panel D. n refers to individually measured kinetochores.
- H
A schematic of the cell synchronization and imaging experiment shown in panels I–K.
- I
Representative images showing the localization of Zwilch in prometaphase after depletion of CENP‐E with 60 nM siRNA and Spindly with 50 nM siRNA as shown schematically in panel H. Thirteen hours after CENP‐E RNAi treatment HeLa cells were electroporated with electroporation buffer or mChREEZZ. Following an 8 h recovery, cells were synchronized in the G2 phase with 9 μM RO3306 for 15 h and then released into mitosis. Subsequently, cells were immediately treated with 3.3 μM Nocodazole, 10 μM MG132 and, where indicated, with 500 nM reversine, for an additional hour. CENP‐C was used to visualize kinetochores and DAPI to stain DNA. Two biological replicates were performed. Scale bar: 5 μm.
- J, K
Quantification of mCherry and Zwilch levels at kinetochores of the experiment shown in panel I. n refers to individually measured kinetochores.
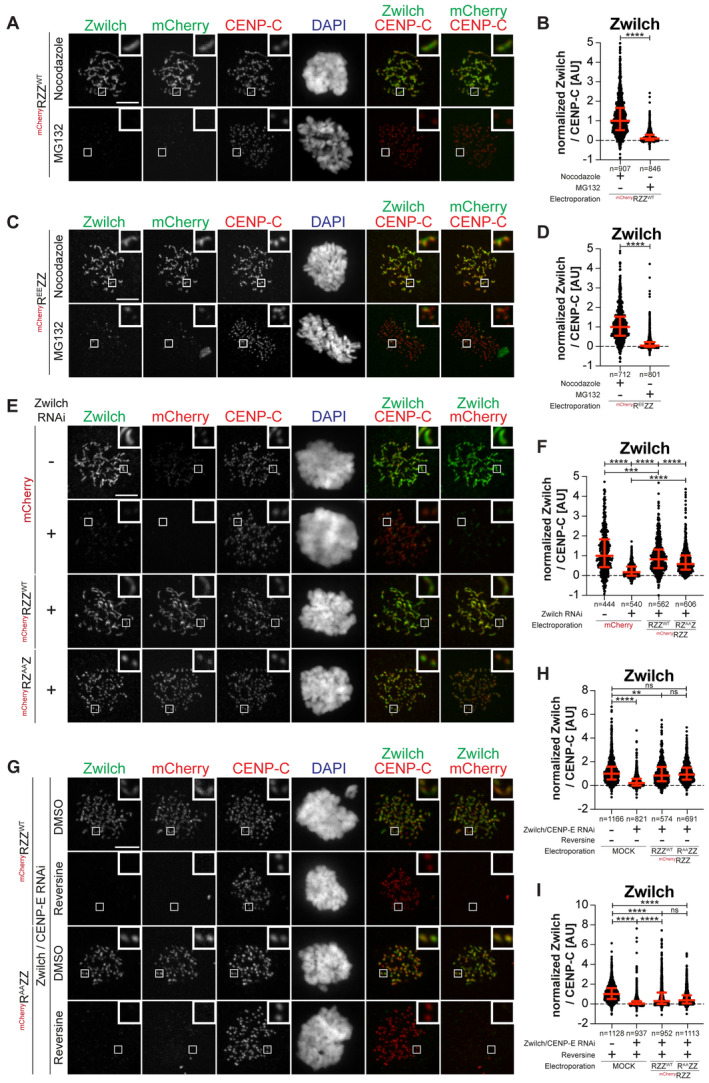
- A
Representative images showing HeLa cells electroporated with the indicated mChRZZ construct. Before fixation, cells were synchronized in the G2 phase with 9 μM RO3306 for 15 h and then released into mitosis. Subsequently, cells were immediately treated with 10 μM MG132 for an additional hour. CENP‐C was used to visualize kinetochores and DAPI to stain DNA. Three biological replicates were performed. Scale bar: 5 μm.
- B
Quantification of Zwilch levels at kinetochores of the experiment shown in panel A. n refers to individually measured kinetochores.
- C
Representative images showing HeLa cells treated as in panel A.
- D
Quantification of Zwilch levels at kinetochores of the experiment shown in panel C. n refers to individually measured kinetochores.
- E
Representative images showing the localization of the indicated mChRZZ constructs in prometaphase after depletion of Zwilch with 100 nM. Sixty‐one hours after Zwilch RNAi treatment HeLa cells were electroporated with mCherry or different mChRZZ constructs as indicated. Following an 8 h recovery, cells were synchronized in the G2 phase with 9 μM RO3306 for 15 h and then released into mitosis. Subsequently, cells were immediately treated with 3.3 μM Nocodazole for an additional hour. CENP‐C was used to visualize kinetochores and DAPI to stain DNA. Three biological replicates were performed. Scale bar: 5 μm.
- F
Quantification of Zwilch levels at kinetochores of the experiment shown in panel E. n refers to individually measured kinetochores.
- G
Representative images showing the localization of the indicated mChRZZ constructs in prometaphase after depletion of CENP‐E with 60 nM siRNA and Zwilch with 100 nM, as shown in (Fig 4C). Thirteen hours after CENP‐E RNAi treatment HeLa cells were electroporated with different mChRZZ constructs as indicated. Following an 8 h recovery, cells were synchronized in the G2 phase with 9 μM RO3306 for 15 h and then released into mitosis. Subsequently, cells were immediately treated with 3.3 μM Nocodazole, 10 μM MG132 and, where indicated, with 500 nM reversine, for an additional hour. CENP‐C was used to visualize kinetochores and DAPI to stain DNA. Two biological replicates were performed. Scale bar: 5 μm.
- H, I
Quantification of Zwilch levels at kinetochores of the experiment shown in panel G. n refers to individually measured kinetochores.
- A
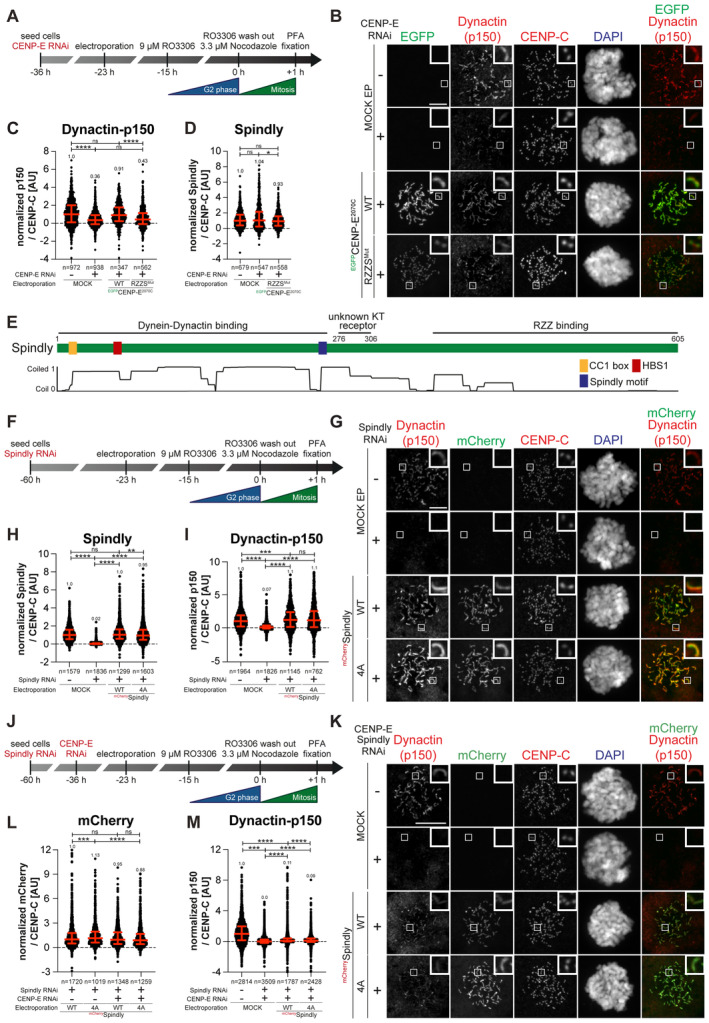
A schematic representation of the cell synchronization protocols for the experiment in panels B–D.
- B
Representative images showing the localization of dynactin monitored through the p150glued subunit after depletion of CENP‐E with 60 nM siRNA. Thirteen hours after RNAi treatment HeLa cells were electroporated with electroporation buffer or recombinant EGFPCENP‐E2070C constructs as indicated. Following an 8 h recovery, cells were synchronized in the G2 phase with 9 μM RO3306 for 15 h and then released into mitosis. Subsequently, cells were immediately treated with 3.3 μM Nocodazole for an additional hour. CENP‐C was used to visualize kinetochores and DAPI to stain DNA. Three biological replicates were performed. Scale bar: 5 μm.
- C, D
Quantification of dynactin‐p150glued and Spindly levels at kinetochores of the experiment shown in panel B. n refers to individually measured kinetochores.
- E
A schematic representation of the organization of Spindly and relevant coiled‐coil prediction.
- F
A schematic representation of the cell synchronization protocols for the experiment in panels G–I.
- G
Representative images showing the localization of dynactin monitored through the p150glued subunit after depletion of Spindly with 50 nM siRNA. Thirty‐seven hours after RNAi treatment, HeLa cells were electroporated with electroporation buffer or recombinant mChSpindly constructs as indicated. Following an 8 h recovery, cells were synchronized in the G2 phase with 9 μM RO3306 for 15 h and then released into mitosis. Subsequently, cells were immediately treated with 3.3 μM Nocodazole for an additional hour. CENP‐C was used to visualize kinetochores and DAPI to stain DNA. Three biological replicates were performed. Scale bar: 5 μm.
- H, I
Quantification of Spindly and dynactin‐p150glued levels at kinetochores of the experiment shown in panel G. n refers to individually measured kinetochores.
- J
A schematic representation of the cell synchronization protocols for the experiment in panels K–M.
- K
Representative images showing the localization of dynactin monitored through the p150glued subunit after depletion of CENP‐E with 60 nM siRNA and Spindly with 50 nM siRNA. Thirteen hours after CENP‐E RNAi treatment HeLa cells were electroporated with electroporation buffer or recombinant mChSpindly constructs as indicated. Following an 8 h recovery, cells were synchronized in the G2 phase with 9 μM RO3306 for 15 h and then released into mitosis. Subsequently, cells were immediately treated with 3.3 μM Nocodazole for an additional hour. CENP‐C was used to visualize kinetochores and DAPI to stain DNA. Three biological replicates were performed. Scale bar: 5 μm.
- L, M
Quantification of mCherry and dynactin‐p150glued levels at kinetochores of the experiment shown in panel K. n refers to individually measured kinetochores.
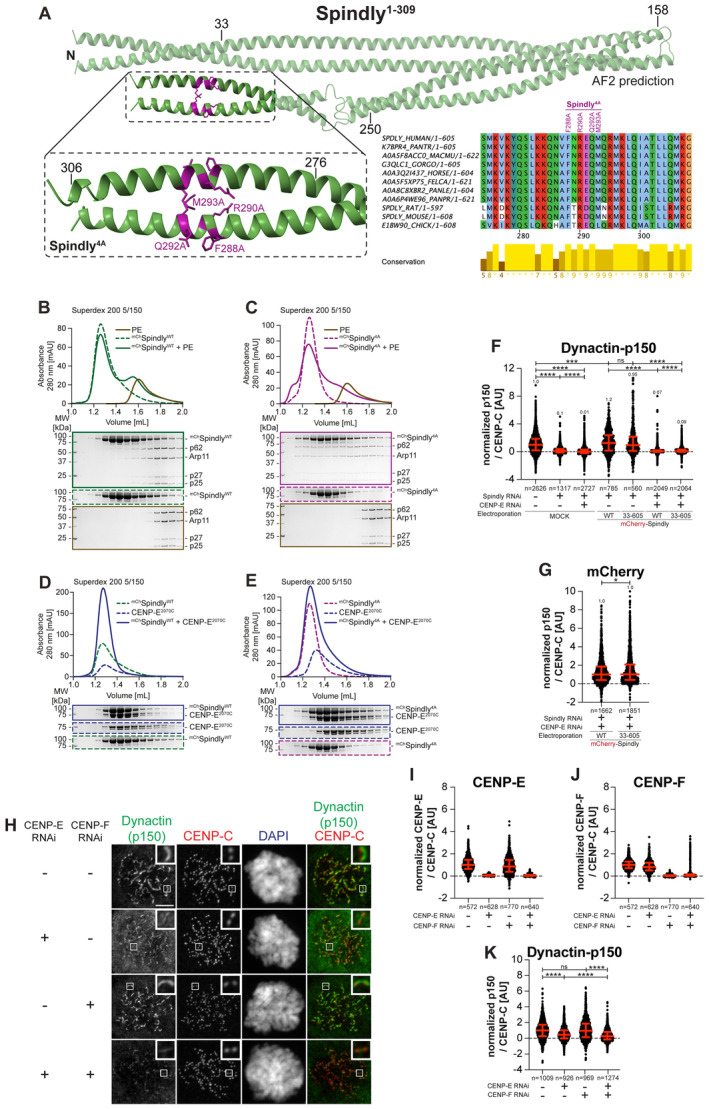
- A
AF2 Multimer model of Spindly1–309 (d'Amico et al, 2022) and multiple sequence alignment showing the CC2 region of Spindly was generated in Jalview. Residues are depicted according to CLUSTAL color code. Amino acid substitutions mutated in the Spindly4A construct are labeled in magenta above the sequence alignment. The inset in the AF2 model shows amino acids 275–306 of Spindly and surrounding sequence. The main chain is depicted in green and mutated residues in magenta.
- B, C
Analytical SEC binding assays between the dynactin‐PE (brown) and mChSpindly constructs. The complex run is represented as a continuous line, and the individual Spindly constructs with a dashed line. PE: 3 μM, Spindly constructs: 16 μM. The control gels with dynactin‐PE alone are shared between panels B and C. The experiment was performed twice.
- D, E
Analytical SEC binding assays between the CENP‐E2070C and mChSpindly constructs. The complex run is represented as continuous line and the individual constructs with a dashed line. CENP‐E: 20 μM, Spindly constructs: 16 μM. The control gels with mChSpindly4A alone are shared between panels C and E. The experiment was performed twice.
- F, G
Quantification of dynactin‐p150glued and mCherry levels at kinetochores after depletion of CENP‐E with 60 nM siRNA and Spindly with 50 nM siRNA. Thirteen hours after CENP‐E RNAi treatment cells were electroporated with electroporation buffer or recombinant mChSpindly constructs as indicated. Following an 8 h recovery, cells were synchronized in the G2 phase with 9 μM RO3306 for 15 h and then released into mitosis. Subsequently, cells were immediately treated with 3.3 μM Nocodazole for an additional hour. n refers to individually measured kinetochores.
- H
Representative images showing the localization of dynactin monitored through the p150glued subunit after depletion of CENP‐E with 60 nM siRNA and CENP‐F with 50 nM. Eight hours after RNAi treatment, HeLa cells were synchronized in the G2 phase with 9 μM RO3306 for 15 h and then released into mitosis. Subsequently, cells were immediately treated with 3.3 μM Nocodazole for an additional hour. CENP‐C was used to visualize kinetochores and DAPI to stain DNA. Three biological replicates were performed. Scale bar: 5 μm.
- I–K
Quantification of CENP‐E, CENP‐F and dynactin‐p150glued levels at kinetochores of the experiment shown in panel H. n refers to individually measured kinetochores.
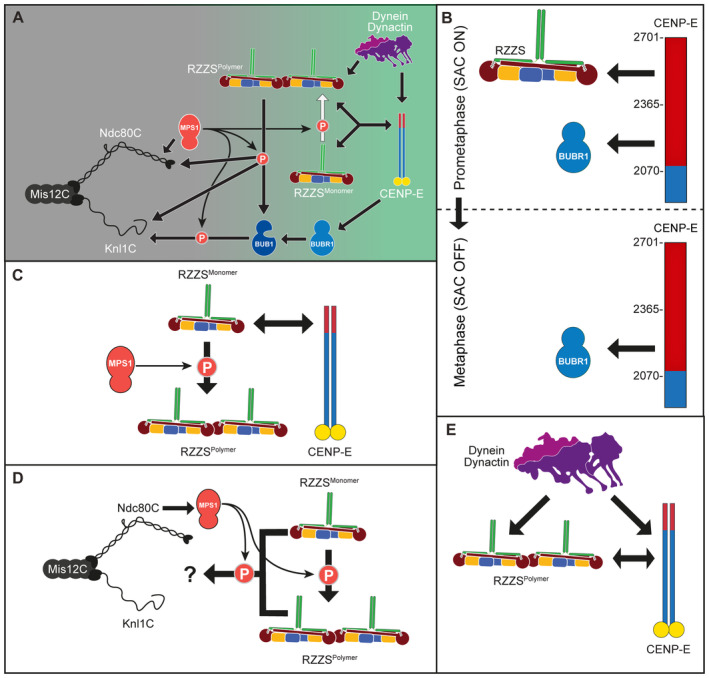
- A
Revised drawing depicting the hierarchical organization of outer kinetochore and kinetochore corona components after our study. Compare with Fig 1B. Thick arrows indicate recruitment of a protein to the protein indicated by the arrowhead. Thin arrows indicate phosphorylation. The white arrow indicates polymerization.
- B–E
Depiction of individual interactions in the order in which they are presented in the “Discussion” section.
References
-
- Akera T, Goto Y, Sato M, Yamamoto M, Watanabe Y (2015) Mad1 promotes chromosome congression by anchoring a kinesin motor to the kinetochore. Nat Cell Biol 17: 1124–1133 - PubMed
Publication types
MeSH terms
Substances
Grants and funding
LinkOut - more resources
Full Text Sources
Research Materials
