

A methodology of phenotyping ICU patients from EHR data: High-fidelity, personalized, and interpretable phenotypes estimation
- PMID: 37984547
- PMCID: PMC10802138
- DOI: 10.1016/j.jbi.2023.104547
A methodology of phenotyping ICU patients from EHR data: High-fidelity, personalized, and interpretable phenotypes estimation
Abstract
Objective: Computing phenotypes that provide high-fidelity, time-dependent characterizations and yield personalized interpretations is challenging, especially given the complexity of physiological and healthcare systems and clinical data quality. This paper develops a methodological pipeline to estimate unmeasured physiological parameters and produce high-fidelity, personalized phenotypes anchored to physiological mechanics from electronic health record (EHR).
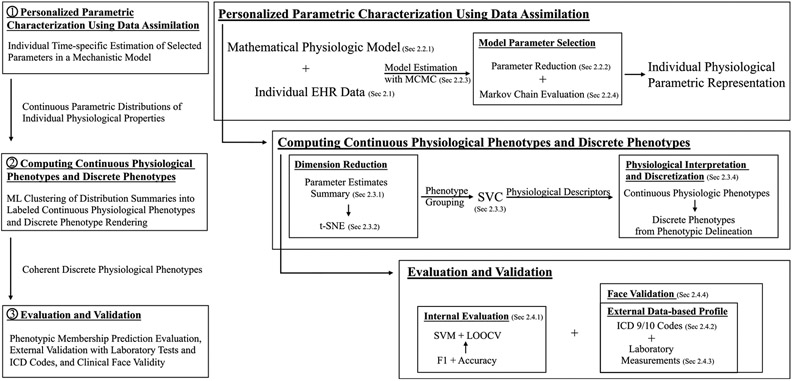
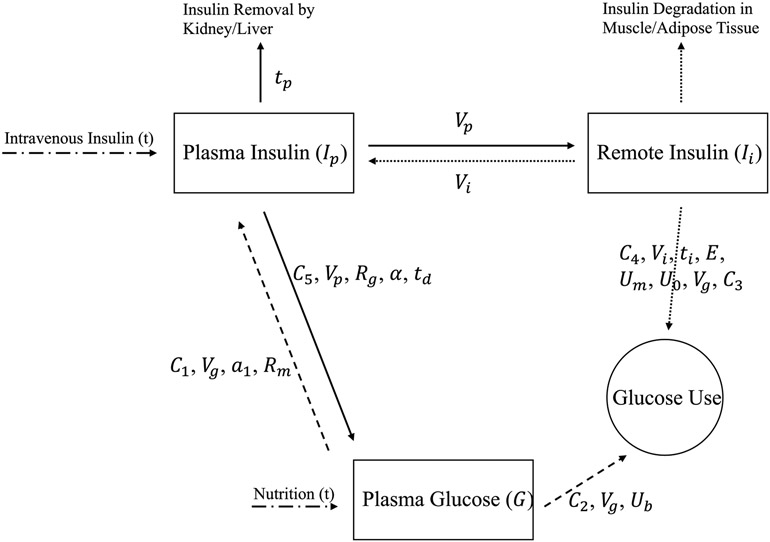
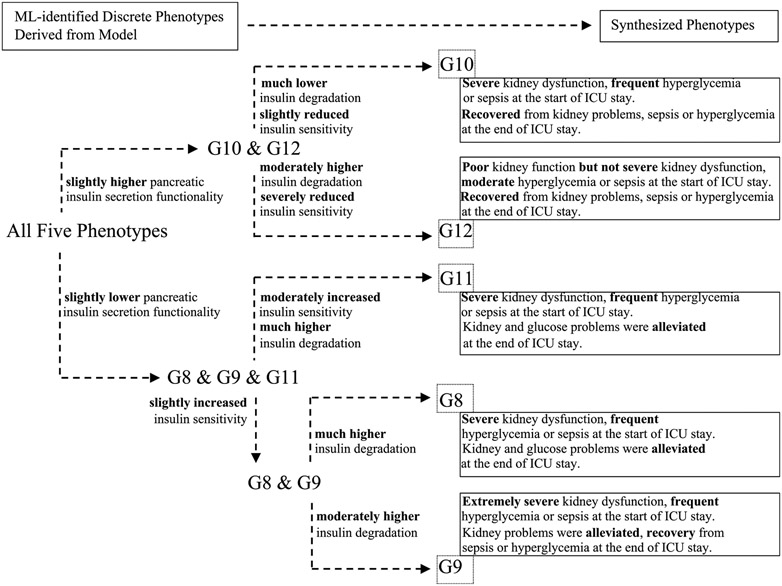
Methods: A methodological phenotyping pipeline is developed that computes new phenotypes defined with unmeasurable computational biomarkers quantifying specific physiological properties in real time. Working within the inverse problem framework, this pipeline is applied to the glucose-insulin system for ICU patients using data assimilation to estimate an established mathematical physiological model with stochastic optimization. This produces physiological model parameter vectors of clinically unmeasured endocrine properties, here insulin secretion, clearance, and resistance, estimated for individual patient. These physiological parameter vectors are used as inputs to unsupervised machine learning methods to produce phenotypic labels and discrete physiological phenotypes. These phenotypes are inherently interpretable because they are based on parametric physiological descriptors. To establish potential clinical utility, the computed phenotypes are evaluated with external EHR data for consistency and reliability and with clinician face validation.
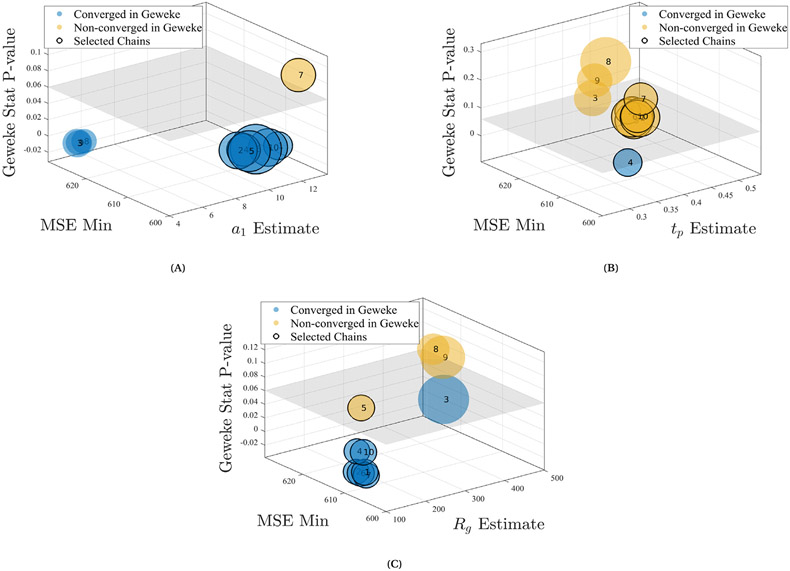
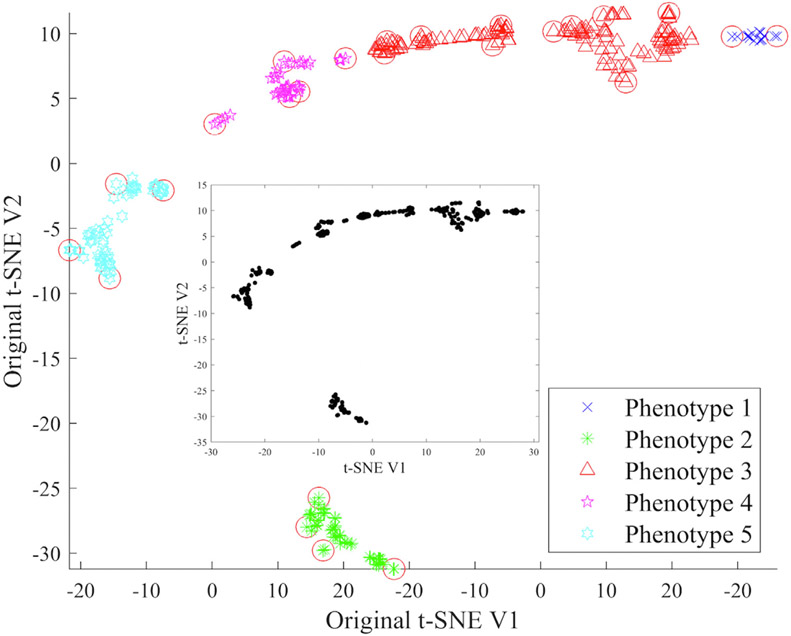
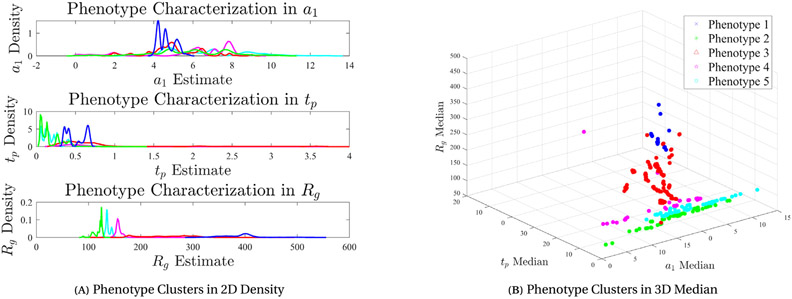
Results: The phenotype computation was performed on a cohort of 109 ICU patients who received no or short-acting insulin therapy, rendering continuous and discrete physiological phenotypes as specific computational biomarkers of unmeasured insulin secretion, clearance, and resistance on time windows of three days. Six, six, and five discrete phenotypes were found in the first, middle, and last three-day periods of ICU stays, respectively. Computed phenotypic labels were predictive with an average accuracy of 89%. External validation of discrete phenotypes showed coherence and consistency in clinically observable differences based on laboratory measurements and ICD 9/10 codes and clinical concordance from face validity. A particularly clinically impactful parameter, insulin secretion, had a concordance accuracy of 83%±27%.
Conclusion: The new physiological phenotypes computed with individual patient ICU data and defined by estimates of mechanistic model parameters have high physiological fidelity, are continuous, time-specific, personalized, interpretable, and predictive. This methodology is generalizable to other clinical and physiological settings and opens the door for discovering deeper physiological information to personalize medical care.
Keywords: Data assimilation; Data mining; Electronic health record; Knowledge representation with machine learning; Phenotyping; Physiological modeling.
Copyright © 2023. Published by Elsevier Inc.
Conflict of interest statement
Declaration of competing interest The authors declare that they have no known competing financial interests or personal relationships that could have appeared to influence the work reported in this paper.
Figures
Update of
-
A methodology of phenotyping ICU patients from EHR data: high-fidelity, personalized, and interpretable phenotypes estimation.medRxiv [Preprint]. 2023 Aug 25:2023.03.15.23287315. doi: 10.1101/2023.03.15.23287315. medRxiv. 2023. Update in: J Biomed Inform. 2023 Dec;148:104547. doi: 10.1016/j.jbi.2023.104547. PMID: 37662404 Free PMC article. Updated. Preprint.
References
-
- Faruqui Syed Hasib Akhter, Du Yan, Meka Rajitha, Alaeddini Adel, Li Chengdong, Shirinkam Sara, Wang Jing, Development of a deep learning model for dynamic forecasting of blood glucose level for type 2 diabetes mellitus: Secondary analysis of a randomized controlled trial, JMIR Mhealth Uhealth (ISSN: 2291-5222) 7 (11) (2019) e14452, 10.2196/14452. - DOI - PMC - PubMed
-
- Zeevi David, Korem Tal, Zmora Niv, Israeli David, Rothschild Daphna, Weinberger Adina, Orly Ben-Yacov Dar Lador, Tali Avnit-Sagi Maya Lotan-Pompan, Suez Jotham, Jemal Ali Mahdi Elad Matot, Malka Gal, Kosower Noa, Rein Michal, Gili Zilberman-Schapira Lenka Dohnalová, Meirav Pevsner-Fischer Rony Bikovsky, Halpern Zamir, Elinav Eran, Segal Eran, Personalized nutrition by prediction of glycemic responses, Cell (ISSN: 0092-8674) 163 (5) (2015) 1079–1094, 10.1016/j.cell.2015.11.001, OA status: bronze. - DOI - PubMed
-
- Blei David M., Ng Andrew Y., Jordan Michael I., Latent dirichlet allocation, J. Mach. Learn. Res (ISSN: 1532-4435) 3 (2003) 993–1022, URL: https://www.jmlr.org/papers/volume3/blei03a/blei03a.pdf?ref=https://gith....
-
- Saria Suchi, Roller Daphne, Penn Anna, Learning individual and population level traits from clinical temporal data, in: Proceedings of Neural Information Processing Systems, Citeseer, pp. 1–9.
-
- Richesson Rachel L, Rusincovitch Shelley A, Wixted Douglas, Batch Bryan C, Feinglos Mark N, Miranda Marie Lynn, Hammond W Ed, Califf Robert M, Spratt Susan E, A comparison of phenotype definitions for diabetes mellitus, J. Am. Med. Inform. Assoc (ISSN: 1067-5027) 20 (e2) (2013) e319–e326, 10.1136/amiajnl-2013-001952, URL:https://www.ncbi.nlm.nih.gov/pmc/articles/PMC3861928, OA status: green_published. - DOI - PMC - PubMed
Publication types
MeSH terms
Substances
Grants and funding
LinkOut - more resources
Full Text Sources
