. 2024 Apr;22(4):863-875.
doi: 10.1111/pbi.14229. Epub 2023 Nov 20.

Uncovering epigenetic and transcriptional regulation of growth in Douglas-fir: identification of differential methylation regions in mega-sized introns

Affiliations

Uncovering epigenetic and transcriptional regulation of growth in Douglas-fir: identification of differential methylation regions in mega-sized introns

Giang Thi Ha Vu et al. Plant Biotechnol J. 2024 Apr.

Abstract

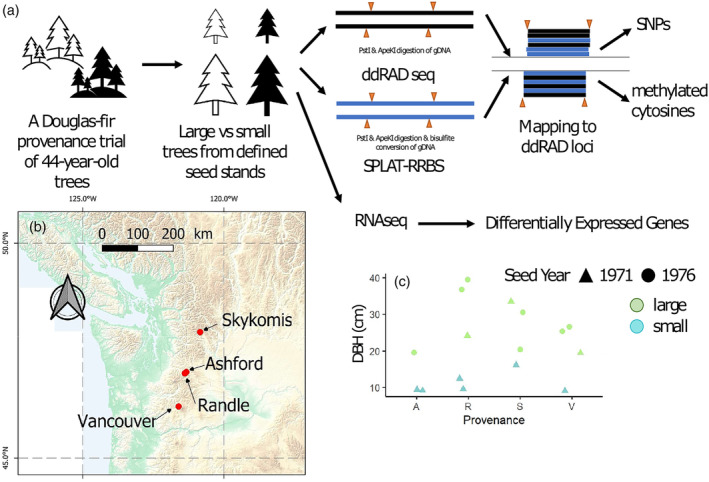
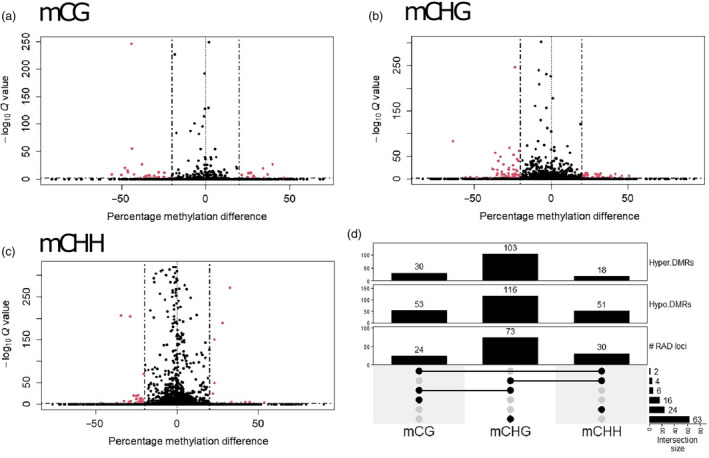
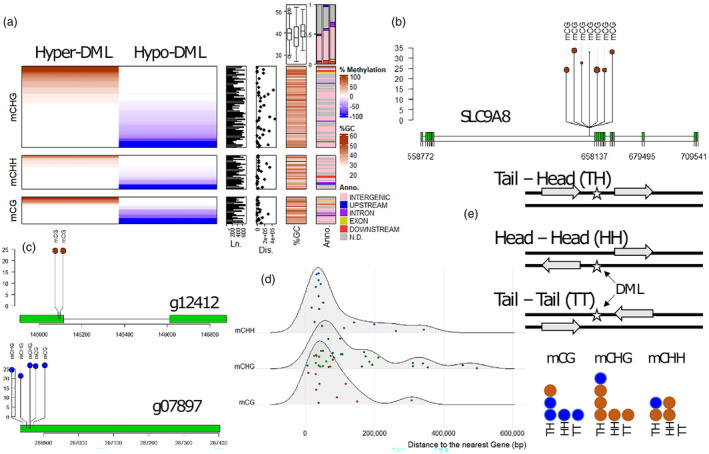
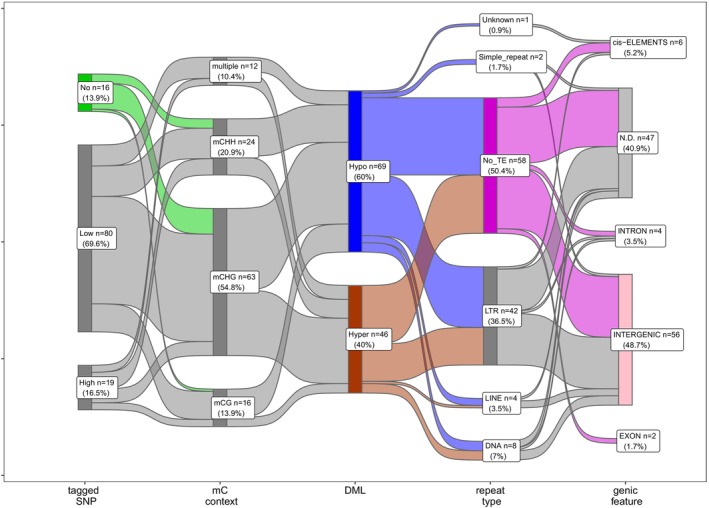
Tree growth performance can be partly explained by genetics, while a large proportion of growth variation is thought to be controlled by environmental factors. However, to what extent DNA methylation, a stable epigenetic modification, contributes to phenotypic plasticity in the growth performance of long-lived trees remains unclear. In this study, a comparative analysis of targeted DNA genotyping, DNA methylation and mRNAseq profiling for needles of 44-year-old Douglas-fir trees (Pseudotsuga menziesii (Mirb.) Franco) having contrasting growth characteristics was performed. In total, we identified 195 differentially expressed genes (DEGs) and 115 differentially methylated loci (DML) that are associated with genes involved in fitness-related processes such as growth, stress management, plant development and energy resources. Interestingly, all four intronic DML were identified in mega-sized (between 100 and 180 kbp in length) and highly expressed genes, suggesting specialized regulation mechanisms of these long intron genes in gymnosperms. DNA repetitive sequences mainly comprising long-terminal repeats of retroelements are involved in growth-associated DNA methylation regulation (both hyper- and hypomethylation) of 99 DML (86.1% of total DML). Furthermore, nearly 14% of the DML was not tagged by single nucleotide polymorphisms, suggesting a unique contribution of the epigenetic variation in tree growth.

Keywords: Pseudotsuga menziesii; DNA methylation; Douglas‐fir; ddRADseq; epigenetics; growth performance.


Conflict of interest statement

The authors declare no competing interests.

Figures

Figure 1
Figure 1
Overview of the study. (a) Schematic diagram of the experimental design and workflow to identify growth‐associated DNA methylation patterns and Differentially Expressed Genes in representatives of a Douglas‐fir provenance trial in Germany. (b) Geographic locations of the four original natural provenances Skykomish, Ashford, Randle and Vancouver in the northwestern USA. (c) Stem diameter at breast height (DBH) values (in cm) of studied trees were used for estimating the tree growth performance, given that diameter increment is the nearly constant non‐reversible feature of tree growth and its allometric correlation between stem diameter, tree height and timber volume.
Figure 2
Figure 2
DNA Methylation analysis of Douglas‐fir needles from contrasting growth performance trees. (a–c) Volcano plots indicate differentially methylated CG‐, CHG‐ and CHH‐regions (DMRs) between large and small trees via the logistic regression test, while seed harvesting year, original population and tree location were included for separating the influence of these covariates from the tree growth. Dashed lines indicate cut‐offs for significance that exhibited DNA methylation difference >20% and Benjamini–Hochberg false discovery rate (FDR)‐adjusted P < 0.05. (d) Summary of mCG‐, CHG‐ and CHH‐DMRs with either increased or decreased DNA methylation levels in the large trees (Hyper.DMRs or Hypo.DMRs, respectively) revealed 16, 63 and 24 RAD loci containing DMRs for specific mCG, mCHG and mCHH contexts, respectively. The other 12 DML consist of methylated cytosines in different genomic contexts.
Figure 3
Figure 3
Enrichment and depletion of growth‐related DNA methylation within genomic regions of ddRAD loci. (a) Cytosines for which DNA methylation status was specifically and significantly associated with DBH are summarized for ddRAD loci. Dark brown shaded loci indicate the proportion of cytosines for which DNA methylation increased with DBH (Hypermethylated DML, Hyper‐DML) and light blue indicates cytosines for which DNA methylation decreased with DBH (Hypomethylated DML, Hypo‐DML). DML‐containing growth‐associated cytosine methylation that was enriched in different CG, CHG and CHH‐ contexts is highlighted by mark annotations. Length of DML (Ln. panel), distance (in bp) between DML and the corresponding nearest genes (Dis. panel), and %GC content of DML (%GC panel) are demonstrated as right panels. Based on the genomic locations of DML and the nearest genes, DML were annotated as Exon, Intron, Upstream or Downstream within 5 kbp to the start codon or stop codon, respectively (Anno. Panel). All other DML located on gene‐containing contigs were assigned as distal intergenic loci while the rest was considered as not determined (grey colour) due to the fragmented genome assembly. Two summary graphs for %GC (box plot), and Annotation (bar plot) compare corresponding data between cytosine contexts (from left to right: mCG, mCHG and mCHH). (b) All intronic DML are in very large genes (i.e. >35 kbp). The epigenetic regulation of the largest intron in the gene SLC9A8 (PSME_40274) is shown as an example. (c) The two exonic DML (PSME_12412 and PSME_07897 shown as g12412 and g07897, respectively) are in the first exon or the 5′ beginning of the coding sequences. The y‐axis presents the DNA methylation level (%) of DML. (d) Distal distances between intergenic DML and the corresponding nearest genes were up to 500 kbp but were mainly within 200 kbp. (e) Orientations of genes surrounding the intergenic DML suggest no enrichment of any preferential model. Hypermethylated DMLs are depicted in brown, while hypomethylated DMLs are represented in blue.
Figure 4
Figure 4
Association of differentially methylated loci (DML) with detected SNPs, repeat sequences and gene annotation. The number of DML (n) and corresponding percentage (%) to the total of 115 DML are shown in every group. TE, Transposable elements; LTR, Long‐Terminal Repeats; LINE, Long Interspersed Nuclear Elements; DNA, DNA transposons; and cis‐ELEMENTs, 5 kb up/downstream of the coding regions.

Similar articles

Cited by

References

    1. Akalin, A. , Kormaksson, M. , Li, S. , Garrett‐Bakelman, F.E. , Figueroa, M.E. , Melnick, A. and Mason, C.E. (2012) methylKit: a comprehensive R package for the analysis of genome‐wide DNA methylation profiles. Genome Biol. 13, R87. - PMC - PubMed
    1. Alexa, A. and Rahnenführer, J. (2009) Gene set enrichment analysis with topGO. Bioconductor Improv. 27, 1–26.
    1. An, D. , Cao, H. , Li, C. , Humbeck, K. and Wang, W. (2018) Isoform sequencing and state‐of‐art applications for unravelling complexity of plant transcriptomes. Genes, 9, 43. - PMC - PubMed
    1. Anekonda, T. , Jones, C. , Smith, B.N. and Hansen, L.D. (2004) Differences in physiology and growth between coastal and inland varieties of Douglas‐fir seedlings in a common garden. Thermochim Acta, 422, 75–79.
    1. Ausin, I. , Feng, S. , Yu, C. , Liu, W. , Kuo, H.Y. , Jacobsen, E.L. , Zhai, J. et al. (2016) DNA methylome of the 20‐gigabase Norway spruce genome. PNAS, 113, E8106–E8113. - PMC - PubMed

LinkOut - more resources