. 2024 Jan;11(3):e2304113.
doi: 10.1002/advs.202304113. Epub 2023 Nov 20.

Enhanced C-To-T and A-To-G Base Editing in Mitochondrial DNA with Engineered DdCBE and TALED

Affiliations

Enhanced C-To-T and A-To-G Base Editing in Mitochondrial DNA with Engineered DdCBE and TALED

Yinghui Wei et al. Adv Sci (Weinh). 2024 Jan.

Abstract

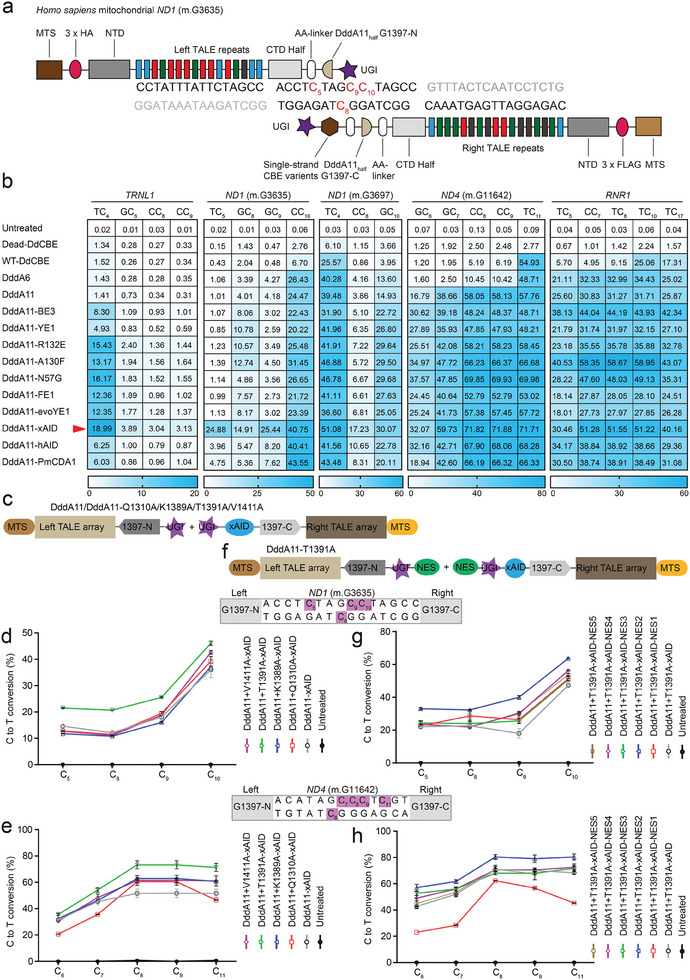
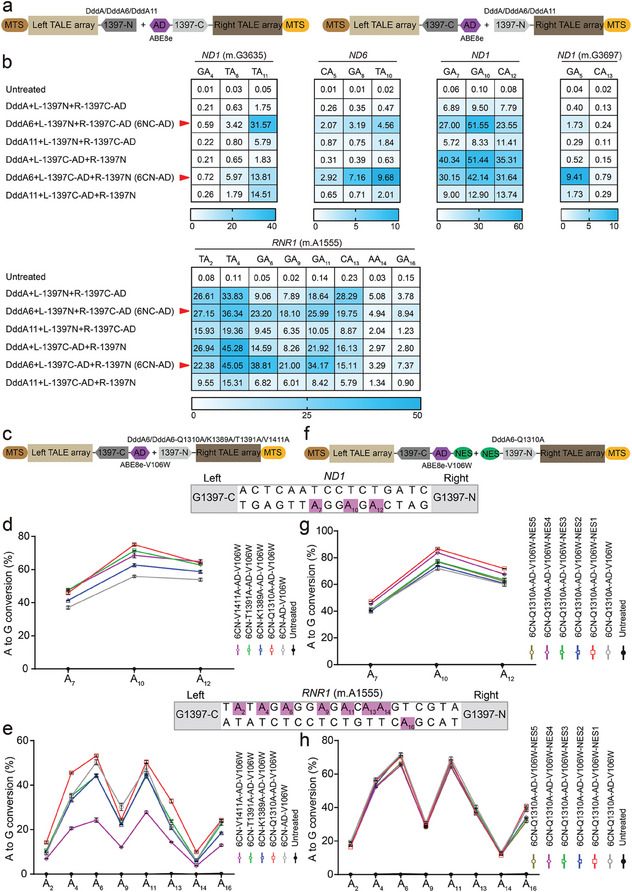
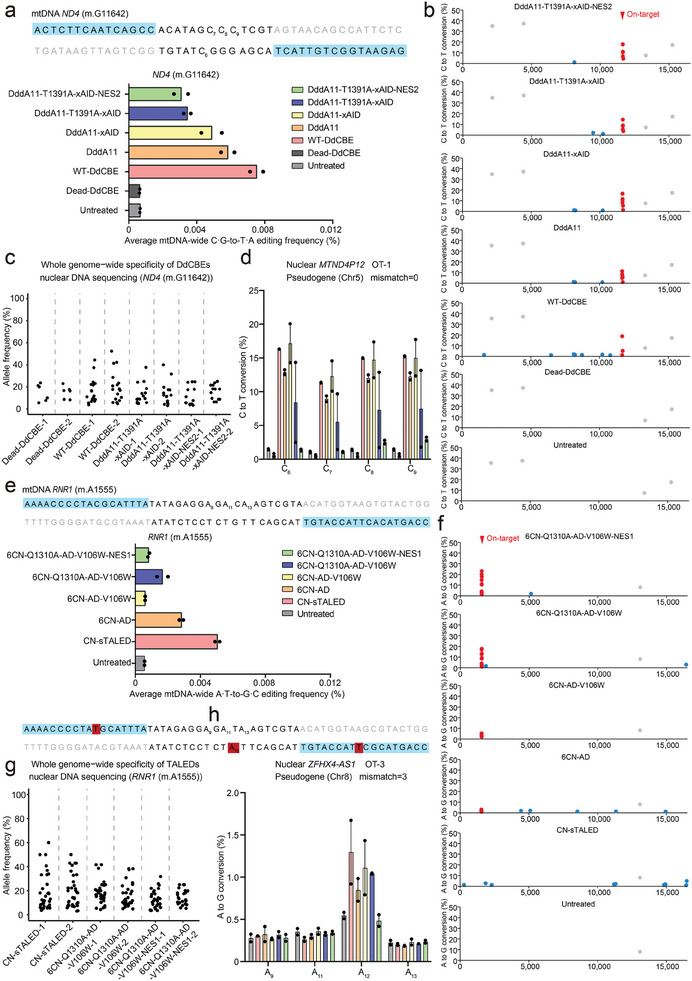
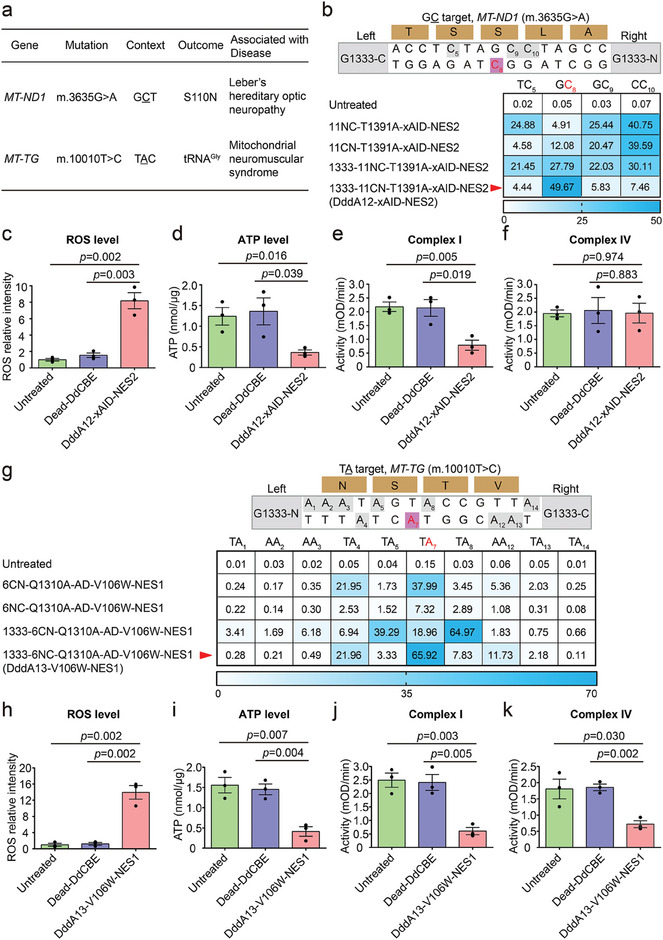
Mitochondrial base editing with DddA-derived cytosine base editor (DdCBE) is limited in the accessible target sequences and modest activity. Here, the optimized DdCBE tools is presented with improved editing activity and expanded C-to-T targeting scope by fusing DddA11 variant with different cytosine deaminases with single-strand DNA activity. Compared to previous DdCBE based on DddA11 variant alone, fusion of the activation-induced cytidine deaminase (AID) from Xenopus laevis not only permits cytosine editing of 5'-GC-3' sequence, but also elevates editing efficiency at 5'-TC-3', 5'-CC-3', and 5'-GC-3' targets by up to 25-, 10-, and 6-fold, respectively. Furthermore, the A-to-G editing efficiency is significantly improved by fusing the evolved DddA6 variant with TALE-linked deoxyadenosine deaminase (TALED). Notably, the authors introduce the reported high-fidelity mutations in DddA and add nuclear export signal (NES) sequences in DdCBE and TALED to reduce off-target editing in the nuclear and mitochondrial genome while improving on-target editing efficiency in mitochondrial DNA (mtDNA). Finally, these engineered mitochondrial base editors are shown to be efficient in installing mtDNA mutations in human cells or mouse embryos for disease modeling. Collectively, the study shows broad implications for the basic study and therapeutic applications of optimized DdCBE and TALED.

Keywords: DdCBE; TALED; disease modeling; mitochondrial base editing.


Conflict of interest statement

The authors declare no conflict of interest.

Figures

Figure 1
Figure 1
Engineered DdCBE variants show enhanced editing at TC, non‐TC target sequences in mtDNA. a) Schematic of engineered DdCBE variants targeting ND1 (m.G3635) gene in the mitochondrial genome. b) Heat map showing C·G‐to‐T·A editing efficiencies induced by DddA (WT‐DdCBE), DddA6, DddA11, and DddA11‐fused cytosine deaminases with ssDNA activity in HEK293T cells at five mitochondrial target sites, including TRNL1, ND1, ND4, and RNR1. The cytosines in the top strands or bottom strands are presented as C‐to‐T conversion frequencies. The nucleotide adjacent to the end of the left‐TALE‐recognition sequence was numbered “‘1,”’ and C was sequentially numbered. For the heatmap, the number is given in units of %. Top 10% of EGFP‐ and mCherry‐double positive cells were harvested from FACS 48 h after transfection. The targeting efficiency was tested by targeted deep sequencing. c) Architectures of DddA11‐xAID with the reported high‐fidelity mutations. d,e) Analysis of C·G‐to‐T·A editing frequencies at ND1 (m.G3635) and ND4 (m.G11642) sites induced by DddA11‐xAID with high‐fidelity mutations, including Q1310A, K1389A, T1391A, and V1411A. f) Architectures of DddA11‐T1391A‐xAID fused different nuclear export signal (NES) sequences. g,h) Analysis of C·G‐to‐T·A editing frequencies at ND1 (m.G3635) and ND4 (m.G11642) sites induced by DddA11‐T1391A‐xAID fused NES sequences. Values and error bars in (b), (d,e), and (g,h) reflect the mean ± s.e.m. of n = 3 independent biological replicates.
Figure 2
Figure 2
TALEDs fused evolved DddA6 achieve high‐efficiency editing at multiple mtDNA loci. a) Architectures of TALEDs with the evolved DddA6 or DddA11 variants. b) Heat map showing A·T‐to‐G·C editing efficiencies induced by TALED, TALED‐DddA6, and TALED‐DddA11 in HEK293T cells at five mitochondrial target sites, including ND1, ND6, and RNR1. TALEDs fused DddA6 variant and the split DddAtox orientation at G1397 position that resulted in the higher editing efficiencies. The adenines in the top strands or bottom strands are presented as A‐to‐G conversion frequencies. The nucleotide adjacent to the end of the left‐TALE‐recognition sequence was numbered “‘1,”’ and A was sequentially numbered. For the heatmap, the number is given in units of %. Top 10% of EGFP‐ and mCherry‐double positive cells were harvested from FACS 48 h after transfection. The targeting efficiency was tested by targeted deep sequencing. c) Architectures of 6CN‐AD‐V106W with the reported high‐fidelity mutations of DddA. d,e) Analysis of A·T‐to‐G·C editing frequencies at ND1 and RNR1 (m.A1555) sites induced by 6CN‐AD‐V106W with high‐fidelity mutations, including Q1310A, K1389A, T1391A, and V1411A. f) Architectures of 6CN‐Q1310A‐AD‐V106W fused different nuclear export signal (NES) sequences. g,h) Analysis of A·T‐to‐G·C editing frequencies at ND1 and RNR1 (m.A1555) sites induced by 6CN‐Q1310A‐AD‐V106W fused NES sequences. For (b), (d,e), and (g,h), values and error bars reflect the mean ± s.e.m. of n = 3 independent biological replicates.
Figure 3
Figure 3
Off‐target analysis for engineered DdCBE and TALED variants targeting to the ND4 (m.G11642) and RNR1 (m.A1555) sites. a) The average frequencies of mitochondrial genome‐wide off‐target editing induced by Dead‐DdCBE, wild‐type DdCBE (WT‐DdCBE), DddA11, DddA11‐xAID, DddA11‐T1391A‐xAID, and DddA11‐T1391A‐xAID‐NES2 specific to the ND4 (m.G11642) site. Error bars are s.e.m. for n =  2 biologically independent samples. b) Mitochondrial genome‐wide plots for C‐to‐T point mutations with frequencies ≥1%. Naturally occurring SNVs, on‐target edits (including bystander edits in the editing window) and off‐target edits are shown in gray, red, and blue, respectively. All data points from n = 2 biologically independent experiments are shown. c) Genome‐wide off‐target analysis for engineered DdCBE variants targeting the ND4 (m.G11642) site. The C·G‐to‐T·A editing frequencies of each unique SNV are shown for the Dead‐DdCBE, WT‐DdCBE, and our engineered DdCBE variants. d) The corresponding nuclear DNA sequence with the greatest homology (mismatch = 0) is shown for the ND4 (m.G11642) site. Editing efficiencies are measured by targeted deep sequencing (see Table S4 for primer sequences) (Supporting Information). Data are presented as means ± SEM. e) The average frequencies of mitochondrial genome‐wide off‐target editing induced by CN‐sTALED, 6CN‐AD, 6CN‐AD‐V106W, 6CN‐Q1310A‐AD‐V106W, and 6CN‐Q1310A‐AD‐V106W‐NES1 specific to the RNR1 (m.A1555) site. Error bars are s.e.m. for n = 2 biologically independent samples. f) Mitochondrial genome‐wide plots for A‐to‐G point mutations with frequencies ≥1%. Naturally occurring SNVs, on‐target edits (including bystander edits in the editing window) and off‐target edits are shown in gray, red, and blue, respectively. All data points from n = 2 biologically independent experiments are shown. g) Genome‐wide off‐target analysis for engineered TALED variants targeting the RNR1 (m.A1555) site. The A·T‐to‐G·C editing frequencies of each unique SNV are shown for CN‐sTALED and our engineered TALED variants. h) The corresponding nuclear DNA sequence with the high homology (mismatch = 3) is shown for the RNR1 (m.A1555) site. TALE binding sites begin at N0 and are shown in blue. Nucleotide mismatches between the mtDNA and nuclear pseudogene are in red. Editing efficiencies are measured by targeted deep sequencing (see Table S4 for primer sequences) (Supporting Information). Data are presented as means ± SEM.
Figure 4
Figure 4
Application of high‐fidelity DdCBE and TALED variants to install pathogenic mutations in HEK293T cells. a) Using high‐fidelity DdCBE and TALED variants to install disease‐associated target mutations in human mtDNA (S, serine; N, asparagine). b) Mitochondrial C‐to‐T editing efficiencies of HEK293T cells treated with DddA11‐T1391A‐xAID‐NES2 variant at G1397 and G1333 orientation of split DddAtox for the mitochondrial ND1 (m.G3635) site in previously inaccessible GC targets. On‐target cytosines are colored red or gray, respectively. Top 30% of EGFP‐ and mCherry‐double positive cells expressing the DdCBE variants were isolated by FACS for targeted deep sequencing. The split orientation, target spacing region, and corresponding encoded amino acids are shown. 11NC‐T1391A‐xAID‐NES2, Right–G1397‐C + Left–G1397‐N orientation; 11CN‐T1391A‐xAID‐NES2, Right–G1397‐N + Left–G1397‐C orientation; 1333‐11NC‐T1391A‐xAID‐NES2, Right–G1333‐C + Left–G1333‐N orientation; 1333‐11CN‐T1391A‐xAID‐NES2 (DddA12‐xAID‐NES2), Right–G1333‐N + Left–G1333‐C orientation. Shown are means ± SEM; n = 3 independent experiments. The transfection time was 2 days. For the heatmap, the number is given in units of %. c–f) The levels of intracellular ROS (c), ATP (d) and the activities of complex I (e), complex IV (f) in sorted HEK293T cells treated with the DddA12‐xAID‐NES2 or Dead‐DdCBE for the ND1 (m.G3635) site. mOD, absorbance at optical density of 450 nm (complex I activity) or 550 nm (complex IV activity). Data are presented as means ± SEM. p values were evaluated with the unpaired student's t‐test (two‐tailed). All data points from n  =  3 biologically independent experiments are shown. g) Mitochondrial A‐to‐G editing efficiencies of HEK293T cells treated with 6CN‐Q1310A‐AD‐V106W‐NES1 variant at G1397 and G1333 orientation of split DddAtox for the mitochondrial TG (m.T10010) site. On‐target adenines are colored red or gray, respectively. Top 30% of EGFP‐ and mCherry‐double positive cells expressing the TALED variants were isolated by FACS for targeted deep sequencing. The split orientation, target spacing region and corresponding encoded amino acids are shown. 6CN‐Q1310A‐AD‐V106W‐NES1, Right–G1397‐N + Left–G1397‐C orientation; 6NC‐Q1310A‐AD‐V106W‐NES1, Right–G1397‐C + Left–G1397‐N orientation; 1333–6CN‐Q1310A‐AD‐V106W‐NES1, Right–G1333‐N + Left–G1333‐C orientation; 1333–6NC‐Q1310A‐AD‐V106W‐NES1 (DddA13‐V106W‐NES1), Right–G1333‐C + Left–G1333‐N orientation. Shown are means ± SEM; n = 3 independent experiments. The transfection time was 2 days. For the heatmap, the number is given in units of %. h–k) The levels of intracellular ROS (h), ATP (i) and the activities of complex I (j), complex IV (k) in sorted HEK293T cells treated with the DddA13‐V106W‐NES1 or Dead‐DdCBE for the TG (m.T10010) site. Data are presented as means ± SEM. p values were evaluated with the unpaired student's t‐test (two‐tailed). All data points from n = 3 biologically independent experiments are shown.

Similar articles

Cited by

References

    1. Wallace D. C., Nat. Genet. 2018, 50, 1642. - PubMed
    1. Barcelos I., Shadiack E., Ganetzky R. D., Falk M. J., Curr. Opin. Pediatr. 2020, 32, 707. - PMC - PubMed
    1. Adashi E. Y., Rubenstein D. S., Mossman J. A., Schon E. A., Cohen I. G., Science 2021, 373, 1200. - PubMed
    1. Gammage P. A., Viscomi C., Simard M.‐L., Costa A. S. H., Gaude E., Powell C. A., Van Haute L., Mccann B. J., Rebelo‐Guiomar P., Cerutti R., Zhang L., Rebar E. J., Zeviani M., Frezza C., Stewart J. B., Minczuk M., Nat. Med. 2018, 24, 1691. - PMC - PubMed
    1. Gammage P. A., Rorbach J., Vincent A. I., Rebar E. J., Minczuk M., EMBO Mol. Med. 2014, 6, 458. - PMC - PubMed

Publication types

LinkOut - more resources