Review
. 2024 Jan;11(1):e2304110.
doi: 10.1002/advs.202304110. Epub 2023 Nov 20.

Nanotechnology and Cancer Bioelectricity: Bridging the Gap Between Biology and Translational Medicine

Affiliations
Review

Nanotechnology and Cancer Bioelectricity: Bridging the Gap Between Biology and Translational Medicine

Rosalia Moreddu. Adv Sci (Weinh). 2024 Jan.

Abstract

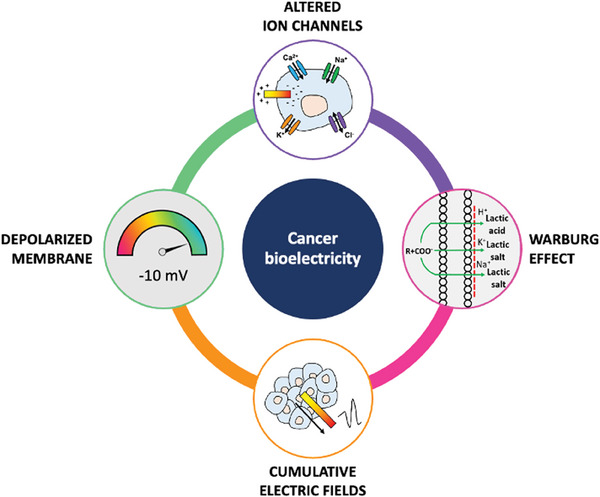
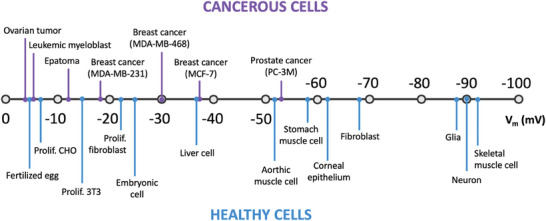
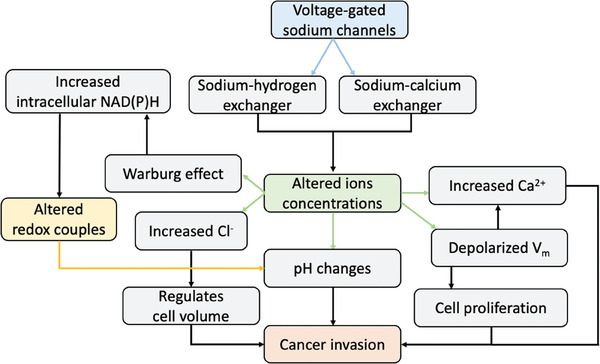
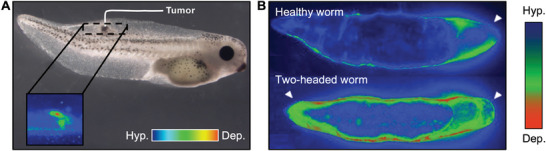
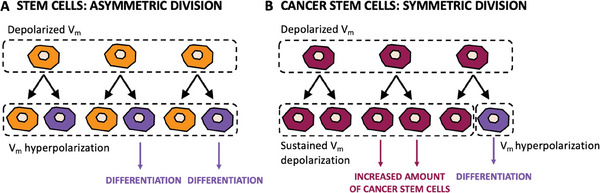
Bioelectricity is the electrical activity that occurs within living cells and tissues. This activity is critical for regulating homeostatic cellular function and communication, and disruptions of the same can lead to a variety of conditions, including cancer. Cancer cells are known to exhibit abnormal electrical properties compared to their healthy counterparts, and this has driven researchers to investigate the potential of harnessing bioelectricity as a tool in cancer diagnosis, prognosis, and treatment. In parallel, bioelectricity represents one of the means to gain fundamental insights on how electrical signals and charges play a role in cancer insurgence, growth, and progression. This review provides a comprehensive analysis of the literature in this field, addressing the fundamentals of bioelectricity in single cancer cells, cancer cell cohorts, and cancerous tissues. The emerging role of bioelectricity in cancer proliferation and metastasis is introduced. Based on the acknowledgement that this biological information is still hard to access due to the existing gap between biological findings and translational medicine, the latest advancements in the field of nanotechnologies for cellular electrophysiology are examined, as well as the most recent developments in micro- and nano-devices for cancer diagnostics and therapy targeting bioelectricity.

Keywords: Bioelectricity; Cancer; Electrophysiology; Ion Channels; Nanotechnology; Non-Excitable Cells; Translational Medicine.


Conflict of interest statement

The authors declare no conflict of interest.

Figures

Figure 1
Figure 1
Overview of the multifactorial interplay in cancer bioelectricity.
Figure 2
Figure 2
Current challenges in cancer medicine: early detection, personalized treatment, long‐term side effects, and drug development.
Figure 3
Figure 3
Chemical and mechanical cues associated to cancer cell bioelectricity.
Figure 4
Figure 4
Membrane potential of selected cancerous and healthy cell types. Readapted from.[ 14 ]
Figure 5
Figure 5
Bioelectrical phenomena observed in single cancer cells. A) Ionic currents and faradaic currents; B) Warburg effect in cancer cells: negatively charged surface profile.
Figure 6
Figure 6
Cascade of events triggered by the alteration of voltage‐gated sodium channels in cancer cells.
Figure 7
Figure 7
Bioelectrical effects at the single cell reflect to cell cohorts and whole tissues. A) Voltage‐sensitive dye imaging of cells abandoning their participation in organogenesis in favor of tumorigenesis, because of membrane depolarization. Reproduced under the terms of the CC‐BY licence.[ 108 ] Copyrights 2013, the Authors. Published by The Company of Biologists. B) Bioelectrical pattern of resting potentials displays one depolarized region in wild‐type worms (healthy worm, top) and a mirror‐image bipolar pattern in worms that are or will be two‐headed (bottom). Reproduced with permission from.[ 110 ] Copyrights 2021, the Authors. Published by the Royal Society.
Figure 8
Figure 8
Comparison of the differentiation mechanism observed in healthy and cancerous stem cells. A) Healthy stem cells: asymmetric division, where each stem cell generates a copy identical to itself and another cell that will undergo differentiation and maturation. B) Cancer stem cells: symmetric division, where each stem cells produces two identical copies of itself, exponentially increasing the malignant cell reservoir. Redrawn from.[ 14 ]
Figure 9
Figure 9
Cascade of bioelectrical events in cancer. A–C) An altered ion flux in single cancer cells with consequent Vm variation A) results in endogenous electric fields in cancer cell populations B), which in turn drive cells to migrate C). D,E) Morphological differences observed in epithelial healthy D) and malignant E) cells, responsible for the ability of cancer cells to migrate.
Figure 10
Figure 10
Large‐area, low‐impedance electrodes to record the low‐frequency electrical activity of cancer cell cohorts in cancer cell lines. A) Schematic of the microelectrodes. Reproduced under the terms of the CC‐BY licence.[ 29 ] Copyrights 2019, the Authors. Published by MDPI. B) Most representative electrical activity of PC‐3 cells, showing a combination of asynchronous and synchronous activity. Reproduced under the terms of the CC‐BY licence.[ 29 ] Copyrights 2019, the Authors. Published by MDPI. C) Current spikes recorded in the prostate cancer cell line PC‐3. Reproduced under the terms of the CC‐BY licence.[ 29 ] Copyrights 2019, the Authors. Published by MDPI. D) 20 min continuous recording of the prostate cancer cell line PC‐3, before and after administering sodium channel blocker tetrodotoxin (TTX). Reproduced under the terms of the CC‐BY licence.[ 29 ] Copyrights 2019, the Authors. Published by MDPI. E) Asynchronous spike recorded from the highly metastatic breast cancer cell line MDA‐MB‐231. Reproduced under the terms of the CC‐BY licence.[ 30 ] Copyrights 2020, the Authors. Published by Frontiers. F) Voltage‐gated sodium channel activity in MDA‐MB‐231 breast cancer cell line recorded via current measurement across a cell cohort, before and after administering sodium channel blocker tetrodotoxin (TTX). Reproduced under the terms of the CC‐BY licence.[ 30 ] Copyrights 2020, the Authors. Published by Frontiers.
Figure 11
Figure 11
3D nanoelectrodes in electrophysiological recording. A–E) Nanocrown electrodes for recording action potentials in cardiomyocytes. Reproduced under the terms of the CC‐BY licence.[ 144 ] Copyrights 2022, the Authors. Published by NPG. A) Schematics and SEM micrographs of nanocrown electrodes. B) Sample parallel recording from nanocrown electrodes. C) Sketch of the conditions for simultaneous patch‐clamp and nanocrown electrodes recording. D) Microscope image of cardiac cells on a nanoelectrode during patch‐clamp recording. E) Action potentials simultaneously recorded with nanoelectrode arrays and patch‐clamp, demonstrating the functionality of the technology. F–J) 3D nanoelectrodes combined with flat microelectrodes and laser poration to record intra and extracellular activity in mammalian neurons. Reproduced under the terms of the CC‐BY licence.[ 152 ] Copyrights 2017, the Authors. Published by the American Chemical Society. F) SEM micrographs of nanopillars on microelectrodes (top left) and neuron engulfing nanopillars (bottom left). At the right, a sketch of the working principle is presented. G) Typical extracellular recording from microelectrodes. H) Typical intracellular recording following laser poration. I) Individual extracellular spike taken from G. J) Individual intracellular spike taken from H. K–M) Nanopillars on large‐area electrodes for simultaneously monitoring the intracellular activity of NRK cell populations (non‐excitable). Reproduced under the terms of the CC‐BY licence.[ 150 ] Copyrights 2019, the Authors. Published by the American Chemical Society. K) Device schematic and working principle. L) SEM imaging of NRK cells on nanopillars. Scale bar: 5 µm; inset scale bar: 1 µm. M) Voltage recordings under pharmacological stimulation after confluency, to target calcium action potentials: 1 µm PF2 (green), 1 µm BK (orange), unstimulated (black). Scale bars: 0.6 mV, 3 min. At the bottom, voltage recordings of NRK cells (black) and plane gold control (red). Scale bars: 0.5 mV, 60 s.
Figure 12
Figure 12
Voltage‐sensitive indicators for non‐excitable cells electrophysiological recording. A–C) Voltage imaging of single breast cancer cells. Reproduced under the terms of the CC‐BY licence.[ 15 ] Copyrights 2022, the Authors. Published by NPG. A) Schematic of the widefield epifluorescence imaging system with two‐color excitation. B) Mean spiking events for each cell line in 1000s in the adopted field of view. C) Voltage fluctuations imaged in MDA‐MB‐231 single cells during 15 min recordings. D–F) Voltage‐sensitive fluorescence of AR3 and its high fluorescence mutant Archon1 in mammalian cell lines using low‐intensity LED stimulation. Reproduced under the terms of the CC‐BY licence.[ 157 ] Copyrights 2023, the Authors. Published by the American Chemical Society. D) Schematics of the setup and working principle. E) Voltage‐dependent changes in fluorescence of AR3 in mammalian cells. F) Voltage‐dependent changes in fluorescence of Archon1 in mammalian cells. Cells are outlined in yellow and the outside in black. Scale bars: 10 µm.
Figure 13
Figure 13
Combined approaches: electrodes with optical readout. A–C) Passive recording of bioelectrical signals in HEK‐293 cells by fluorescent mirroring. Reproduced under the terms of the CC‐BY licence.[ 7 ] Copyrights 2023, the Authors, Published by the American Chemical Society. A) Working principle of the technology: the interfacial charge of the electrical double layer established at the gold‐electrolyte interface mirrors the electrical activity of the cell sitting on top of the 3D nanoelectrode on the top chamber of the device. The insets show an image of a pair of electrodes in dark field as seen from the bottom chamber. The dots at the central electrode correspond to the 3D electrodes observed on the other end of the membrane. Scale bars (from left to right): 30 µm, 2 µm, 300 nm. B) Images of the electrode pairs taken with an optical microscope (white light) versus a confocal microscope (fluorescence). C) Distribution plot of the fluorescence emitted by bare electrodes compared to electrodes in contact with a HEK‐293 cell. D–F) Recording the electrical activity of cardiomyocytes monolayers via electrochromic materials. Reproduced under the terms of the CC‐BY licence.[ 129 ] Copyrights 2022, the Authors. Published by the American Chemical Society. D) Schematic of the simultaneous recording with electrochromic PEDOT:PSS thin films and patch clamp from the same cell. Inset scale bar = 50 µm. E) Synchronized intracellular (patch clamp) and extracellular (PEDOT:PSS) recordings. F) Zoom at a single intra and extra cellular signals, displaying extracellular spikes during cell membrane depolarization.
Figure 14
Figure 14
Cancer screening based on surface charges. A) Net captured percentage of cells by one type of nanoparticle (positive) subtracted by the cells captured by the nanoparticle opposite charge sign (negative), used as controls. Reproduced under the terms of the CC‐BY licence.[ 89 ] Copyrights 2016, the Authors. Published by Ivy Springs. B) Microscope photographs of blood smear with cancer cells. From top to bottom: MNC cell, green; PMN cell, orange; MDA‐MB‐231 cells, red; MDA‐MB‐231 cells smear; positive NPs captured MDA‐MB‐231 cells from blood. Reproduced under the terms of the CC‐BY licence.[ 89 ] Copyrights 2016, the Authors. Published by Ivy Springs. C) Schematic illustration of the binding of cancer cells by the protein−SPPCNs complexes. After adsorption of the serum proteins, parts of the positively charged surface of the SPPCNs are still exposed and available for interacting with the negatively charged cancer cell membrane. Reproduced under the terms of the CC‐BY licence.[ 181 ] Copyrights 2020, the Authors. Published by the American Chemical Society. D) Schematic of the microfluidic sensor for in situ cell surface charge measurement. (i) Illustration of the two‐stage resistive pulse sensing structures for cell surface charge measurement. (ii) Illustration of a typical resistive pulse signal when a cell passes the 2‐stage RPS consisting of a negative pulse and a positive pulse, separated by an interval with alleviated slope. (iii) (1/t2‐1/t1) and corresponded zeta potential versus t1 for different cells. The star represents statically significant difference between two groups with p less than 0.05. Reproduced under the terms of the CC‐BY licence.[ 90 ] Copyrights 2020, the Authors. Published by the American Chemical Society.
Figure 15
Figure 15
Therapeutic nanoparticles. Reproduced under the terms of the CC‐BY licence.[ 176 ] Copyrights 2023, the Authors. Published by Springer Nature. A) Experimental procedure of antitumor study in vivo. B) In vivo PA images of tumors after intravenous administration of nanoparticles at different time intervals. C) Photographs of representative tumors dissected from various groups as indicated, G1: PBS, G2: Laser, G3: APP NPs, G4: AQ4N, G5: PP NPs + Laser, G6: APP NPs + Laser. D) Tumor growth curves of mice after different treatments (n  =  5). E) Fluorescence intensities of main organs and tumors after injection of APP NPs (n  =  3).
Figure 16
Figure 16
Electroceuticals: small molecules modulators which can alter the electrical state of a cell or tissue by acting on the inhibition of specific players. A) In vivo evidence showing suppression of breast cancer metastasis in mice by blocking VGSC activity with phenytoin. (i) Bioluminescent images of control and phenytoin‐treated mice, 4 weeks after implantation; (ii) Bioluminescence measured from primary tumors post‐implantation; (iii) Volume derived from caliper measurement of primary tumors over the same periods. Reproduced under the terms of the CC‐BY licence.[ 120 ] Copyrights 2019, the Authors. Published by MDPI. B) Amiodarone treatment depolarizes TNBC RMP resulting in decreased cell migration. i) Number of MDA‐MB‐231 derived metastases per area of lung after daily injections of amiodarone or DMSO for 24 days. (ii) Representative lung tissue sections stained with H&E from animals treated with DMSO or (iii) amiodarone. Scale bar = 1 mm. Inset scale bar = 150 µm. Yellow asterisks indicate metastases. Reproduced with permission from.[ 188 ] Copyrights 2021, Elsevier.
Figure 17
Figure 17
Tumor treating fields have demonstrated anticancer effects. A) AC field distribution in quiescent (i) and dividing (ii) cells. Readapted with permission from.[ 17 ] Copyrights 2007, National Academy of Science. B) Colormaps depicting the maximum TTFs intensity distributions in default layouts for brain tissue of a patient with pairs of transducer arrays positioned left‐right (left) and anterior‐posterior (right) in axial slices through the brain. Reproduced with permission from.[ 17 ] Copyrights 2007, National Academy of Science. C) Confocal fluorescence microscopy in A2780 cells for 8 h and OVCAR‐3 cells for 16 hr. The small micrographs represent the cell phases of metaphase and late anaphase. Green: tubulin; blue: DAPI‐stained DNA. Reproduced under the terms of the CC‐BY licence.[ 20 ] Copyrights 2016, the Authors. Published by Wiley and Sons.

Similar articles

Cited by

References

    1. Siegel, Miller K. D., Wagle N. S., Jemal A., CA Cancer J Clin 2023, 73, 17. - PubMed
    1. Pashayan N., Pharoah P. D. P., Science 2020, 368, 589. - PubMed
    1. Cervera J., Ramirez P., Levin M., Mafe S., Phys. Rev. E 2020, 102, 052412. - PubMed
    1. Chernet B., Levin M., J Clin Exp Oncol 2013, 10.4172/2324-9110.S1-002. - DOI - PMC - PubMed
    1. Levin M., Cell 2021, 184, 1971. - PubMed

Publication types