. 2024 Jan 17;44(3):e1677232023.
doi: 10.1523/JNEUROSCI.1677-23.2023.

Mixed Selectivity Coding of Content-Temporal Detail by Dorsomedial Posterior Parietal Neurons

Affiliations

Mixed Selectivity Coding of Content-Temporal Detail by Dorsomedial Posterior Parietal Neurons

Lei Wang et al. J Neurosci. .

Abstract

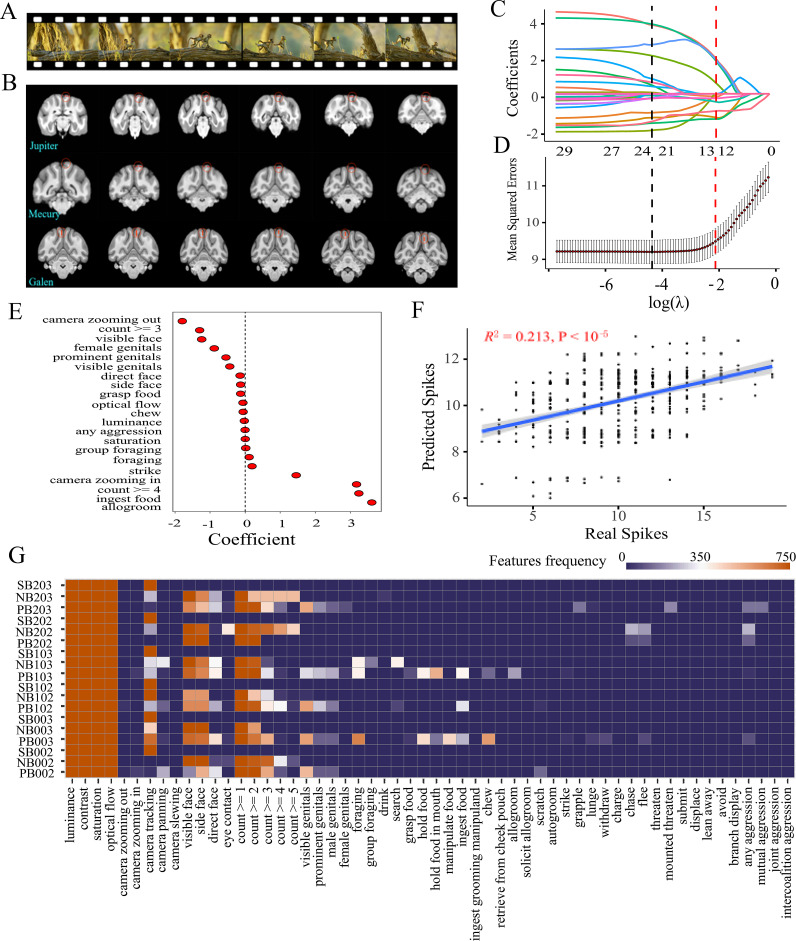
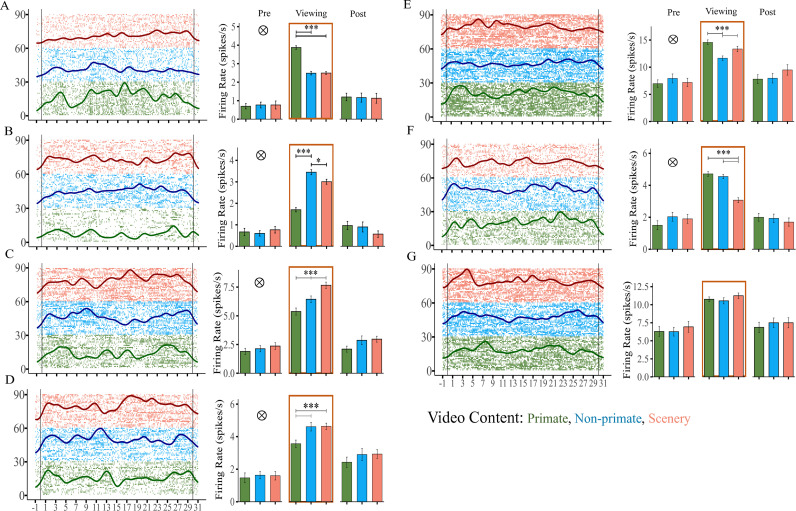
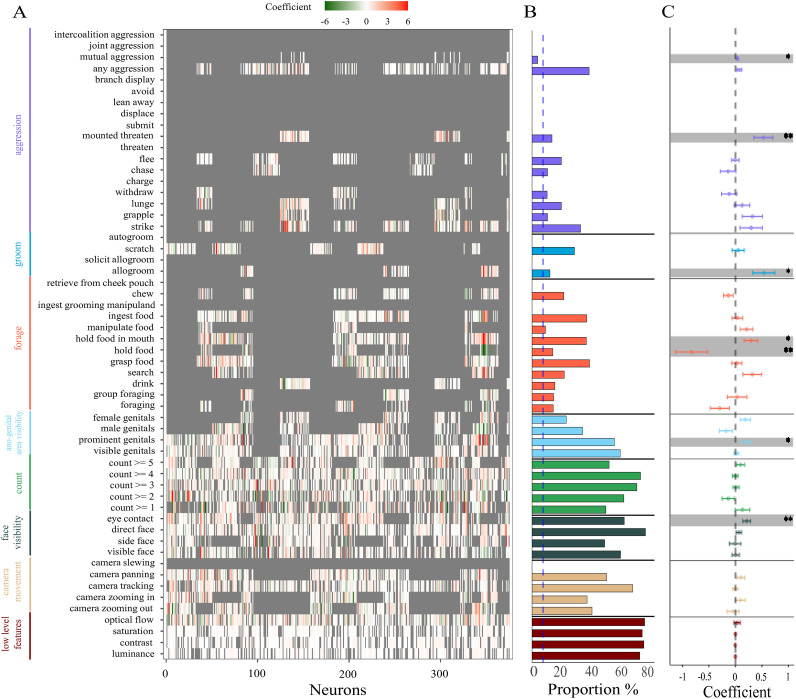
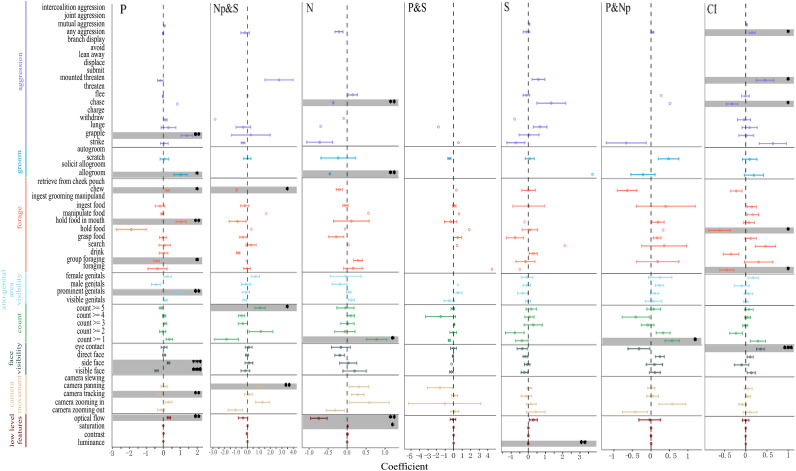
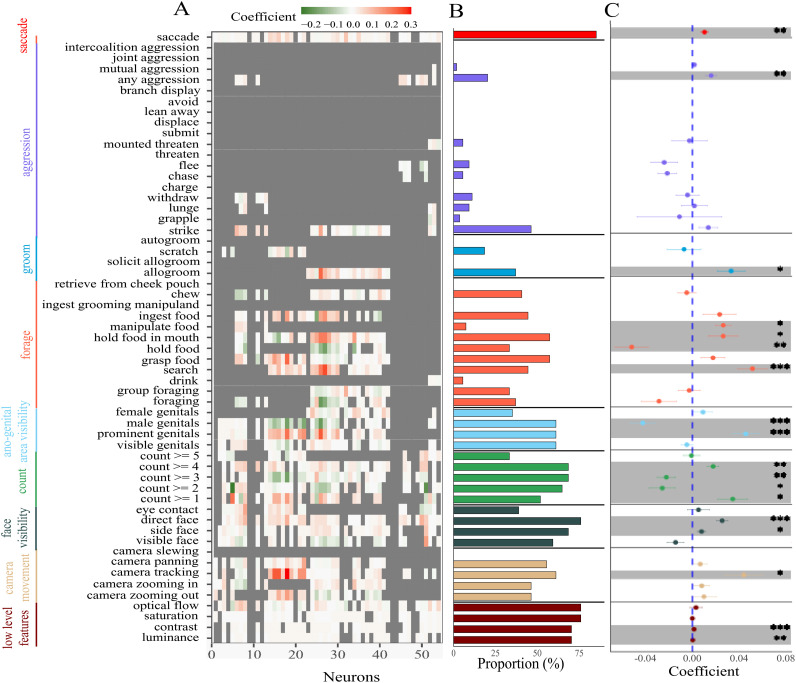
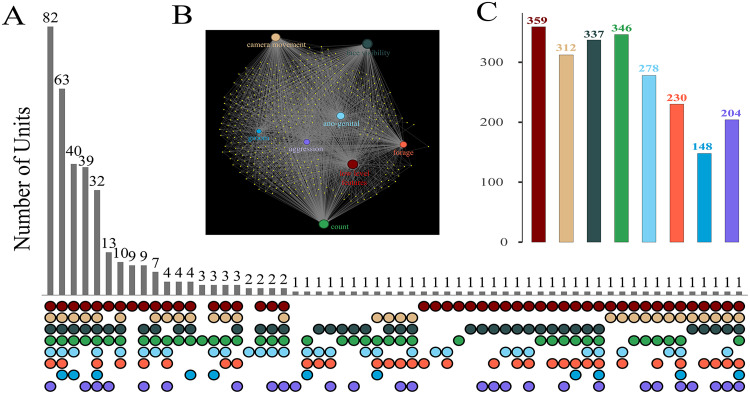
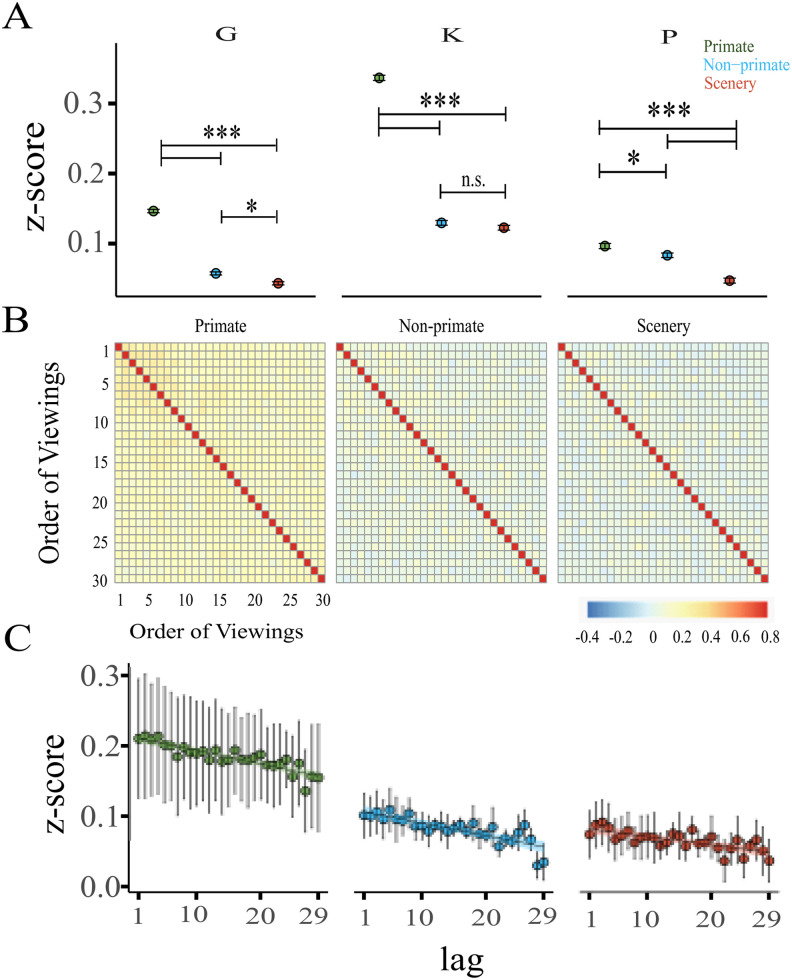
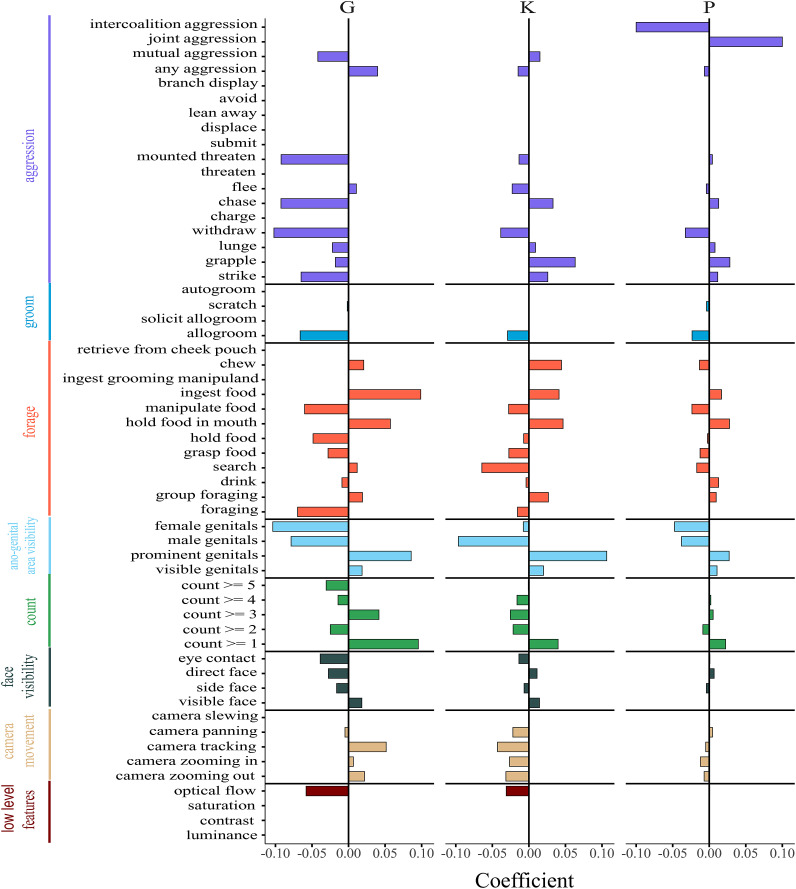
The dorsomedial posterior parietal cortex (dmPPC) is part of a higher-cognition network implicated in elaborate processes underpinning memory formation, recollection, episode reconstruction, and temporal information processing. Neural coding for complex episodic processing is however under-documented. Here, we recorded extracellular neural activities from three male rhesus macaques (Macaca mulatta) and revealed a set of neural codes of "neuroethogram" in the primate parietal cortex. Analyzing neural responses in macaque dmPPC to naturalistic videos, we discovered several groups of neurons that are sensitive to different categories of ethogram items, low-level sensory features, and saccadic eye movement. We also discovered that the processing of category and feature information by these neurons is sustained by the accumulation of temporal information over a long timescale of up to 30 s, corroborating its reported long temporal receptive windows. We performed an additional behavioral experiment with additional two male rhesus macaques and found that saccade-related activities could not account for the mixed neuronal responses elicited by the video stimuli. We further observed monkeys' scan paths and gaze consistency are modulated by video content. Taken altogether, these neural findings explain how dmPPC weaves fabrics of ongoing experiences together in real time. The high dimensionality of neural representations should motivate us to shift the focus of attention from pure selectivity neurons to mixed selectivity neurons, especially in increasingly complex naturalistic task designs.

Keywords: dorsomedial posterior parietal cortex; information accumulation; mixed selective representation; neuroethology; scan path and gaze consistency; temporal receptive window.


Figures

Figure 1.
Figure 1.
Experimental procedure, recording sites, and feature selection with LASSO. A, Example video (a primate video) used in the study. Each day, the monkeys watched three different 30 s videos, each for 30 repetitions in 6 blocks. B, Reconstruction of recording sites (circled in red) overlaid on T1 images. C, D, We fitted a LASSO regression model with spike counts in a 40 ms time bin as a dependent variable and 52 ethogram items and 4 low-level features as regressors. The algorithm punishes the coefficient of less important variables to zero along with the gradual increase of parameter log(λ). A variable would be filtered out of the model when its coefficient is punished to zero. A 10-fold cross-validation procedure was used to determine the value of lambda as the model produced minimal mean squared errors (MSE). For example neuron #PC0087, the algorithm yielded an optimal model with 21 nonzero coefficient variables when log(λ) = –3.43. The red dashed lines represent the largest λ where the MSE is within one standard error of the minimal MSE. Solid curves in B refer to the coefficient path of variables. The numbers on top indicate the number of nonzero coefficient variables in the optimal model. E, A set of nonzero coefficient variables produced by the model at minimal MSE. F, For validation of the optimal model, a regression model, built with 80% training dataset to test 20% testing dataset, showed a significant prediction ability (F(1, 450) = 121.5, R2 = 0.213, slope = 0.200). G, Ethogram descriptions are presented for each video, with cells colored based on event frequency, denoting the number of frames corresponding to each specific event.
Figure 2.
Figure 2.
Neuron classification. AG, Raster plots (left panels) of reordered trials (left axes) overlaid by spike density histograms with 100 ms Gaussian kernel smoothing (right axes) and firing rate comparisons (right panels) of seven representative neurons responding to different video content types. All show a significantly higher firing rate during video viewing than pre/before and post/after video presentation (p < 0.05). In raster plots, the x-axis indicates the time course of the video, and vertical lines represent the onset or offset of the video display; each row is associated with a trial. Trials are re-ranked by video content types (yellow, scenery; blue, nonprimate; green, primate). Three example content-sensitive neurons showed significantly higher firing rates to primate (A, #PC0056, primate), nonprimate (B, #PC0040, nonprimate), and scenery (C, #PC0114, scenery) content type. Firing rates of three content-sensitive neurons exhibited the lowest activity to primate (D, #PC0232, nonprimate–scenery), nonprimate (E, #PC0205, primate–scenery), and scenery (F, #PC0249, primate–nonprimate) content types. G, A content-insensitive example neuron (#PC0192) exhibited equal firing rates across different video content types. ⊗: significant phase (pre, viewing, post) × category (primate, nonprimate, scenery) two-way interactions (p < 0.05). Colored rectangle: significantly higher firing rates during the viewing phase. Error bars: SEM. *p < 0.05, **p < 0.01, ***p < 0.001.
Figure 3.
Figure 3.
dmPPC neurons respond to social and nonsocial events in videos. A, Effects of neuronal responses to 4 low-level features (dark red) and 52 ethogram items (7 categories of the ethogram organized by 7 different colors) obtained by a LASSO regression analysis. Each row stands for an item out of all 56 items, while each column refers to one neuron. Blue dashed lines showed neurons acquired from three different monkeys (J = Jupiter, M = Mercury, G = Galen). B, Proportion of neurons responsive to each item. The blue dashed line indicates the chance level. C, LASSO coefficient for each item tested against zero. Error bars: SEM over neurons. *p < 0.05, **p < 0.01.
Figure 4.
Figure 4.
Quantitative effect of selected features on seven types of content-related neurons. One-sample t tests were used to assess the consistency of the modulation for each selected feature to subgroup neurons. A, Primate (P) units were positively modulated by optical flow (t(49) = 3.092, p < 0.01, Cohen’s D = 0.437), side face (t(31) = 4.067, p < 0.001, Cohen’s D = 0.719), prominent genitals (t(38) = 3.374, p < 0.01, Cohen’s D = 0.540), holding fold in mouth (t(36) = 3.506, p < 0.01, Cohen’s D = 0.576), chew (t(17) = 2.159, p < 0.05, Cohen’s D = 0.509), allogroom (t(16) = 2.663, p < 0.05, Cohen’s D = 0.646), and grapple (t(7) = 4.101, p < 0.01, Cohen’s D = 1.450), while negatively modulated by camera tracking (t(48) = −2.758, p < 0.01, Cohen’s D = 0.394), visible face (t(36) = −3.669, p < 0.001, Cohen’s D = 0.603), and group foraging (t(17) = −2.381, p < 0.05, Cohen’s D = 0.561). B, Activity of nonprimate–scenery (Np&S) neurons were boosted by the behaviors of camera panning (t(9) = 3.410, p < 0.01, Cohen’s D = 1.078) and animal count >5 (t(10) = 2.382, p < 0.05, Cohen’s D = 0.718) but lowered by the chewing behavior (t(1) = −15.016, p < 0.05, Cohen’s D = 10.618). C, Nonprimate (N) neurons responded more to video saturation (t(7) = 2.650, p < 0.05, Cohen’s D = 0.883) and animal count >1 (t(6) = 2.899, p < 0.05, Cohen’s D = 1.096) but responded less to the occurrence of optical flow (t(9) = −3.398, p < 0.01, Cohen’s D = 1.075), allogroom (t(1) = −285.532, p < 0.01, Cohen’s D = 201.902), and chase (t(1) = −104.730, p < 0.01, Cohen’s D = 74.055). D, No consistent activation of primate–scenery (P&S) units to dimensional video contents (p > 0.25). E, Responses of scenery (S) units were slightly suppressed to luminance (t(14) = −3.030, p < 0.01, Cohen’s D = 0.783). F, Animal count >1 (t(4) = 2.965, p < 0.05, Cohen’s D = 1.326) increased activation of a subgroup of primate–nonprimate (P&Np) neurons. G, Behaviors of eye contact (t(151) = 3.798, p < 0.001, Cohen’s D = 0.308), mounted threaten (t(30) = 2.180, p < 0.05, Cohen’s D = 0.392), and any aggression (t(86) = 2.142, p < 0.05, Cohen’s D = 0.230) positively evoked content-insensitive (CI) units’ firing, while foraging (t(36) = −2.695, p < 0.05, Cohen’s D = 0.443), holding food (t(29) = −2.409, p < 0.05, Cohen’s D = 0.440), and chase (t(30) = −2.396, p < 0.05, Cohen’s D = 0.430) significantly decreased CI responses. Colors (in AG) refer to the labels of item categories shown on the left side. Error bars: SEM. *p < 0.05, **p < 0.01, ***p < 0.001.
Figure 5.
Figure 5.
Neural activity in dmPPC cannot be accounted for by saccadic eye movements. For Monkey Galen eye movements were monitored with EyeLink 1000 Plus, and neural activities were recorded simultaneously during free viewing, we identified trial-by-trial saccadic eye movements and set saccadic as the 57th feature to evaluate the neural modulation by eye movement. A, Effects of neuronal responses to saccadic eye movements and 56-item ethograms obtained from LASSO regression trial-by-trial. B, Proportion of neurons responsive to each item. C, LASSO coefficient for each item tested against zero. The proportion and coefficient of neurons responding to each of the 56 key items showed no statistical difference from those when no saccadic data were included as a feature. Error bars: SEM across neurons. *p < 0.05, **p < 0.01, ***p < 0.001.
Figure 6.
Figure 6.
dmPPC neurons demonstrate mixed selectivity representations. A, Distribution of neurons and their composition for mixed selectivity representations. Gray bars show the numbers of units exclusively modulated by combinations of mixed ethogram features, with their composition shown in the bottom panel. Color coding here is the same as Figures 2 and 3B. B, Demonstration for dmPPC cell ensembles for their mixed selectivity coding. Each small yellow dot denotes a neuron. The eight circles with labels refer to the eight feature categories (low-level features and seven ethogram categories), with their size proportional to the number of neurons modulated by that category. The connecting lines refer to the relationship between neurons and feature categories. C, Number of neurons that responded to each of the ethogram categories. For example, the category “camera movement” including multiple camera motions modulates the discharge of about 83.20% (312/375) percentage of all units. The category “count,” which is the number of animals visible, influenced a significant portion of all units (92.27%, 346/375).
Figure 7.
Figure 7.
Relationship between mixed selectivity representation and individual neuronal decoding performance. A, A total of 153 valid neurons showed significant video content-type decoding ability. Error bars refer to the averaged prediction accuracy across neurons. The number over each bar refers to the number of neurons with video content decoding ability of the corresponding neuron type. Labels of the x-axis for each neuron type are the same as in Figure 4. The numerals above bars refer to the number of neurons with successful video content-type decoding ability of a given neuron group (Figs. 2, 4). B, Neurons with valid decoding performance (greater than the significant statistical threshold, valid neurons) demonstrated better decoding performance than invalid neurons (lower than the statistical threshold). C, Valid neurons showed higher decoding performance to primate content types in comparison to nonprimate and scenery content types. D, Valid neurons implicated more features than invalid neurons. E, The number of selected features was significantly related to individual neuron’s overall content-type discriminability across all the valid neurons. F, This relationship is significant for primate video content (left panel) but not for nonprimate (middle panel) or scenery (right panel) video content types. Lines represent linear regression of all valid neurons. Dots refer to valid neurons. Error bars: SEM across neurons. ***p < 0.001.
Figure 8.
Figure 8.
dmPPC neurons accumulate temporal information with long temporal receptive windows. A, The decoding performance of the example neuron (#PC0221) positively correlates with cumulative spiking sequences (light green) but not with momentary neural activity (yellow). We used two sets of SVM decoding exercises to verify this property. First, we used cumulative spikes in 1 s time bins for the 1st to 30th timepoint (accumulated sequence; light green) and compared it to the significant statistical threshold (dark green). Second, we used spikes in each individual time point (yellow) and compared them with the permuted significant statistical threshold (dark red). The four lines represent linear regression for these four SVMs for an example neuron. The dots refer to the decoding performance of each time point for cumulative and momentary conditions. B, A Sequence (Accumulative/Individual) × Approach (Real/Shuffle) two-way ANOVA revealed that the mean slope of population neurons (n = 57) was higher for real and cumulative sequences than for both shuffled control data and individual 1 s time binned spike data (p < 0.001). C, The decoding performance for each video content positively correlates with cumulative spiking sequences. D, One-way ANOVA and post hoc analysis revealed that neurons in dmPPC had fast accumulation speed for primate video contents. × indicates the sequence–approach two-way interaction. Error bars: SEM across neurons. ***p < 0.001. ns, not significant.
Figure 9.
Figure 9.
Scan paths across viewings remain most steady for primate video content type. A, Monkeys showed higher scan-path similarities across viewing repetitions for primate than for nonprimate and scenery videos (Galen, F(2, 1302) = 588.808, p < 0.001, η2 = 0.475; tPrimate–Nonprimate = 27.288, p < 0.001, Cohen’s D = 1.850; tPrimate–Scenery = 31.664, p < 0.001, Cohen’s D = 2.147; tNonprimate–Scenery = 4.376, p < 0.001, Cohen’s D = 0.297; monkey K, F(2, 1302) = 1228.672, p < 0.001, η2 = 0.654; tPrimate–Nonprimate = 42.212, p < 0.001, Cohen’s D = 2.862; tPrimate–Scenery = 43.615, p < 0.001, Cohen’s D = 2.957; tNonprimate–Scenery = 1.403, p = 0.340, Cohen’s D = 0.095; monkey P, F(2, 1302) = 52.018, p < 0.001, η2 = 0.074; tPrimate–Nonprimate = 2.620, p = 0.024, Cohen’s D = 0.178; tPrimate–Scenery = 9.847, p < 0.001, Cohen’s D = 0.688; tNonprimate–Scenery = 7.227, p < 0.001, Cohen’s D = 0.490). Error bars: SEM across repetitions. B, Heatmaps of averaged pairwise scan-path correlations of the three monkeys, showing significantly higher correlation for the Primate content-type eye data. C, Scan-path similarity plotted as a function of repetition lag. Error bars in C refer to SEM across monkeys. ***p < 0.001; *p < 0.05; n.s., not significant.
Figure 10.
Figure 10.
Monkeys’ gaze consistency modulated by the video features. Bars denote the nonzero coefficients chosen by the LASSO feature selection algorithm. Positive coefficients indicate items that result in high consistency across viewings whereas negative coefficients refer to low consistency across viewings. The three monkeys showed high agreement for a majority of items.

Similar articles

Cited by

References

    1. Adams G (2014) Tinbergen alpha. Release 1. 10.5281/zenodo.13009. http://zenodo.org/record/13009#.VNj3Ji7w-7A - DOI
    1. Adams GK, Ong WS, Pearson JM, Watson KK, Platt ML (2021) Neurons in primate prefrontal cortex signal valuable social information during natural viewing. Philos Trans R Soc B 376:20190666. 10.1098/rstb.2019.0666 - DOI - PMC - PubMed
    1. Andersen RA, Bracewell RM, Barash S, Gnadt JW, Fogassi L (1990) Eye position effects on visual, memory, and saccade-related activity in areas LIP and 7a of macaque. J Neurosci 10:1176–1196. 10.1523/JNEUROSCI.10-04-01176.1990 - DOI - PMC - PubMed
    1. Andersen R, Essick G, Siegel R (1987) Neurons of area 7 activated by both visual stimuli and oculomotor behavior. Exp Brain Res 67:316–322. 10.1007/BF00248552 - DOI - PubMed
    1. Andric M, Goldin-Meadow S, Small SL, Hasson U (2016) Repeated movie viewings produce similar local activity patterns but different network configurations. Neuroimage 142:613–627. 10.1016/j.neuroimage.2016.07.061 - DOI - PubMed

Publication types

LinkOut - more resources