. 2023 Sep 22;24(6):bbad418.
doi: 10.1093/bib/bbad418.

PanomiR: a systems biology framework for analysis of multi-pathway targeting by miRNAs

Affiliations

PanomiR: a systems biology framework for analysis of multi-pathway targeting by miRNAs

Pourya Naderi Yeganeh et al. Brief Bioinform. .

Abstract

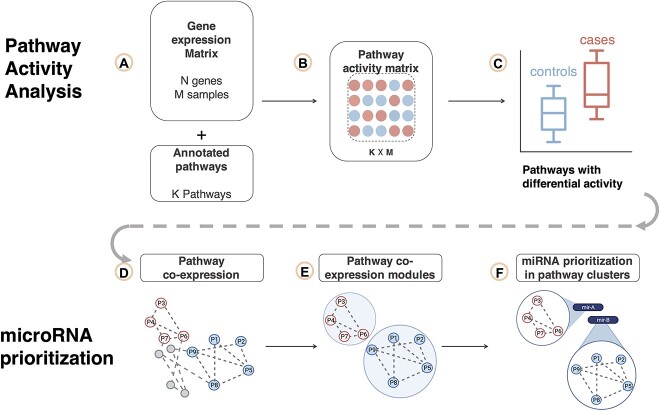
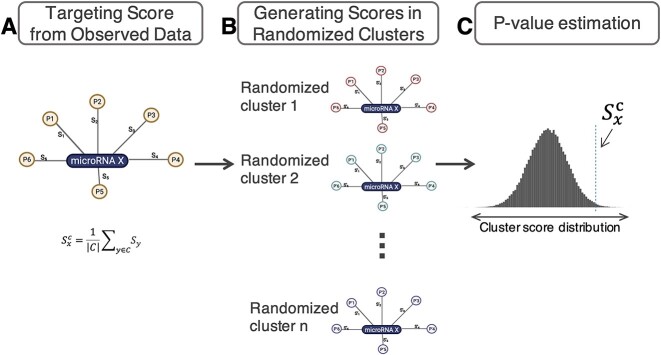
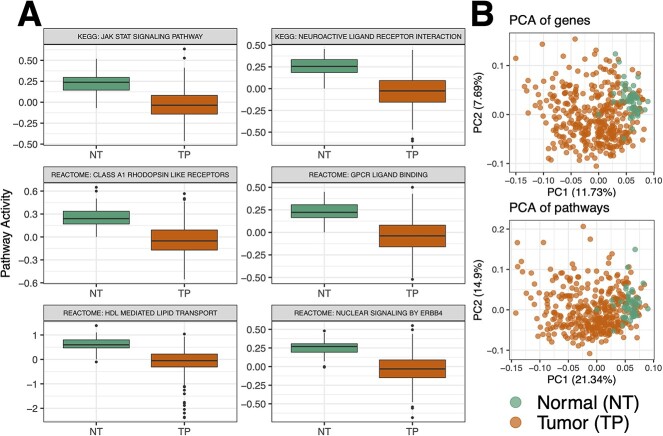
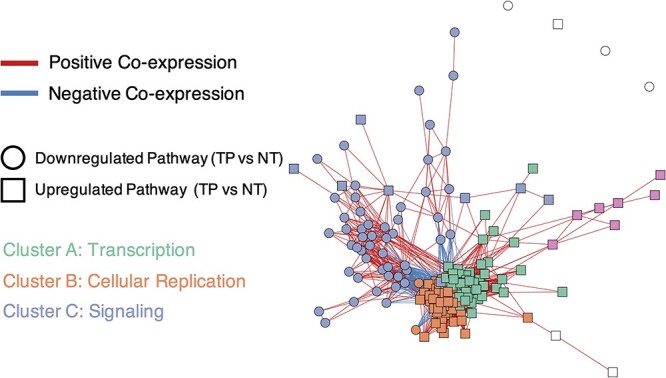
Charting microRNA (miRNA) regulation across pathways is key to characterizing their function. Yet, no method currently exists that can quantify how miRNAs regulate multiple interconnected pathways or prioritize them for their ability to regulate coordinate transcriptional programs. Existing methods primarily infer one-to-one relationships between miRNAs and pathways using differentially expressed genes. We introduce PanomiR, an in silico framework for studying the interplay of miRNAs and disease functions. PanomiR integrates gene expression, mRNA-miRNA interactions and known biological pathways to reveal coordinated multi-pathway targeting by miRNAs. PanomiR utilizes pathway-activity profiling approaches, a pathway co-expression network and network clustering algorithms to prioritize miRNAs that target broad-scale transcriptional disease phenotypes. It directly resolves differential regulation of pathways, irrespective of their differential gene expression, and captures co-activity to establish functional pathway groupings and the miRNAs that may regulate them. PanomiR uses a systems biology approach to provide broad but precise insights into miRNA-regulated functional programs. It is available at https://bioconductor.org/packages/PanomiR.

Keywords: bioinformatics; biological networks; computational biology; miRNA prioritization; miRNA regulation; microRNA; pathway analysis; pathways; statistical models; systems biology.


Figures

Figure 1
Figure 1
PanomiR workflow. PanomiR prioritizes miRNAs that target coordinate groups of pathways. (A) Input gene expression data set and a set of annotated pathways. (B) Gene expression data are summarized into pathway activity scores. (C) Pathway activity profiles are compared between disease and control subjects to discover differentially regulated pathways. (D) Differentially regulated pathways are mapped to the canonical PCxN, where nodes denote pathways and the edges denote correlation of activity scores. (E) Within the network of differentially regulated pathways, modules of coordinate pathways are identified using graph clustering algorithms. (F) miRNAs are prioritized using annotated miRNA–mRNA interactions (known or predicted) for preferential targeting within each cluster of differentially regulated pathways. The outputs of the pipeline are individual lists of miRNAs with prioritization scores (targeting P-values) per each cluster of pathways.
Figure 2
Figure 2
miRNA prioritization from pathway clusters. (A) PanomiR generates an observed targeting statistic, 𝑆𝑥c, for a miRNA X with respect to C, an observed cluster of pathways. The cluster-targeting statistic is an average individual overlap score for each miRNA-pathway pair. Individual overlap scores (e.g., S1, S2) are functions (inverse normal) of the overlap statistic (Fisher’s exact test) between the miRNA target genes and the pathway member genes (B) PanomiR generates an empirical distribution of cluster-targeting scores for a miRNA X by randomly selecting a set of pathways and recalculating the cluster-targeting score. (C) The prioritization P-value is calculated by comparing the observed targeting statistic, Sxc, to the null distribution of the targeting scores of miRNA X. The P-value is used to rank the miRNAs.
Figure 3
Figure 3
Pathway activity analysis of the Liver Hepatocellular Carcinoma data set from the Cancer Genome Atlas. (A) Detection of differentially regulated liver cancer pathways by comparison of pathway activity profiles between normal tissues adjacent to tumors (NT) and tumor primary (TP) samples from TCGA data. Boxplots show the most significant differentially regulated pathways selected based on P-values of difference between NT and TP (Table 2). (B) Principal component analysis (PCA) projection of the samples based on either all genes or all pathways. Pathway summarization in PanomiR allows to analyze the activity of pathways in a continuum. PCA of pathways conserves sample groups and captures a higher variation compared to the PCA of genes.
Figure 4
Figure 4
PanomiR deconvolutes coordinate clusters of differentially regulated pathways in liver cancer. The network displays a pathway co-expression map of liver cancer pathways. PanomiR detected three major groups of pathways, defined by the direction of differential regulation and clusters of coexpression. The three classes are (i) activation of transcription in tumors (cluster A); (ii) activation of cellular replication (cluster B); and (iii) deactivation of specific signaling pathways (cluster C). Each node in the network represents a differentially regulated pathway (Table 2). Edges represent canonical coexpression between two pathways, obtained from an independent compendium of gene expression data, derived from the PCxN method. Node colors represent unsupervised network clusters found by the Louvain algorithm. Clusters were manually labeled according to the functional consensus of their pathways.
Figure 5
Figure 5
Unbiased prioritization of miRNAs by PanomiR. PanomiR prioritizes miRNAs with either a small or large number of annotated targets. In contrast, enrichment-based miRNA-prioritization methods are biased toward prioritization of miRNAs with larger numbers of gene targets. The figure displays correlation analysis of miRNA-prioritization rankings with the number of gene targets in Cluster A of the liver cancer data set. Each point represents a miRNA annotated in the TarBase database. (A) Spearman correlation analysis did not find a significant association between the number of targets and the prioritization ranking of miRNAs by PanomiR (correlation −0.03). (B) The number of enriched pathways for a miRNA significantly correlated with its number of gene targets. We also observed a significant correlation between the number of a miRNA’s targets and its prioritization ranking based on (C) Stouffer’s method and (D) Fisher’s method for aggregation of enrichment P-value. X-axes denote the log number of gene targets of miRNAs based on experimentally validated miRNA–mRNA interactions from the TarBase database. The y-axis in (B) represents the number of significantly enriched pathways (Adjusted P-value < 0.25, Table 3).

References

    1. Friedman RC, Farh KK-H, Burge CB, et al. Most mammalian mRNAs are conserved targets of microRNAs. Genome Res 2009;19:92–105. - PMC - PubMed
    1. Slack FJ, Chinnaiyan AM. The role of non-coding RNAs in oncology. Cell 2019;179:1033–55. - PMC - PubMed
    1. Cai Y, Yu X, Hu S, et al. A brief review on the mechanisms of miRNA regulation. Genomics Proteomics Bioinformatics 2009;7:147–54. - PMC - PubMed
    1. Wilk G, Braun R. Integrative analysis reveals disrupted pathways regulated by microRNAs in cancer. Nucleic Acids Res 2018;46:1089–101. - PMC - PubMed
    1. Cui Q, Yu Z, Purisima EO, et al. Principles of microRNA regulation of a human cellular signaling network. Mol Syst Biol 2006;2:46. - PMC - PubMed

Publication types

MeSH terms