

Predicting gene regulatory links from single-cell RNA-seq data using graph neural networks
- PMID: 37985457
- PMCID: PMC10661972
- DOI: 10.1093/bib/bbad414
Predicting gene regulatory links from single-cell RNA-seq data using graph neural networks
Abstract
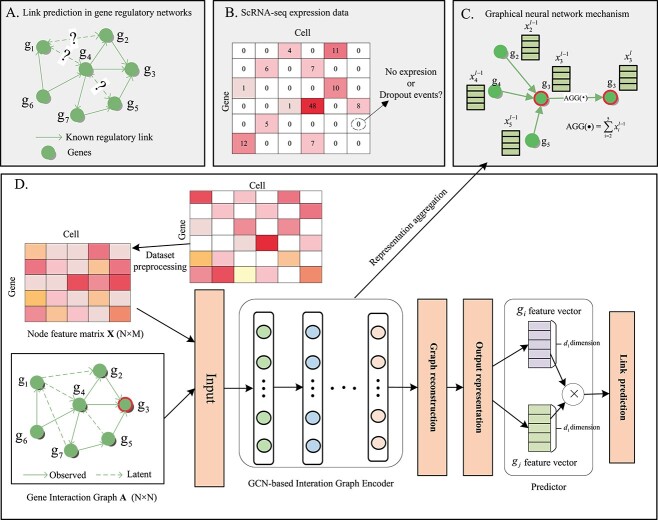
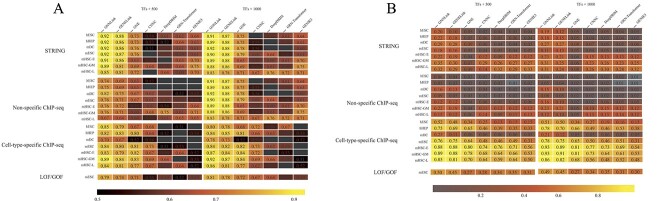
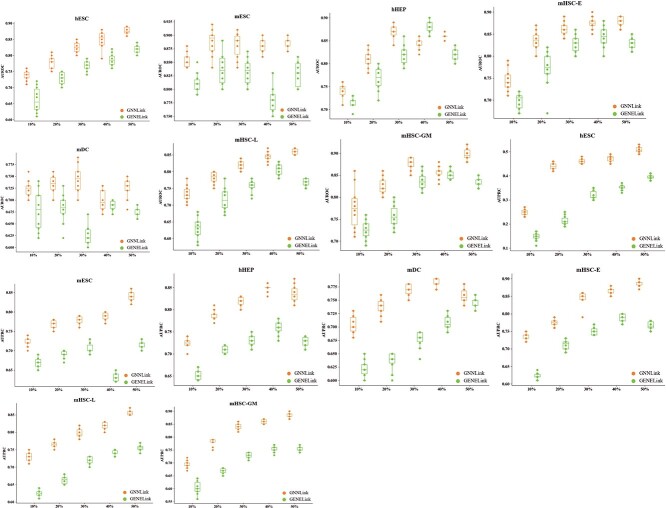
Single-cell RNA-sequencing (scRNA-seq) has emerged as a powerful technique for studying gene expression patterns at the single-cell level. Inferring gene regulatory networks (GRNs) from scRNA-seq data provides insight into cellular phenotypes from the genomic level. However, the high sparsity, noise and dropout events inherent in scRNA-seq data present challenges for GRN inference. In recent years, the dramatic increase in data on experimentally validated transcription factors binding to DNA has made it possible to infer GRNs by supervised methods. In this study, we address the problem of GRN inference by framing it as a graph link prediction task. In this paper, we propose a novel framework called GNNLink, which leverages known GRNs to deduce the potential regulatory interdependencies between genes. First, we preprocess the raw scRNA-seq data. Then, we introduce a graph convolutional network-based interaction graph encoder to effectively refine gene features by capturing interdependencies between nodes in the network. Finally, the inference of GRN is obtained by performing matrix completion operation on node features. The features obtained from model training can be applied to downstream tasks such as measuring similarity and inferring causality between gene pairs. To evaluate the performance of GNNLink, we compare it with six existing GRN reconstruction methods using seven scRNA-seq datasets. These datasets encompass diverse ground truth networks, including functional interaction networks, Loss of Function/Gain of Function data, non-specific ChIP-seq data and cell-type-specific ChIP-seq data. Our experimental results demonstrate that GNNLink achieves comparable or superior performance across these datasets, showcasing its robustness and accuracy. Furthermore, we observe consistent performance across datasets of varying scales. For reproducibility, we provide the data and source code of GNNLink on our GitHub repository: https://github.com/sdesignates/GNNLink.
Keywords: gene regulatory networks (GRNs); graph convolutional network; graph neural network; link prediction.
© The Author(s) 2023. Published by Oxford University Press.
Figures
Similar articles
-
GRLGRN: graph representation-based learning to infer gene regulatory networks from single-cell RNA-seq data.BMC Bioinformatics. 2025 Apr 18;26(1):108. doi: 10.1186/s12859-025-06116-1. BMC Bioinformatics. 2025. PMID: 40251476 Free PMC article.
-
Graph attention network for link prediction of gene regulations from single-cell RNA-sequencing data.Bioinformatics. 2022 Sep 30;38(19):4522-4529. doi: 10.1093/bioinformatics/btac559. Bioinformatics. 2022. PMID: 35961023
-
Prediction of Gene Regulatory Connections with Joint Single-Cell Foundation Models and Graph-Based Learning.bioRxiv [Preprint]. 2025 Jan 29:2024.12.16.628715. doi: 10.1101/2024.12.16.628715. bioRxiv. 2025. Update in: Bioinformatics. 2025 Jul 1;41(Supplement_1):i619-i627. doi: 10.1093/bioinformatics/btaf217. PMID: 39975293 Free PMC article. Updated. Preprint.
-
Leveraging prior knowledge to infer gene regulatory networks from single-cell RNA-sequencing data.Mol Syst Biol. 2025 Mar;21(3):214-230. doi: 10.1038/s44320-025-00088-3. Epub 2025 Feb 12. Mol Syst Biol. 2025. PMID: 39939367 Free PMC article. Review.
-
A review on gene regulatory network reconstruction algorithms based on single cell RNA sequencing.Genes Genomics. 2024 Jan;46(1):1-11. doi: 10.1007/s13258-023-01473-8. Epub 2023 Nov 30. Genes Genomics. 2024. PMID: 38032470 Review.
Cited by
-
Constructing the dynamic transcriptional regulatory networks to identify phenotype-specific transcription regulators.Brief Bioinform. 2024 Sep 23;25(6):bbae542. doi: 10.1093/bib/bbae542. Brief Bioinform. 2024. PMID: 39451156 Free PMC article.
-
DeepGRNCS: deep learning-based framework for jointly inferring gene regulatory networks across cell subpopulations.Brief Bioinform. 2024 May 23;25(4):bbae334. doi: 10.1093/bib/bbae334. Brief Bioinform. 2024. PMID: 38980373 Free PMC article.
-
HGATLink: single-cell gene regulatory network inference via the fusion of heterogeneous graph attention networks and transformer.BMC Bioinformatics. 2025 Feb 11;26(1):49. doi: 10.1186/s12859-025-06071-x. BMC Bioinformatics. 2025. PMID: 39934680 Free PMC article.
-
GRLGRN: graph representation-based learning to infer gene regulatory networks from single-cell RNA-seq data.BMC Bioinformatics. 2025 Apr 18;26(1):108. doi: 10.1186/s12859-025-06116-1. BMC Bioinformatics. 2025. PMID: 40251476 Free PMC article.
-
Inferring gene regulatory networks with graph convolutional network based on causal feature reconstruction.Sci Rep. 2024 Sep 12;14(1):21342. doi: 10.1038/s41598-024-71864-8. Sci Rep. 2024. PMID: 39266676 Free PMC article.
References
-
- Wu X, Zhou Y. GE-impute: graph embedding-based imputation for single-cell RNA-seq data. Brief Bioinform 2022; 23(5): bbac313. - PubMed
-
- Zhao M, He W, Tang J, et al. .. A comprehensive overview and critical evaluation of gene regulatory network inference technologies. Brief Bioinform 2021; 22(5): bbab009. - PubMed
-
- Zhang S, Stumpf M. Learning cell-specific networks from dynamical single cell data. bioRxiv 2023. https://api.semanticscholar.org/CorpusID:257718292.
Publication types
MeSH terms
LinkOut - more resources
Full Text Sources
Miscellaneous
