. 2023 Nov 20;14(1):7461.
doi: 10.1038/s41467-023-43053-0.

Early-to-mid stage idiopathic Parkinson's disease shows enhanced cytotoxicity and differentiation in CD8 T-cells in females

Affiliations

Early-to-mid stage idiopathic Parkinson's disease shows enhanced cytotoxicity and differentiation in CD8 T-cells in females

Christophe M Capelle et al. Nat Commun. .

Abstract

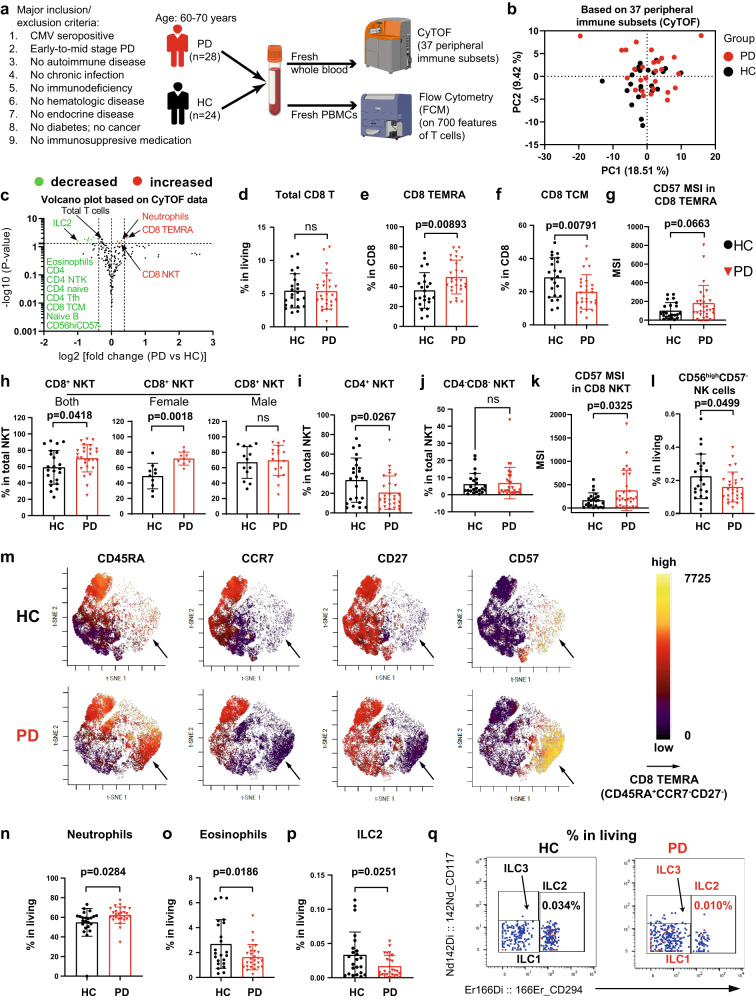
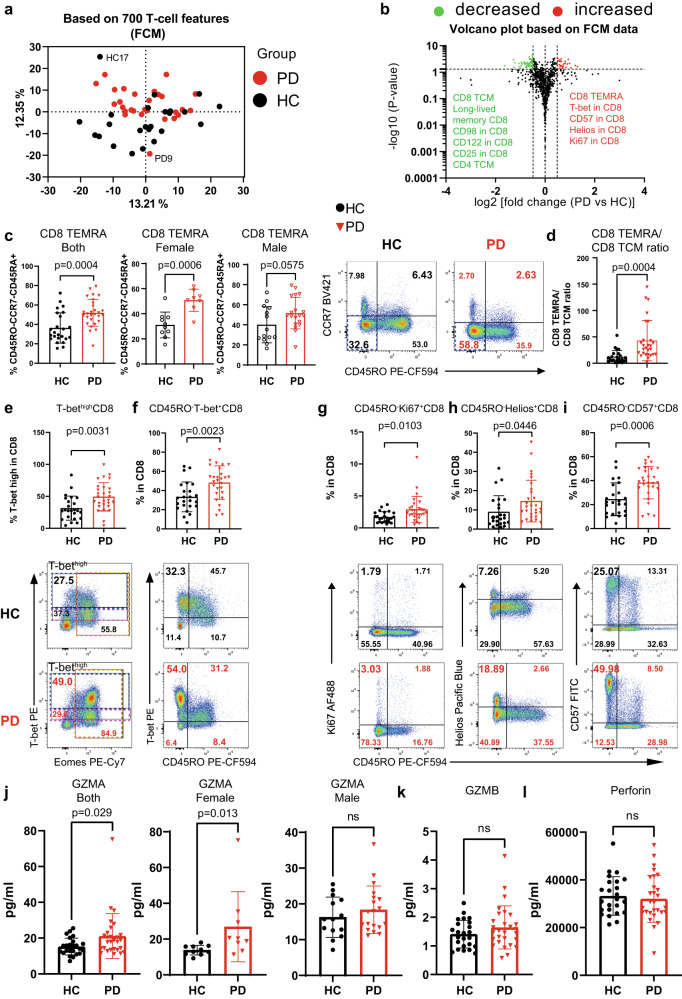
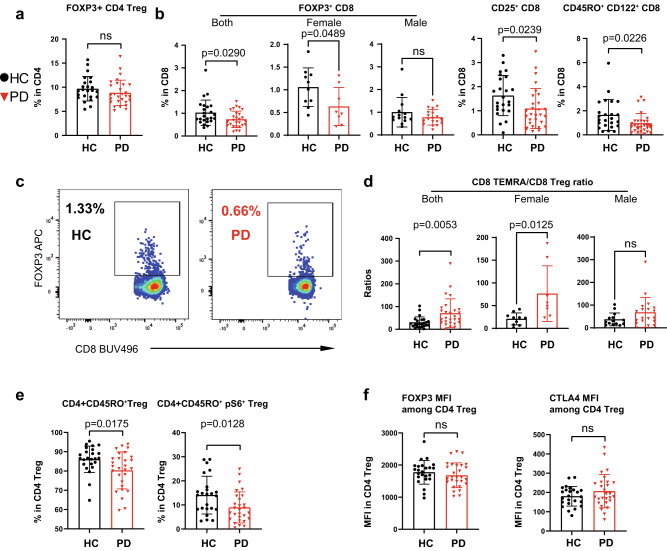
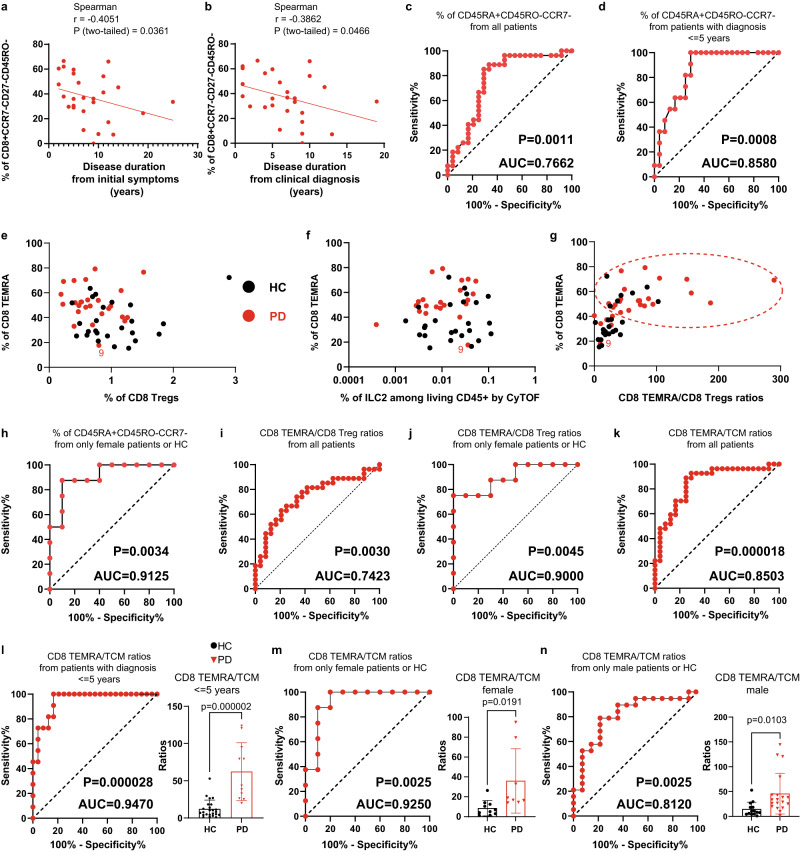
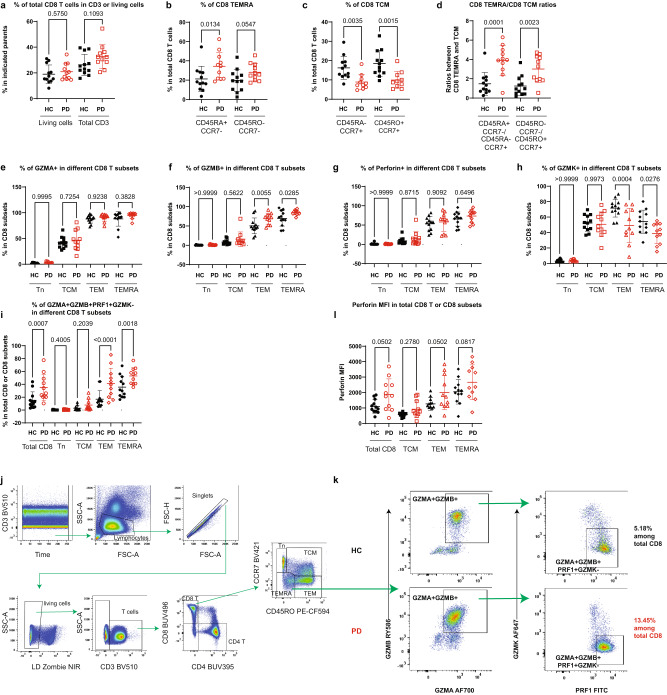
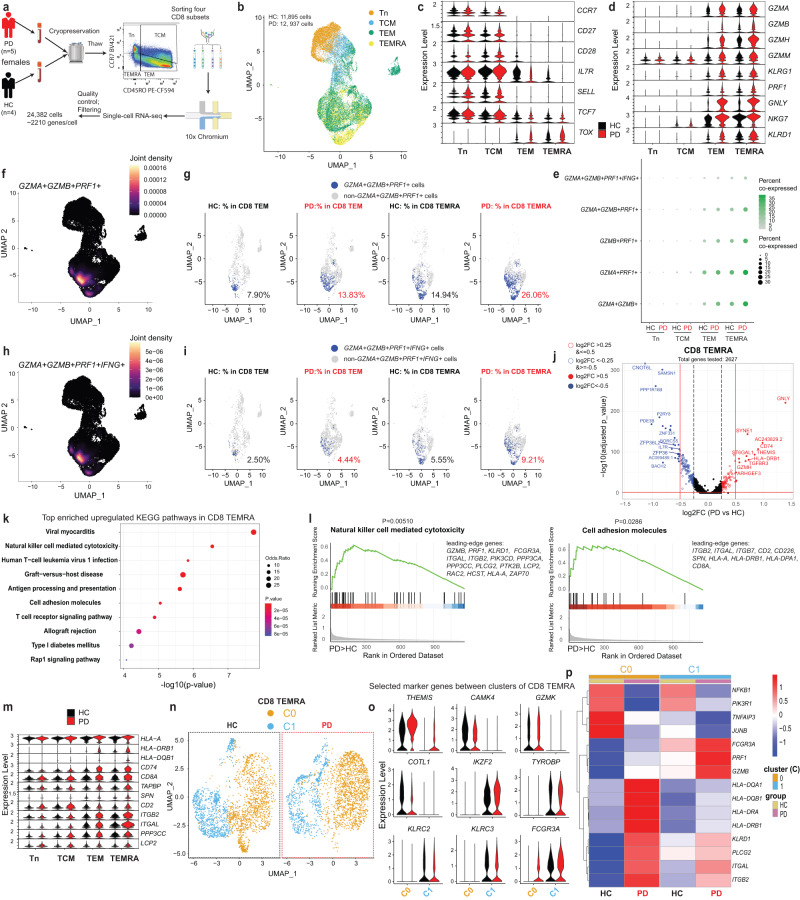
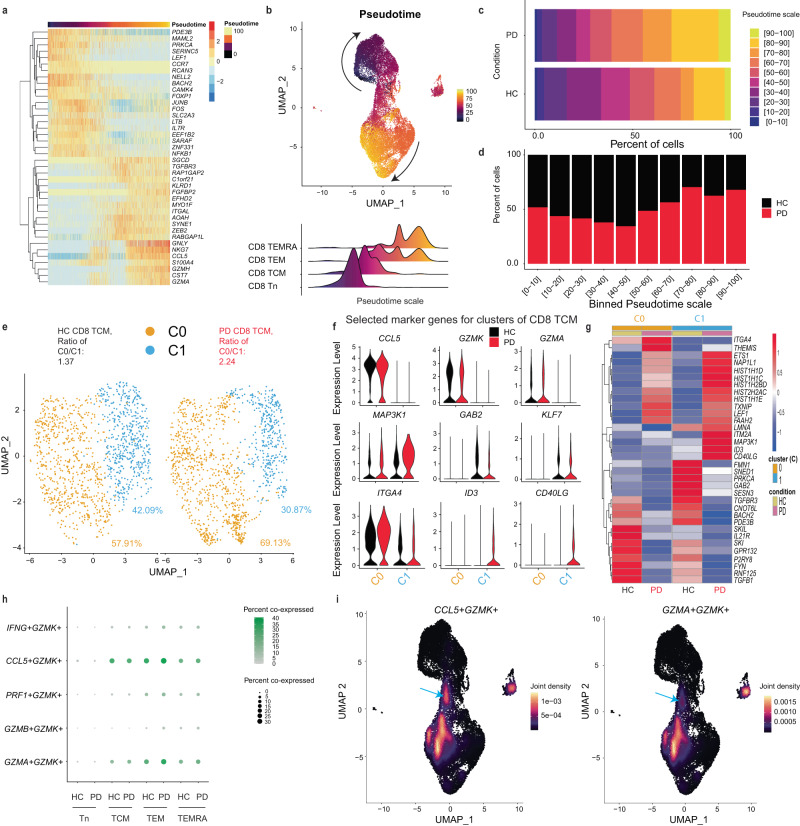
Neuroinflammation in the brain contributes to the pathogenesis of Parkinson's disease (PD), but the potential dysregulation of peripheral immunity has not been systematically investigated for idiopathic PD (iPD). Here we showed an elevated peripheral cytotoxic immune milieu, with more terminally-differentiated effector memory (TEMRA) CD8 T, CD8+ NKT cells and circulating cytotoxic molecules in fresh blood of patients with early-to-mid iPD, especially females, after analyzing > 700 innate and adaptive immune features. This profile, also reflected by fewer CD8+FOXP3+ T cells, was confirmed in another subcohort. Co-expression between cytotoxic molecules was selectively enhanced in CD8 TEMRA and effector memory (TEM) cells. Single-cell RNA-sequencing analysis demonstrated the accelerated differentiation within CD8 compartments, enhanced cytotoxic pathways in CD8 TEMRA and TEM cells, while CD8 central memory (TCM) and naïve cells were already more-active and transcriptionally-reprogrammed. Our work provides a comprehensive map of dysregulated peripheral immunity in iPD, proposing candidates for early diagnosis and treatments.


Conflict of interest statement

Pending patent application on the protection of biomarkers for Parkinson’s disease (patent applicant: Luxembourg Institute of Health; inventors: F.Q.H., M.O. and R.K.; EP Patent Application No. 23203381.1 entitled “Early biomarker for Parkinson’s disease”). The remaining authors of this work declare no competing interests.

Figures

Fig. 1
Fig. 1. Single-cell CyTOF analysis shows a more-cytotoxic and late-differentiated immune profile in early-to-mid stage iPD.
a Graphical representation of the cohort and experimental setup. b PCA plot showing no distinct immunological fingerprint of PD based on the entire peripheral immune system. c Volcano plot highlighting the most significantly (p < 0.05, fold change >1.3) decreased and increased subsets in PD vs HC. The horizontal dashed line corresponds to –log10(0.05), while the two vertical dashed lines correspond to log2 value of −0.3785 or 0.3785. The marker definition for some of the highlighted subsets is provided here or other panels: CD4 naive (CD45RA+CCR7+), CD4 Tfh (CD45RA-CXCR5+) and naive B (IgD+CD27-) (Supplementary Fig. 1). Scatter dot plots showing the frequency of total CD8 T cells (d), CD8 CD45RA+CCR7- (the simplified gating for TEMRA) (e), CD8 TCM (CD45RACCR7+, central memory) (f) and CD57 MSI in CD8 TEMRA (g). Scatter dot plots showing the frequency of CD8+ NKT (CD8+CD4-CD3+CD19-CD56+TCRgd, h), CD4+ NKT (CD8-CD4+CD3+CD19-CD56+TCRgd, i) and CD4-CD8- (DN) NKT (CD8CD4CD3+CD19CD56+TCRgd, j) and CD57 MSI in total NKT (k). l, Frequency of CD56hiCD57- immature NK cells. m Representative viSNE plot from either HC or PD highlighting the expression levels of CD45RA, CCR7, CD27 and CD57 in total CD8 T cells. The arrow indicates the area of CD8 CD45RA+CCR7-CD27 (TEMRA). Scatter dot plots showing the frequency of neutrophils (CD66b+CD45midCD16+CD294, n), eosinophils (CD66b+CD45midCD16-CD294+, o) and innate lymphoid cell type 2 (ILC2, p). q Representative cytometry plots showing the expression of CD294 and CD117. The number showing the frequency among living CD45+ singlets. The results in (c–l, n–p) were analyzed using unpaired two-tailed Student’s t test without adjustments for multiple comparisons. Data are presented as mean ± standard deviation (s.d.). Each symbol represents the measurement from one individual (d–l, n–p). ns or unlabeled, not significant; all significant P-values are indicated. CyTOF mass cytometry, CMV cytomegalovirus, NKT Natural killer T cells, PBMC peripheral blood mononuclear cells, HC healthy controls, n = 24, PD patients with Parkinson’s disease, n = 28; MSI Median signal intensity. Panel a was created with BioRender.com. Source data are provided as a Source Data file.
Fig. 2
Fig. 2. Early-to-mid stage iPD exhibits an increased effector profile in CD8 T cells.
a PCA plot showing a distinct immunological fingerprint of PD vs HC based on T-cell combinatorial features using the FCM analysis. b Volcano plot showing the most significantly (p < 0.05, fold change >1.4) decreased and increased subpopulations in PD vs HC. The horizontal dashed line corresponds to the value of 1.3 (p = 0.05), while the two vertical dashed lines correspond to the log2 value of −0.485 or 0.485 (fold change of 1.4). c Scatter dot plots (left) and representative FCM plots (right) showing the increase in CD8 TEMRA (CD45ROCD45RA+CCR7, the simplified gating strategy for TEMRA) for all (left) or females (middle) or males (right). The TEMRA gate was highlighted in blue dashed rectangle in FCM plots. The combination of markers used to define TEMRA was described in the y-axis title. d Scatter dot plots showing the ratios between CD8 TEMRA and CD8 TCM (CD45RO+CCR7+CD27+). e-i Scatter dot plots (upper) and representative FCM plots (lower) showing the frequency of T-bethigh (e), CD45ROT-bet+ (f), CD45ROKi67+ (g), CD45RO-Helios+ (h) and CD45RO-CD57+ (i) among CD8 T cells. In e, blue and magenta dashed rectangle highlights T-bethigh and T-betmid cells, respectively, while gold dashed rectangle shows Eomes+ cells. The percentage of the interest was enlarged. jl Serological levels of GZMA (j) for all (left) or females (middle) or males (right), GZMB (k) and perforin (l). The results in bi were analyzed using unpaired two-tailed Student’s t test while the results in jl were analyzed using unpaired two-tailed Mann–Whitney nonparametric test without adjustments for multiple comparisons. Data are presented as mean ± standard deviation (s.d.). Each symbol represents the measurement from one individual (c–l). ns or unlabeled, not significant; all significant P-values are indicated. HC healthy controls, n = 24; PD, patients with Parkinson’s disease, n = 28; FCM flow cytometry; GZMA/GZMB Granzyme A/B, TCM central memory. For c, d, j, female HC, n = 10; female PD, n = 8; male HC, n = 14; male PD, n = 19. Source data are provided as a Source Data file.
Fig. 3
Fig. 3. Early-to-mid stage iPD displays a reduction in CD8 Treg but not CD4 Treg.
a Scatter dot plot showing the frequency of FOXP3+ cells among CD4 T cells. b Scatter dot plots showing the frequency of FOXP3+ cells for all or females or males, CD25+ cells and CD122+ cells among CD8 T cells. c Representative FCM plots showing the reduced frequency of FOXP3+ CD8 T cells (CD8 Treg) in PD vs HC. d Scatter dot plots showing the ratio between CD8 TEMRA (CD45RO-CCR7CD27) and CD8 Treg for all (left) or females (middle) or males (right). e Scatter dot plots showing the frequency of CD45RO+ and CD45RO+pS6+ among CD4 Treg. f Scatter dot plots showing MFI of FOXP3 and CTLA4 among total CD4+FOXP3+ Treg. The results (a, b, df) were analyzed using unpaired two-tailed Student’s t test. Data are presented as mean ± standard deviation (s.d.). Each symbol represents the measurement from one individual (a, b, d–f). ns or unlabeled, not significant; all significant P-values are indicated. FCM flow cytometry, MFI geometric mean (geomean), Treg regulatory T cells, HC healthy controls, n = 24, PD patients with Parkinson’s disease, n = 28. For b and d, female HC, n = 10; female PD, n = 8; male HC, n = 14; male PD, n = 19. Source data are provided as a Source Data file.
Fig. 4
Fig. 4. CD8 TEMRA and the ratio between CD8 TEMRA and TCM are reliable periphery-accessible biomarkers for early-to-mid stage iPD.
Correlation between the frequency of CD8 TEMRA (CD45RO-CCR7CD27) and the disease duration from initial symptoms (a) or clinical diagnosis (b). Coefficient and P-value based on Spearman correlation (n = 28). ROC analysis based on the frequency of CD45RA+CD45ROCCR7 for all PD (n = 28) (c) or patients diagnosed within 5 years (n = 11) (d) vs all HC (n = 24). e The frequency of CD8 TEMRA (CD45RA+CD45ROCCR7) vs that of CD8 Treg. f The frequency of CD8 TEMRA (CD45RA+CD45ROCCR7) quantified by FCM vs the frequency of ILC2 quantified by CyTOF. g The frequency of CD8 (CD45RA+CD45ROCCR7) vs the ratios between CD8 TEMRA (CD45RO-CCR7CD27) and CD8 Treg. The dashed red circle highlights the PD-dominant area. h ROC analysis based on the frequency of CD8 TEMRA (CD45RA+CD45RO-CCR7-) only from female PD (n = 8) or HC (n = 10). i, j ROC analysis based on the ratios between the frequency of CD8 TEMRA (CD45RO-CCR7CD27) and of CD8 Treg, for all iPD (n = 28) vs HC (n = 24) (i) or with only female iPD (n = 8) and HC (n = 10) (j). k–n ROC analysis based on the ratios between the frequency of TEMRA (CD45RA+CD45ROCCR7) and of TCM (CD45RO+CCR7+CD27+), for all iPD (n = 28) (k) or patients diagnosed within 5 years (n = 11) (l) vs all HC (n = 24) or only from female (m) iPD (n = 8) and HC (n = 10) or only from male (n) iPD (n = 19) and HC (n = 14). The scatter dot plot was displayed in the right panels (l–n). P-values were based on unpaired two-tailed Student’s t test. Data are presented as mean ± standard deviation (s.d.). Each symbol represents one individual. All the PD (n = 28, where one female PD sample was excluded as the same patient visited twice within a short period) and HC (n = 24) were used unless specified. P-values displayed under each ROC analysis test the null hypothesis of the AUC = 0.50 with a two-tailed test. AUC area under curve, ILC2 type 2 innate lymphoid cells, ROC receiver operating characteristic, Treg regulatory T cells, TCM central memory. Source data are provided as a Source Data file.
Fig. 5
Fig. 5. Validation of the enhanced CD8 TEMRA portion in another subcohort and discovery of heightened co-expression of CD8 cytotoxic molecules.
a Scatter dot plots showing the frequency of total CD8 T cells among CD3 or total living lymphocyte singlets using the FCM analysis of cryopreserved PBMC from another subcohort of the Luxembourg Parkinson’s study (11 iPD vs 12 HC, all CMV+ except for two seronegative HC). Scatter dot plots showing the frequency of CD8 TEMRA (b) or TCM (c) among total CD8 T cells using different marker combinations. Of note, one sample was excluded from PD as it was identified as an outlier by the default setting of the ROUT method of Graphpad. d Scatter dot plots showing the ratios between CD8 TEMRA and CD8 TCM using different marker definitions. Scatter dot plots showing the frequency of GZMA+ (e), GZMB+ (f), perforin+/PRF1+ (g) or GZMK+ cells (h) among various CD8 T subsets. i Scatter dot plots showing the frequency of GZMA+GZMB+PRF1+GZMK- cells among total CD8 T cells or CD8 subsets. j Gating strategy was used to identify different CD8 subsets by FCM (BD FACSymphonyTM S6). k Representative FCM plots showing the expression of GZMA, GZMB, PRF1 and GZMK among CD8 TEMRA. l Scatter dot plots showing MFI of perforin among total CD8 cells or CD8 subsets. The results in a–i, l were analyzed using ordinary one-way ANOVA test with two-stage linear step-up procedure of Benjamini/Krieger/Yekutieli correction. q-values (FDR) were displayed. Data are presented as mean ± standard deviation (s.d.). Each symbol represents the measurement from one individual. all q-values are indicated. CMV Cytomegalovirus, FCM flow cytometry, GZMA/B/K Granzyme A/B/K, HC healthy controls, n = 12 including 5 males; PD patients with Parkinson’s disease, n = 11 including 8 males. Source data are provided as a Source Data file.
Fig. 6
Fig. 6. scRNA-seq reveals enhanced cytotoxic pathways in CD8 TEMRA of early-to-mid stage iPD.
a Schematic for CD8 scRNA-seq. The other gates are in Supplementary Fig. 6a. b UMAP showing distribution of n = ~25,000 cells. Violin plots of selected genes defining CD8 naive/memory subsets (c), signifying cytotoxicity (d) and involving in top-ranked pathways enriched among upregulated genes in CD8 TEMRA (m). e Balloon plot showing the percentages of cells co-expressing the indicated markers. f, h UMAP showing joint density of GZMA+GZMB+PRF1+ (f) and GZMA+GZMB+PRF1+IFNG+ (h) in all CD8 cells. UMAP showing the individual GZMA+GZMB+PRF1+ (g) or GZMA+GZMB+PRF1+IFNG+ (i) cells among CD8 subsets. For visual comparability, random downsampling was employed to display the same number of cells for different conditions and subsets. j Volcano plots showing the expression changes in CD8 TEMRA. The selected top up- or downregulated DEGs are labeled in red or blue. Vertical dashed line indicates the log2FC value of 0.5 or −0.5, while the horizontal red line indicates –log10(0.05). k Top-ranked enriched KEGG pathways among upregulated DEGs in CD8 TEMRA of iPD vs HC. l Top-ranked GSEA pathways in upregulated DEGs in CD8 TEMRA. The lower part showing the rank distribution of the genes involved in the indicated pathway. The list on the right showing the leading-edge genes. n UMAP showing the unsupervised clustering analysis for n = ~7200 CD8 TEMRA cells. The clustering results were split for iPD or HC cells. Cells were randomly down-sampled to the same number for iPD and HC. o Violin plots of selected markers distinguishing clusters. p Heatmap of selected top DEGs in the clusters of CD8 TEMRA. P-values in j and p were analyzed using two-tailed nonparametric Wilcoxon Rank Sum test adjusted based on Bonferroni correction. In p, only the genes with adjusted P-value 0.05 were considered. P-values in k and l were analyzed using the one-tailed Fisher’s exact test and the one-tailed empirical phenotype-based permutation test, respectively. DEG differentially expressed genes, FACS fluorescence-activated cell sorting, FC fold change, GZMA/B/K Granzyme A/B/K, IFNG interferon gamma, UMAP uniform manifold approximation and projection. Panel a was created with BioRender.com.
Fig. 7
Fig. 7. scRNA-seq discloses the accelerated CD8 differentiation process in early-to-mid stage iPD.
a Heatmap showing the top 20 most-increased and -decreased genes along the predicted pseudotime trajectory ranked using log2FC (if p-value < 0.01) (n = ~25,000 cells). Each column represents one single cell. b Two-dimensional representation showing the CD8 memory T-cell differentiation trajectory using UMAP (upper). Lower, the ridge plots of pseudotime distribution among different CD8 subsets along differentiation trajectory. c Percentages of each binned psedutotime window along the pseudotime trajectory in iPD (n = ~12,000 cells) or HC (n = ~13,000 cells). d Stacked barplot showing the relative fraction of cells at the given predicted differentiation stage (during the given pseudotime window) between iPD and HC. e Unsupervised clustering analysis of CD8 TCM. Percentages of the two clusters and the ratios between two clusters were displayed. For comparability in visualization, cell numbers were randomly down-sampled to the same number for different conditions and subsets. f Violin plots of selected marker genes distinguishing different clusters within CD8 TCM. g Heatmap of selected top up- or downregulated genes in CD8 TCM from iPD vs HC. h Balloon plot showing the percentage of cells co-expressing the indicated markers in the given subset. If a cell shows the read count equal to or higher than 1 for each of the markers in the indicated combination, it is regarded as the cell co-expressing the set of markers. i UMAP plot showing joint density of CCL5 and GZMK (left) and of GZMA and GZMK (right) in all the individual CD8 T cells. Arrows refer to the area of TCM co-expressing the indicated markers. For a, the one-tailed ANOVA method was used to test whether any of the spline coefficients (for pseudotime fitting) is non-zero. In g, differential expression was analyzed using two-tailed nonparametric Wilcoxon Rank Sum test based on Bonferroni correction (only those with adjusted P-value 0.05 were considered). Each dot represents one single cell in (b, e, i). FC fold change, HC healthy controls, PD patients with Parkinson’s disease, UMAP uniform manifold approximation and projection.

References

    1. Dorsey ER, et al. Projected number of people with Parkinson disease in the most populous nations, 2005 through 2030. Neurology. 2007;68:384–386. doi: 10.1212/01.wnl.0000247740.47667.03. - DOI - PubMed
    1. Poewe W, et al. Parkinson disease. Nat. Rev. Dis. Prim. 2017;3:17013. doi: 10.1038/nrdp.2017.13. - DOI - PubMed
    1. Wang Q, Liu Y, Zhou J. Neuroinflammation in Parkinson’s disease and its potential as therapeutic target. Transl. Neurodegener. 2015;4:19. doi: 10.1186/s40035-015-0042-0. - DOI - PMC - PubMed
    1. Qin XY, Zhang SP, Cao C, Loh YP, Cheng Y. Aberrations in peripheral inflammatory cytokine levels in Parkinson disease: a systematic review and meta-analysis. JAMA Neurol. 2016;73:1316–1324. doi: 10.1001/jamaneurol.2016.2742. - DOI - PubMed
    1. Reale M, et al. “Peripheral cytokines profile in Parkinson’s disease. Brain Behav. Immun. 2009;23:55–63. doi: 10.1016/j.bbi.2008.07.003. - DOI - PubMed

Publication types

Associated data