. 2023 Nov 20;14(1):7260.
doi: 10.1038/s41467-023-42680-x.

Evaluation of the US COVID-19 Scenario Modeling Hub for informing pandemic response under uncertainty

Emily Howerton  1 Lucie Contamin  2 Luke C Mullany  3 Michelle Qin  4 Nicholas G Reich  5 Samantha Bents  6 Rebecca K Borchering  7   8 Sung-Mok Jung  9 Sara L Loo  10 Claire P Smith  10 John Levander  2 Jessica Kerr  2 J Espino  2 Willem G van Panhuis  11 Harry Hochheiser  2 Marta Galanti  12 Teresa Yamana  12 Sen Pei  12 Jeffrey Shaman  12 Kaitlin Rainwater-Lovett  3 Matt Kinsey  3 Kate Tallaksen  3 Shelby Wilson  3 Lauren Shin  3 Joseph C Lemaitre  9 Joshua Kaminsky  10 Juan Dent Hulse  10 Elizabeth C Lee  10 Clifton D McKee  10 Alison Hill  10 Dean Karlen  13 Matteo Chinazzi  14 Jessica T Davis  14 Kunpeng Mu  14 Xinyue Xiong  14 Ana Pastore Y Piontti  14 Alessandro Vespignani  14 Erik T Rosenstrom  15 Julie S Ivy  15 Maria E Mayorga  15 Julie L Swann  15 Guido España  16 Sean Cavany  16 Sean Moore  16 Alex Perkins  16 Thomas Hladish  17 Alexander Pillai  17 Kok Ben Toh  18 Ira Longini Jr  17 Shi Chen  19 Rajib Paul  19 Daniel Janies  19 Jean-Claude Thill  19 Anass Bouchnita  20 Kaiming Bi  21 Michael Lachmann  22 Spencer J Fox  23 Lauren Ancel Meyers  21 Ajitesh Srivastava  24 Przemyslaw Porebski  25 Srini Venkatramanan  25 Aniruddha Adiga  25 Bryan Lewis  25 Brian Klahn  25 Joseph Outten  25 Benjamin Hurt  25 Jiangzhuo Chen  25 Henning Mortveit  25 Amanda Wilson  25 Madhav Marathe  25 Stefan Hoops  25 Parantapa Bhattacharya  25 Dustin Machi  25 Betsy L Cadwell  8 Jessica M Healy  8 Rachel B Slayton  8 Michael A Johansson  8 Matthew Biggerstaff  8 Shaun Truelove  10 Michael C Runge  26 Katriona Shea  7 Cécile Viboud  27 Justin Lessler  28   29
Affiliations

Evaluation of the US COVID-19 Scenario Modeling Hub for informing pandemic response under uncertainty

Emily Howerton et al. Nat Commun. .

Abstract

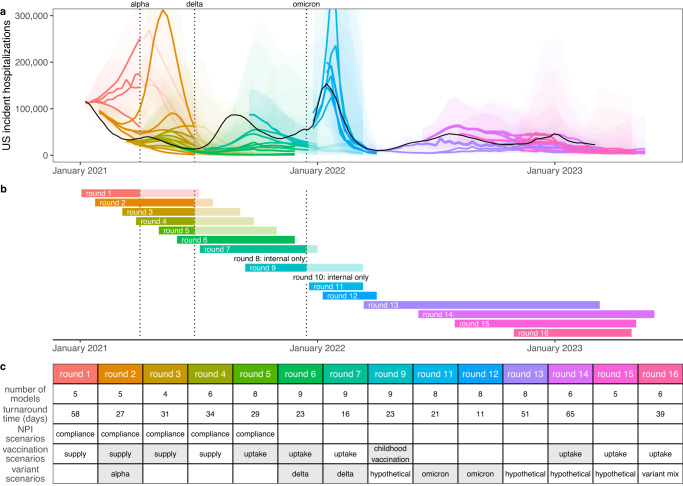
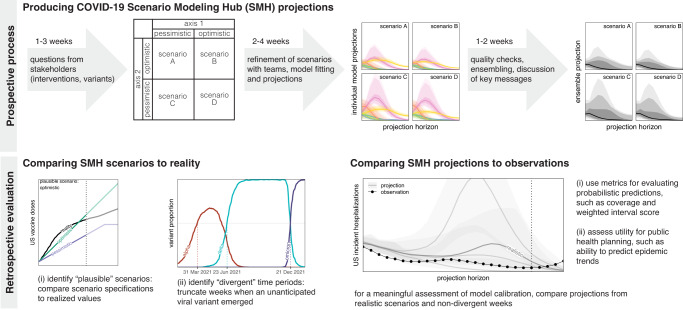
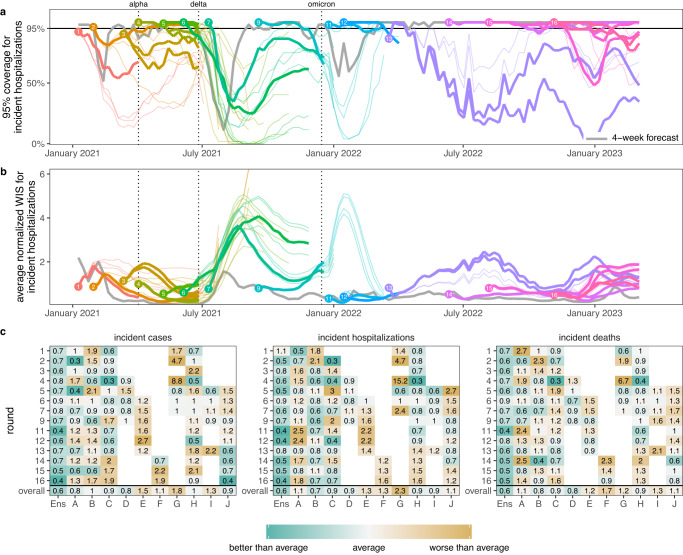
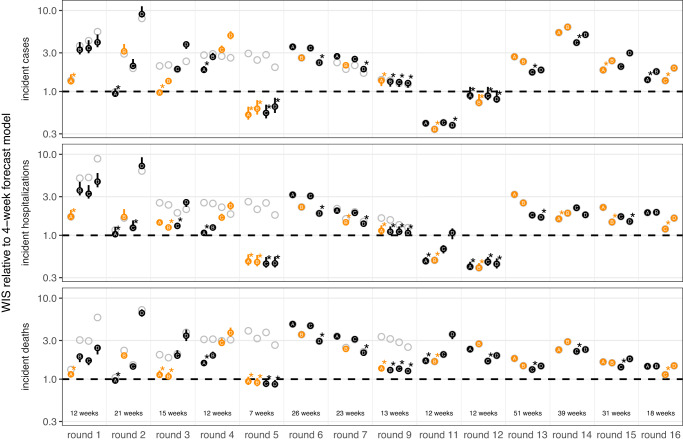
Our ability to forecast epidemics far into the future is constrained by the many complexities of disease systems. Realistic longer-term projections may, however, be possible under well-defined scenarios that specify the future state of critical epidemic drivers. Since December 2020, the U.S. COVID-19 Scenario Modeling Hub (SMH) has convened multiple modeling teams to make months ahead projections of SARS-CoV-2 burden, totaling nearly 1.8 million national and state-level projections. Here, we find SMH performance varied widely as a function of both scenario validity and model calibration. We show scenarios remained close to reality for 22 weeks on average before the arrival of unanticipated SARS-CoV-2 variants invalidated key assumptions. An ensemble of participating models that preserved variation between models (using the linear opinion pool method) was consistently more reliable than any single model in periods of valid scenario assumptions, while projection interval coverage was near target levels. SMH projections were used to guide pandemic response, illustrating the value of collaborative hubs for longer-term scenario projections.


Conflict of interest statement

J.E. is president of General Biodefense LLC, a private consulting group for public health informatics and has interest in READE.ai, a medical artificial intelligence solutions company. JS and Columbia University disclose partial ownership of SK Analytics. JS discloses consulting for BNI. M.C.R. reports stock ownership in Becton Dickinson & Co., which manufactures medical equipment used in COVID-19 testing, vaccination, and treatment. J.L. has served as an expert witness on cases where the likely length of the pandemic was of issue. The remaining authors declare no competing interests.

Figures

Fig. 1
Fig. 1. Sixteen rounds of U.S. COVID-19 Scenario Modeling Hub (SMH) projections.
Between February 2021 and November 2022, SMH publicly released fourteen rounds of projections with four scenarios per round. Each round is shown in a different color (internal Rounds 8 and 10 not shown). a Median (line) and 95% projection interval (ribbon, the interval within which we expect the observed value to fall with 95% probability, given reality perfectly aligns with the scenario) for U.S. weekly incident hospitalizations for four scenarios per round from the SMH ensemble. Observed weekly U.S. incident hospitalizations are represented by the solid black line. b Timing of each round of SMH projections is represented by a projection start date and end date (start and end of bar). In panels (a) and (b), scenario specifications were invalidated by the emergence of Alpha, Delta, and Omicron variants in rounds that did not anticipate emergence. Variant emergence dates (estimated as the day after which national prevalence exceeded 50%) are represented by dotted vertical lines. c For each round, the table specifies the number of participating modeling teams, the turnaround time from finalization of scenarios to publication of projections, and scenario specifications about non-pharmaceutical interventions (NPIs), vaccination, and variant characteristics. Scenario specifications are shaded gray if scenarios “bracketed” the true values in our retrospective analysis (i.e., the true value fell between the two scenario assumptions on that uncertainty axis). Note, in Rounds 11 and 12 both scenario axes specified assumptions about variants, and both are included in the “variant assumptions” cell. Not shown here, the second scenario axis for Round 13 specified assumptions about waning immunity, which bracketed waning estimates from a meta-analysis.
Fig. 2
Fig. 2. COVID-19 Scenario Modeling Hub (SMH) process.
(top) Prospective SMH process: The SMH coordination team takes input from public health partners on key questions to design scenarios. Scenarios have a 2 × 2 structure (with the exception of Round 1), where two levels are specified along each of two axes of uncertainty or interventions, and all four combinations of these possibilities are considered (scenarios A-D). Scenarios are refined in discussion with modeling teams, after which teams each fit their model and make projections independently. Then, after quality checks, individual model projections are aggregated using linear opinion pool (i.e., probability averaging), and in discussion with the teams, key messages are determined. A report is shared with public health partners and projections are released on the public SMH website (https://covid19scenariomodelinghub.org). (bottom) Retrospective evaluation: Evaluating the SMH effort involves comparing SMH scenario assumptions to reality, and comparing SMH projections to observations. Comparing scenarios to reality is used to identify the most plausible scenario-weeks, namely the set of “plausible” scenarios in projection weeks where scenario specifications about variants did not diverge from actual variant prevalence. Horizontal dotted lines represent emergence of an unanticipated variant.
Fig. 3
Fig. 3. Performance of U.S. COVID-19 Scenario Modeling Hub (SMH) ensemble projections for weekly incident cases, hospitalizations, and deaths.
a Coverage of SMH ensemble 95% projection interval across locations by round and scenario. Ideal coverage of 95% is shown as a horizontal black line. b Normalized weighted interval score (WIS) for SMH ensemble by round and scenario. Normalized WIS is calculated by dividing WIS by the standard deviation of WIS across all scenarios and models for a given week, location, target, and round. This yields a scale-free value, and we averaged normalized WIS across all locations for a given projection week and scenario. For (a) and (b), the round is indicated by color and a number at the start of the projection period. Each scenario is represented by a different line, with plausible scenario-weeks bolded (see Methods). Performance of the 4-wk ahead COVID-19 Forecast Hub ensemble is shown in gray. Vertical dotted lines represent emergence dates of Alpha, Delta, and Omicron variants. Evaluation ended on 10 March 2023, as the source of ground truth observations were no longer produced. c Relative WIS comparison of individual models (letters A-I) and SMH ensemble (“Ens”) within rounds and overall. A relative WIS of 1 indicates performance equivalent to the “average” model (yellow colors indicate performance worse than average, and greens indicate performance better than average; the color scale is on a log scale and truncated at ±1, representing 2 standard deviations of relative WIS values). See Figs. S46–S47 for 50% and 95% coverage of all targets and see Fig. S22 for comparison of WIS for SMH ensemble to each null comparator.
Fig. 4
Fig. 4. Relative performance of the four U.S. COVID-19 Scenario Modeling Hub (SMH) scenarios (A, B, C, D) across rounds.
Weighted interval score (WIS) for SMH ensemble projections in plausible scenario-weeks relative to the 4-week forecast model (4-week ahead COVID-19 Forecast Hub ensemble). WIS is averaged across all locations and plausible scenario-weeks for a given target, round, and scenario. Scenarios deemed plausible are highlighted in orange (see Methods). The number of plausible weeks included in the average is noted at the bottom of the incident death panel. Results for all weeks are shown with gray open circles for comparison. A WIS ratio of one (dashed line) indicates equal average WIS, or equal performance, between the SMH ensemble and 4-week forecast model. Data are shown as WIS ratio with all weeks included (points), with vertical lines around each point denoting ninety percent (90%) bootstrap intervals. Booststrap intervals are calculated by leaving out WIS for all locations in a given week (over n = 1000 random samples of a single week left out of 7-52 weeks, depending on the number of weeks evaluated in each round). Most bootstrap intervals are very narrow and therefore not easily visible. In each round, the scenario with the lowest WIS ratio is denoted with an asterisk. Any scenario with a 90% bootstrap interval that overlaps the bootstrap interval of the scenario with the lowest WIS ratio is also denoted with an asterisk. WIS ratio is shown on the log scale.
Fig. 5
Fig. 5. Evaluation of scenario projections to anticipate disease trends.
Illustration of classification of increasing (orange), flat (yellow), and decreasing (blue) trends for observed United States incident hospitalizations (a) and U.S. COVID-19 Scenario Modeling Hub (SMH) ensemble projection median for the plausible scenario (b) using Round 11, at the start of the Omicron wave. Evaluation of trends across all rounds and locations for plausible scenario-weeks: c For decreasing, flat and increasing observations, percent of incident cases, hospitalizations and deaths correctly identified by SMH ensemble projection median (gray), the 4-week forecast model (dashed line), a model that continues current trend (dotted), and the expectation if observations are classified randomly (solid). d For decreasing, flat, and increasing observations in plausible scenario-weeks, the number (and percentage) of observations that are classified as decreasing, flat, or increasing by the SMH ensemble projection median. Totals are calculated across all targets and rounds (meaning that some weeks are included multiple times, and therefore although 33% of observations are in each category, 33% of projections may not be in each category) and weighted by the plausibility of the scenario and week (for rounds with multiple plausible scenarios, this could introduce decimal totals; we rounded values down in these cases). Percentages on the outside show the percent correct for a given observed classification (precision, columns) or projected classification (recall, rows). Projection classifications were also calculated for all scenarios and weeks, regardless of plausibility (Fig. S35), using SMH ensemble projection Q75 (Fig. S36) and SMH ensemble projection Q97.5 (Fig. S37); see supplement for additional stratification of results (by round, Fig. S39; by location, Fig. S40; by projection horizon, Figs. S41–S42; and by variant period, Fig. S43).

Update of

  • Informing pandemic response in the face of uncertainty. An evaluation of the U.S. COVID-19 Scenario Modeling Hub.
    Howerton E, Contamin L, Mullany LC, Qin M, Reich NG, Bents S, Borchering RK, Jung SM, Loo SL, Smith CP, Levander J, Kerr J, Espino J, van Panhuis WG, Hochheiser H, Galanti M, Yamana T, Pei S, Shaman J, Rainwater-Lovett K, Kinsey M, Tallaksen K, Wilson S, Shin L, Lemaitre JC, Kaminsky J, Hulse JD, Lee EC, McKee C, Hill A, Karlen D, Chinazzi M, Davis JT, Mu K, Xiong X, Piontti APY, Vespignani A, Rosenstrom ET, Ivy JS, Mayorga ME, Swann JL, España G, Cavany S, Moore S, Perkins A, Hladish T, Pillai A, Toh KB, Longini I Jr, Chen S, Paul R, Janies D, Thill JC, Bouchnita A, Bi K, Lachmann M, Fox S, Meyers LA; UT COVID-19 Modeling Consortium; Srivastava A, Porebski P, Venkatramanan S, Adiga A, Lewis B, Klahn B, Outten J, Hurt B, Chen J, Mortveit H, Wilson A, Marathe M, Hoops S, Bhattacharya P, Machi D, Cadwell BL, Healy JM, Slayton RB, Johansson MA, Biggerstaff M, Truelove S, Runge MC, Shea K, Viboud C, Lessler J. Howerton E, et al. medRxiv [Preprint]. 2023 Jul 3:2023.06.28.23291998. doi: 10.1101/2023.06.28.23291998. medRxiv. 2023. Update in: Nat Commun. 2023 Nov 20;14(1):7260. doi: 10.1038/s41467-023-42680-x. PMID: 37461674 Free PMC article. Updated. Preprint.

References

    1. Biggerstaff M, Slayton RB, Johansson MA, Butler JC. Improving Pandemic Response: Employing Mathematical Modeling to Confront Coronavirus Disease 2019. Clin. Infect. Dis. 2022;74:913–917. doi: 10.1093/cid/ciab673. - DOI - PMC - PubMed
    1. Metcalf CJE, Morris DH, Park SW. Mathematical models to guide pandemic response. Science. 2020;369:368–369. doi: 10.1126/science.abd1668. - DOI - PubMed
    1. US Centers for Disease Control and Prevention. COVID-19 Pandemic Planning Scenarios. Centers for Disease Control and Preventionhttps://www.cdc.gov/coronavirus/2019-ncov/hcp/planning-scenarios.html (2020).
    1. Taghia J, et al. Development of forecast models for COVID-19 hospital admissions using anonymized and aggregated mobile network data. Sci. Rep. 2022;12:17726. doi: 10.1038/s41598-022-22350-6. - DOI - PMC - PubMed
    1. Borchering RK, et al. Impact of SARS-CoV-2 vaccination of children ages 5–11 years on COVID-19 disease burden and resilience to new variants in the United States, November 2021–March 2022: A multi-model study. Lancet Reg. Health Am. 2023;17:100398. - PMC - PubMed

Publication types

Supplementary concepts