. 2024 Jan;43(3):155-170.
doi: 10.1038/s41388-023-02889-y. Epub 2023 Nov 20.

Dual targeting of MAPK and PI3K pathways unlocks redifferentiation of Braf-mutated thyroid cancer organoids

Affiliations

Dual targeting of MAPK and PI3K pathways unlocks redifferentiation of Braf-mutated thyroid cancer organoids

Hélène Lasolle et al. Oncogene. 2024 Jan.

Abstract

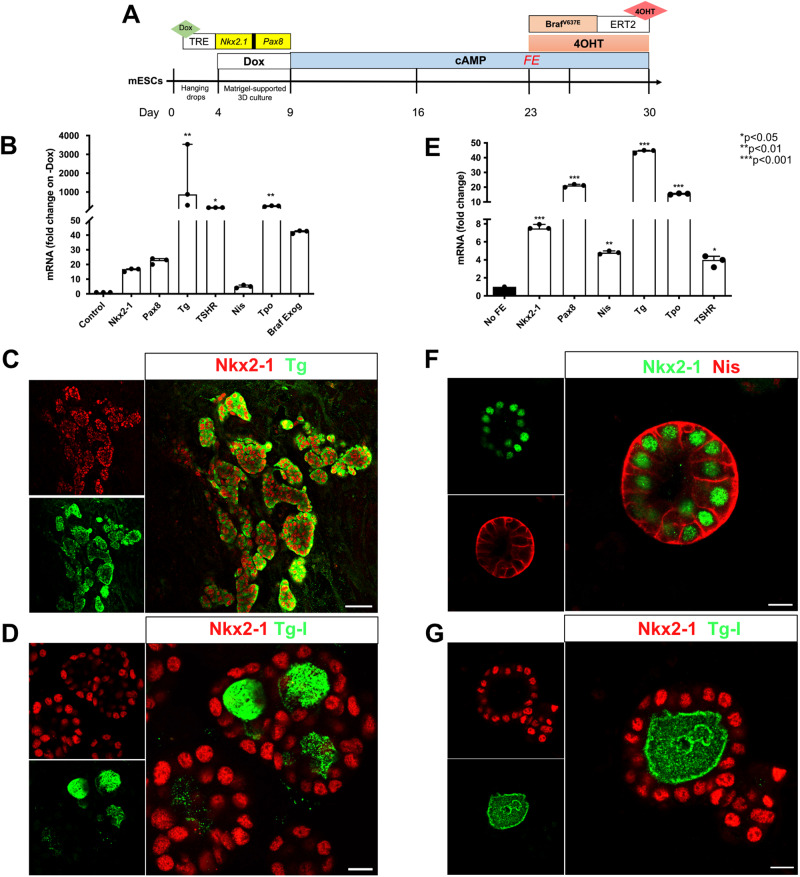
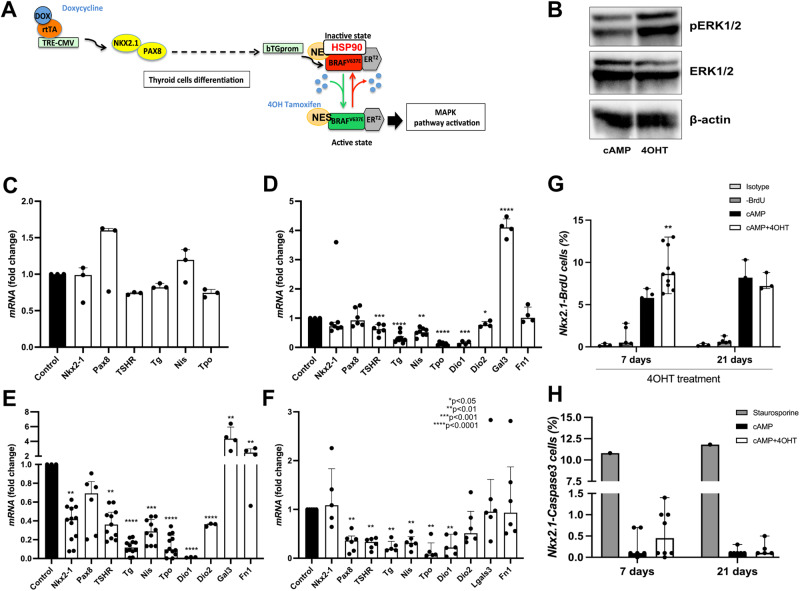
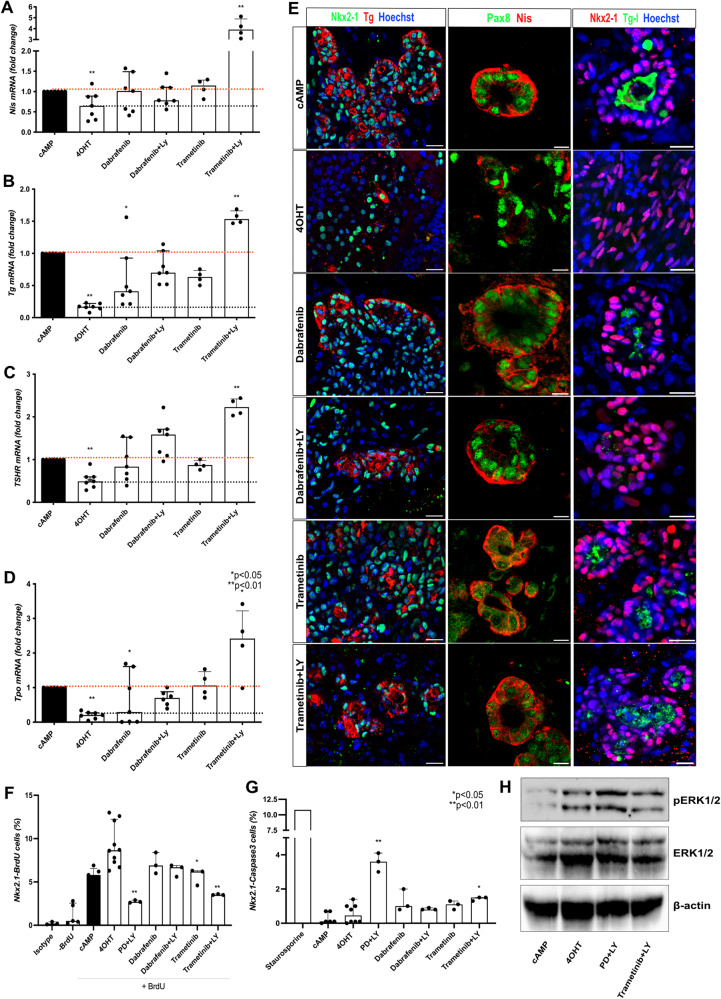
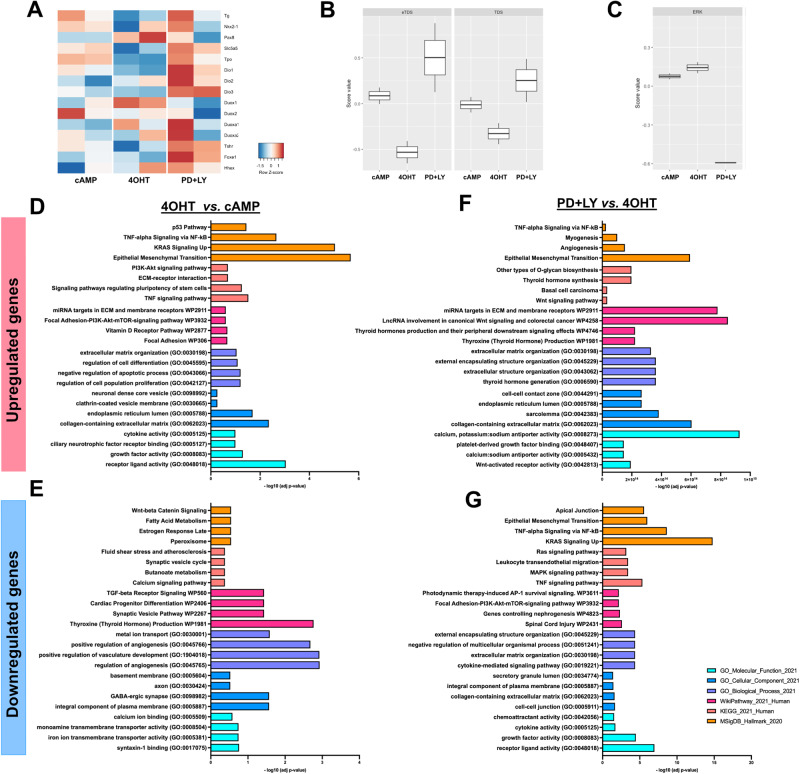
Thyroid cancer is the most common endocrine malignancy and several genetic events have been described to promote the development of thyroid carcinogenesis. Besides the effects of specific mutations on thyroid cancer development, the molecular mechanisms controlling tumorigenesis, tumor behavior, and drug resistance are still largely unknown. Cancer organoids have been proposed as a powerful tool to study aspects related to tumor development and progression and appear promising to test individual responses to therapies. Here, using mESC-derived thyroid organoids, we developed a BrafV637E-inducible model able to recapitulate the features of papillary thyroid cancer in vitro. Overexpression of the murine BrafV637E mutation, equivalent to BrafV600E in humans, rapidly triggers to MAPK activation, cell dedifferentiation, and disruption of follicular organization. BrafV637E-expressing organoids show a transcriptomic signature for p53, focal adhesion, ECM-receptor interactions, EMT, and inflammatory signaling pathways. Finally, PTC-like thyroid organoids were used for drug screening assays. The combination of MAPK and PI3K inhibitors reversed BrafV637E oncogene-promoted cell dedifferentiation while restoring thyroid follicle organization and function in vitro. Our results demonstrate that pluripotent stem cells-derived thyroid cancer organoids can mimic tumor development and features while providing an efficient tool for testing novel targeted therapies.


Conflict of interest statement

All authors declare no competing interests.

Figures

Fig. 1
Fig. 1. mESC_Nkx2-1/Pax8_bTg_BrafV637E cell line differentiation into thyroid organoids.
Scheme of the thyroid differentiation protocol and BrafV637E induction in mature thyroid follicles (A). Differentiation of mESC_Nkx2-1/Pax8_bTg_BrafV637E cell line promotes expression of the main thyroid genes and BrafV637E exogenous (B). Control corresponds to the - Dox condition. Immunofluorescence staining showing Nkx2-1 and Tg co-expressing cells organized in follicular structures (C), which are accumulating the thyroid hormone precursor, Tg-I, inside the lumen compartment (D). The follicular enrichment (FE) procedure significantly increased the expression levels of thyroid genes (E) while keeping the structural organization of the follicles evidenced by Nis basolateral localization (F) and its functionality, with Tg-I accumulation (G). Values represent the median (IQR) of 3 independent experiments with individual values shown (*p < 0.05; **p < 0.01; ***p < 0.001; Mann–Whitney U test). Scale bars, 50 μm and 10 μm for high magnification follicles.
Fig. 2
Fig. 2. Effect of the BrafV637E oncogene induction on mature thyroid follicles.
Schematic representation of thyroid differentiation, BrafV637E oncogene expression on thyroid cells, and its activation under tamoxifen (4OHT) treatment (A). Western blot demonstrates an increase of phospho-ERK (pERK) 48 h after the addition of 4OHT to the organoids culture (B). Beta-actin was used as a loading control for the immunoblot experiments. The image represents one experiment from 3 experimental replicates. Gene expression analysis showing the inhibitory effect of BrafV637E-oncogene activation on thyroid genes after 6 h (C), 48 h (D), 7 days (E) and 21 days (F) of 4OHT treatment. For each time point gene expression levels of the cAMP+4OHT treated cells were compared to the control (cAMP) levels. Bar graphs represent the median (IQR) of at least 3 independent experiments with individual values shown. (*p < 0.05; **p < 0.01; ***p < 0.001; ***p < 0.0001; Mann–Whitney U test). Proportions of proliferating (Nkx2.1/BrDU + ) (G) and apoptotic (Nkx2.1/Caspase3 + ) (H) cells among control (cAMP) and BrafV637E-induced (4OHT) organoids after 7 and 21 days of 4OHT treatment. For the proliferation assay, isotype and -BrdU conditions were used as negative controls for flow cytometry gating. As a positive control for apoptosis, staurosporine treatment (24 h) was used to determine Caspase 3 expression. Bar graphs represent the median (IQR) of at least 3 independent experiments with individual values shown. cAMP was used as control for comparisons. (**p < 0.01; Mann–Whitney U test).
Fig. 3
Fig. 3. Morphological changes on thyroid follicles caused by BrafV637E activation.
cAMP-treated thyroid cells show follicular organization with Nkx2-1 nuclear expression and Tg accumulation in the luminal compartment. In contrast, after 48 h of BrafV637E oncogene induction by 4OHT, most of the cells are not organized into follicular structures and a great proportion is expressing very low levels of Tg (A). Higher magnification images showing the follicular organization of the thyroid cells in the control condition (48 h), with proper expression of Nkx2-1 and/or Tg (B), E-cadherin (C), Zo-1 (D), Nis (E) and Tg-I (F) accumulation in the lumen. While in the 4OHT condition the follicular organization is disrupted as well as its function. Nkx2-1 and Tg co-staining in control (cAMP) and BrafV637E-induced (4OHT) cells for 7 days (G) and 21 days (H) shows clear changes in thyroid morphology evidenced by the heterogeneity of Nkx2-1 cells which mostly do not express Tg or at low levels at day 7, while at day 21 a higher proportion of Nkx2-1 cells are Tg positive. Hoescht (shown in blue) was used for nuclei staining. Scale bars, 20 μm (A), 10 μm (BF) and 50 μm (G, H).
Fig. 4
Fig. 4. Drug screening reveals that VPA and MAPK/PI3K inhibition can restore Nis expression in BrafV637E-induced cells.
Schematic representation of the protocol used for drug screening experiments (A). qPCR data show that 4OHT-treated organoids (4 days) treated with MEK (PD0325901; PD) and PI3K (LY294002; LY) inhibitors isolated increase but do not restore Nis expression to control (cAMP) levels. However, when combined, Nis expression reached cAMP levels. On the other hand, the HDAC inhibitor (VPA) can recover Nis expression (B) by itself. Bar graphs represent the median (IQR) of at least 4 independent experiments with individual values shown. Comparisons were performed against the cAMP condition. (**p < 0.05; ***p < 0.001; Mann–Whitney U test). Confocal images show downregulation of the Nis transporter in 4OHT condition, which is restored by VPA treatment. However, the expression pattern differs from the control (cAMP) condition. Co-inhibition of MAPK and PI3K pathways associated or not to VPA treatment restores Nis protein expression at the basolateral membrane of the properly organized follicles (C). Scale bars, 10 μm. Gene expression analysis shows that PD0325901 and LY294002 co-treatment recover the Tg (D), TSHR (E), and Tpo (F) mRNA to cAMP levels. Bar graphs represent the median (IQR) of at least 3 independent experiments with individual values shown. Comparisons were performed against the cAMP condition. (*p < 0.05; **p < 0.01; ***p < 0.001; ***p < 0.0001; Mann–Whitney U test). Immunostaining for Nkx2-1 and Tg shows that proteins levels are similar to controls (cAMP) while follicular organization (G, H) and luminal Tg-I accumulation were restored under PD + LY and PD + LY + VPA conditions (I). Scale bars, 20 μm (G), 50 μm (H), and 10 μm (I). Organification assay shows recovery of Iodine uptake (J), protein-bound to 125I (K), and % of iodine Organification (L) in PD + LY and PD + LY + VPA conditions. Bar graphs represent the median (IQR) of at least 3 independent experiments with individual values shown. Comparisons were performed against the cAMP condition. (**p < 0.01; ***p < 0.0001; Mann–Whitney U test).
Fig. 5
Fig. 5. Dabrafenib and trametinib effect on redifferentiation of BrafV637E-expressing cells.
BrafV637E-expressing organoids treated with Dabrafenib and Trametinib restore the expression of Nis to cAMP levels. However, a greater increase is observed under Trametinib+LY co-treatment (A). Recovery of Tg (B), TSHR (C) and Tpo (D) mRNA to control levels was observed under co-treatment of Dabrafenib and Trametinib with the PI3K inhibitor (LY). Bar graphs represent the median (IQR) of at least 4 independent experiments with individual values shown. Comparisons were performed against the cAMP condition. (*p < 0.05; **p < 0.01; Mann-Whitney U test). Confocal images show that Dabrafenib and Trametinib isolated or combined to PI3K inhibitor (LY) also induce Tg and Nis protein levels while restoring the follicular structure (in a proportion of cells) and Tg-I accumulation in the lumen (E). Hoescht (shown in blue) was used for nuclei staining. Scale bars, 20 μm (Tg and Tg-I) and 10 μm (Nis). Proportions of proliferating (Nkx2.1/BrDU + ) (F) and apoptotic (Nkx2.1/Caspase3 + ) (G) cells among control (cAMP), BrafV637E-induced (4OHT) and inhibitors (4OHT+inhibitors)-treated organoids after. For the proliferation assay, isotype and -BrdU conditions were used as negative controls for flow cytometry gating. As a positive control for apoptosis, staurosporine treatment (24 h) was used to determine Caspase 3 expression. Bar graphs represent the median (IQR) of at least 3 independent experiments with individual values shown. Comparisons were performed against the 4OHT condition. (*p < 0.05; **p < 0.01; Mann–Whitney U test). Western blot shows an increase of phospho-ERK (pERK) 7 days after the addition of 4OHT to the organoids culture when compared to cAMP control. Conversely, the treatment with Trametinib+LY resulted in pERK reduction compared to the 4OHT condition. B Beta-actin was used as a loading control for the immunoblot experiments. The image represents one experiment from 3 experimental replicates.
Fig. 6
Fig. 6. Transcriptomics analysis confirms thyroid redifferentiation of BrafV637E-expressing cells treated with MAPK and PI3K inhibitors and suggests by which mechanisms.
Heatmap of normalized bulk RNA-Seq expression of normal thyroid cells (cAMP), BrafV637E expressing cells (4OHT), and BrafV637E expressing cells treated with PD0325901 + LY204002 inhibitors. Rows represent markers and columns represent specific conditions. Color values in the heatmap represent mean expression levels (A). Thyroid differentiation (eTDS and TDS) (B) and ERK (C) scores were calculated among the different conditions. Classification of upregulated and downregulated genes comparing 4OHT vs. cAMP (D, E) and PD + LY vs. 4OHT (F, G). Colors represent the classification method and scale the -log10 (adj p value).

References

    1. Schutgens F, Clevers H. Human organoids: tools for understanding biology and treating diseases. Ann Rev Pathol. 2020;15:211–34. doi: 10.1146/annurev-pathmechdis-012419-032611. - DOI - PubMed
    1. Clevers H. Modeling development and disease with organoids. Cell. 2016;165:1586–97. doi: 10.1016/j.cell.2016.05.082. - DOI - PubMed
    1. Kim J, Koo BK, Knoblich JA. Human organoids: model systems for human biology and medicine. Nat Rev Mol Cell Biol. 2020;21:571–84. doi: 10.1038/s41580-020-0259-3. - DOI - PMC - PubMed
    1. Antonica F, Kasprzyk DF, Opitz R, Iacovino M, Liao XH, Dumitrescu AM, et al. Generation of functional thyroid from embryonic stem cells. Nature. 2012;491:66–71. doi: 10.1038/nature11525. - DOI - PMC - PubMed
    1. Romitti M, Tourneur A, de Faria da Fonseca B, Doumont G, Gillotay P, Liao X-H, et al. Transplantable human thyroid organoids generated from embryonic stem cells to rescue hypothyroidism. Nat Commun. 2022;13:7057. doi: 10.1038/s41467-022-34776-7. - DOI - PMC - PubMed

Publication types

Substances