

Direct comparison of spatial transcriptional heterogeneity across diverse Bacillus subtilis biofilm communities
- PMID: 37985771
- PMCID: PMC10661151
- DOI: 10.1038/s41467-023-43386-w
Direct comparison of spatial transcriptional heterogeneity across diverse Bacillus subtilis biofilm communities
Abstract
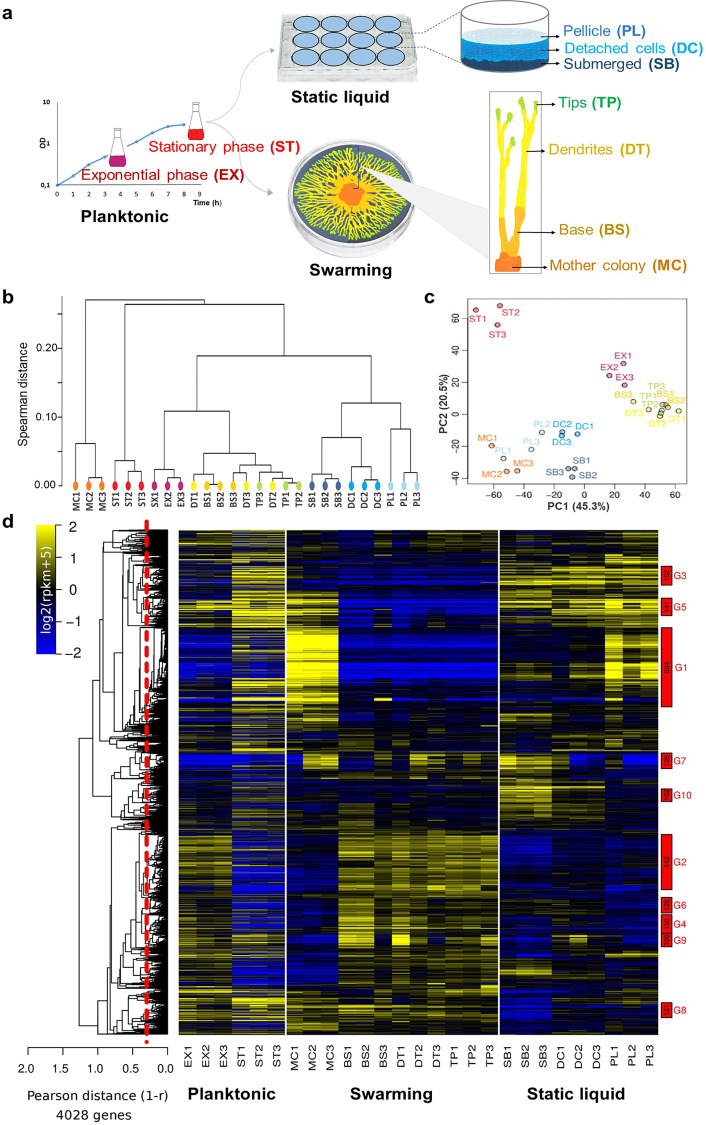
Bacillus subtilis can form various types of spatially organised communities on surfaces, such as colonies, pellicles and submerged biofilms. These communities share similarities and differences, and phenotypic heterogeneity has been reported for each type of community. Here, we studied spatial transcriptional heterogeneity across the three types of surface-associated communities. Using RNA-seq analysis of different regions or populations for each community type, we identified genes that are specifically expressed within each selected population. We constructed fluorescent transcriptional fusions for 17 of these genes, and observed their expression in submerged biofilms using time-lapse confocal laser scanning microscopy (CLSM). We found mosaic expression patterns for some genes; in particular, we observed spatially segregated cells displaying opposite regulation of carbon metabolism genes (gapA and gapB), indicative of distinct glycolytic or gluconeogenic regimes coexisting in the same biofilm region. Overall, our study provides a direct comparison of spatial transcriptional heterogeneity, at different scales, for the three main models of B. subtilis surface-associated communities.
© 2023. The Author(s).
Conflict of interest statement
The authors declare no competing interests.
Figures


Similar articles
-
The spatial architecture of Bacillus subtilis biofilms deciphered using a surface-associated model and in situ imaging.PLoS One. 2011 Jan 18;6(1):e16177. doi: 10.1371/journal.pone.0016177. PLoS One. 2011. PMID: 21267464 Free PMC article.
-
Extensive cellular multi-tasking within Bacillus subtilis biofilms.mSystems. 2023 Aug 31;8(4):e0089122. doi: 10.1128/msystems.00891-22. Epub 2023 Aug 1. mSystems. 2023. PMID: 37527273 Free PMC article.
-
Identification of catabolite repression as a physiological regulator of biofilm formation by Bacillus subtilis by use of DNA microarrays.J Bacteriol. 2003 Mar;185(6):1951-7. doi: 10.1128/JB.185.6.1951-1957.2003. J Bacteriol. 2003. PMID: 12618459 Free PMC article.
-
Evolved Biofilm: Review on the Experimental Evolution Studies of Bacillus subtilis Pellicles.J Mol Biol. 2019 Nov 22;431(23):4749-4759. doi: 10.1016/j.jmb.2019.02.005. Epub 2019 Feb 12. J Mol Biol. 2019. PMID: 30769118 Review.
-
Bacillus subtilis biofilm formation and social interactions.Nat Rev Microbiol. 2021 Sep;19(9):600-614. doi: 10.1038/s41579-021-00540-9. Epub 2021 Apr 6. Nat Rev Microbiol. 2021. PMID: 33824496 Review.
Cited by
-
Burkholderia cenocepacia and Pseudomonas aeruginosa in dual-species models: Insights into population distribution, antibiotic susceptibility, and virulence.Virulence. 2025 Dec;16(1):2494039. doi: 10.1080/21505594.2025.2494039. Epub 2025 Apr 24. Virulence. 2025. PMID: 40272017 Free PMC article.
-
Hosts and Commensal Bacteria Synergistically Antagonize Opportunistic Pathogens at the Single-Cell Resolution.Adv Sci (Weinh). 2025 Aug;12(30):e00582. doi: 10.1002/advs.202500582. Epub 2025 May 23. Adv Sci (Weinh). 2025. PMID: 40407187 Free PMC article.
-
An exciting future for microbial molecular biology and physiology.mBio. 2025 Aug 13;16(8):e0069425. doi: 10.1128/mbio.00694-25. Epub 2025 Jun 30. mBio. 2025. PMID: 40586574 Free PMC article. Review.
-
Bacillus subtilis EpsA-O: A novel exopolysaccharide structure acting as an efficient adhesive in biofilms.NPJ Biofilms Microbiomes. 2024 Oct 2;10(1):98. doi: 10.1038/s41522-024-00555-z. NPJ Biofilms Microbiomes. 2024. PMID: 39358392 Free PMC article.
-
Deciphering the influence of NaCl on social behaviour of Bacillus subtilis.R Soc Open Sci. 2024 Sep 18;11(9):240822. doi: 10.1098/rsos.240822. eCollection 2024 Sep. R Soc Open Sci. 2024. PMID: 39295915 Free PMC article.
References
Publication types
MeSH terms
Substances
Associated data
- Actions
LinkOut - more resources
Full Text Sources
Molecular Biology Databases
