. 2023 Dec;10(36):e2302494.
doi: 10.1002/advs.202302494. Epub 2023 Nov 20.

STAG2 Regulates Homologous Recombination Repair and Sensitivity to ATM Inhibition

Affiliations

STAG2 Regulates Homologous Recombination Repair and Sensitivity to ATM Inhibition

Jie Zhou et al. Adv Sci (Weinh). 2023 Dec.

Abstract

Stromal antigen 2 (STAG2), a subunit of the cohesin complex, is recurrently mutated in various tumors. However, the role of STAG2 in DNA repair and its therapeutic implications are largely unknown. Here it is reported that knockout of STAG2 results in increased double-stranded breaks (DSBs) and chromosomal aberrations by reducing homologous recombination (HR) repair, and confers hypersensitivity to inhibitors of ataxia telangiectasia mutated (ATMi), Poly ADP Ribose Polymerase (PARPi), or the combination of both. Of note, the impaired HR by STAG2-deficiency is mainly attributed to the restored expression of KMT5A, which in turn methylates H4K20 (H4K20me0) to H4K20me1 and thereby decreases the recruitment of BRCA1-BARD1 to chromatin. Importantly, STAG2 expression correlates with poor prognosis of cancer patients. STAG2 is identified as an important regulator of HR and a potential therapeutic strategy for STAG2-mutant tumors is elucidated.

Keywords: ATM inhibitors; PARP inhibitors; STAG2; homologous recombination; synthetic lethality.


Conflict of interest statement

The authors declare no conflict of interest.

Figures
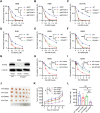
Figure 1
Figure 1
STAG2 is synthetically lethal with ATM inhibitors in multiple cancers. A,B) Clonogenic survival assays of control and knockout (KO) lung cancer cells after treatment with ATM inhibitor (KU‐60019) following transduction with STAG2‐targeting sgRNAs. ‐A, ‐B and ‐C indicate three independent sgRNAs. C–E) Clonogenic survival assays of colorectal cancer cells and U2OS cells after treatment with ATM inhibitor (KU‐60019) in stable clones of STAG2 knockout constructed via CRIPSR‐Cas9. F) Clonogenic survival assays of U2OS cells after treatment with the other ATM inhibitor (KU‐55933) in stable clones of STAG2 knockout via CRIPSR‐Cas9. G–I) Western blot and Clonogenic survival assays detecting the efficiency of STAG2 rescue and its impact after treatment with two ATMi (KU60019, KU55933) in U2OS cells. J–L) Tumor images, volumes and weight of xenograft tumors formed in nude mice (n = 6). Nude mice were injected subcutaneously with 2 × 10^6 DLD1 wildtype (WT) or STAG2 knockout (KO) cells, and intraperitoneally without or with ATM inhibitor (DMSO or 10 mg kg−1 KU‐55933) every three days for 16 days. Day 16 tumor images are shown. Dynamic tumor volumes were monitored and analyzed. Tumor weights of xenograft tumors formed in nude mice (n = 6). Data are shown as mean ± SEM. Statistical analysis was performed using one‐way and two‐way ANOVA (A, B, C, D, E, F, H, I, and K). ns, not significant, * p<0.05, *** p<0.001.
Figure 2
Figure 2
Knockout of STAG2 impairs DNA double‐strand breaks repair. A) Left: Representative images of neutral comets in STAG2WT and STAG2KO U2OS cells after treatment with DMSO or an ATM inhibitor (KU‐60019, 5 µM) for 24 h. Scale bar: 100 µm. Right: Quantification of the comet tail moment in left panel. At least 50 cells were counted in each condition. B) Western blot of the cell lysates from STAG2WT and STAG2KO U2OS cells 4 h after treatment without (W/o) or with (W/) irradiation (5 Gy). C) Left: Immunofluorescence images and quantification of γ‐H2AX foci in STAG2WT and STAG2KO U2OS cells at 4 and 16 h after 5 Gy irradiation treatment. Scale bar: 20 µm. Right: Percentage of the cells with >10 γ‐H2AX foci. At least 50 cells were counted in each condition. D) Left: Representative images of neutral comets in STAG2WT and STAG2KO U2OS cells at 4 and 16 h after 5 Gy irradiation treatment. Scale bar: 100 µm. Right: Quantification of the comet tail moments shown in the left panel. At least 50 cells were counted in each condition. E) Left: Representative images of chromosomal aberrations in metaphase spreads of STAG2WT or STAG2KO U2OS cells 4 h after treatment with 100 ng ml−1 colchicine following 24 h exposure to DMSO or ATM inhibitor (KU‐60019, 5 µM). Scale bar: 10 µm. Right: Quantification of chromosomal aberrations. At least 30 cells were counted in each condition. Data are shown as mean ± SEM from three independent experiments and were analyzed by one‐way ANOVA test (A, B, D, and E). ns, not significant, * p<0.05, *** p <0.001, **** p <0.0001.
Figure 3
Figure 3
Knockout of STAG2 decreases homologous recombination repair. A) Left: Western blot of STAG2 and BRCA1 expression in the U2OS‐DR‐GFP cells after the treatment with si‐Control (NC), si‐BRCA1, and si‐STAG2. Right: The homologous recombination efficiency was measured using the U2OS‐DR‐GFP cell line. Cells were transfected with si‐NC, si‐STAG2, or si‐BRCA1, exposed to I‐Scel adenovirus or not (Scel‐free) for 6 h, and cultured with fresh medium. GFP‐positive cells were quantified after 72 h using FACS. B) Left: Western blot of STAG2 and 53BP1 expression in the U2OS‐EJ5‐GFP cells after the treatment with si‐NC, si‐53BP1, and si‐STAG2. Right: The non‐homologous end joining efficiency was measured using the U2OS‐EJ5‐GFP cell line. Cells were transfected with si‐NC, si‐53BP1, or si‐STAG2, exposed to I‐Scel adenovirus or not (Scel‐free) for 6 h, and cultured with fresh medium. GFP‐positive cells were quantified after 72 h using FACS. C–E) Immunofluorescence images and quantification of RPA32, RAD51, and 53BP1 foci 4 h after treatment without (W/o) or with irradiation (W/IR, 5 Gy) in STAG2WT, STAG2KO, and STAG2KO+STAG2 U2OS cells. At least 50 nuclei were counted in each condition. Data are shown as mean ± SEM and were analyzed by one‐way ANOVA. ns, not significant, * p <0.05, ** p <0.01, ***p <0.001.
Figure 4
Figure 4
STAG2 influences the recruitment of BRCA1 and BARD1 to DNA damage site by regulating H4K20 methylation mediated by KMT5A. A) Western blot of the indicated proteins in subcellular fractions of STAG2WT and STAG2KO U2OS cells after treatment with 2 mM ATMi (KU‐60019) for 24 h. GAPDH was used as the control for the total cell lysates. Histone H3 was used as the control for the nucleus chromatin proteins. Lamin B1 was used as the control for the nucleus‐soluble proteins. Arrows indicate the target bands. B) Left: Immunofluorescence images of BRCA1 foci 4 h after treatment without (W/o) or with irradiation (W/IR, 5 Gy) in STAG2WT and STAG2KO U2OS cells. Right: Quantification analysis of BRCA1 foci 4 h after treatment without (W/o) or with irradiation (W/IR, 5 Gy) in STAG2WT and STAG2KO U2OS cells, related to left panel. At least 50 nuclei were randomly counted in each group. C) Western blot of the indicated proteins from STAG2WT and STAG2KO U2OS cell lines. D) Western blot showing FLAG‐immunoprecipitation of FLAG‐BARD1 in U2OS cells treated with siRNA negative control and si‐STAG2. E) CUT & Tag‐seq for FLAG or FLAG‐STAG2 at the KMT5A gene locus (indicated by the black arrow) in U2OS cells. The bed files showed the detected signal of vector or FLAG‐STAG2 peaks. F) A schematic diagram of the luciferase reporter plasmids constructed with three different fragments of the KMT5A promoter. STAG2‐Peak indicates the specific sequence of STAG2 binding to KMT5A which is obtained by CUT‐Tag sequencing. G) Relative values of luciferase (LUC) activity measured after transfection of different reporter plasmids in wild‐type (STAG2WT) or STAG2 knockout (STAG2KO) U2OS cells (Relative to STAG2WT each group). H) Relative values of luciferase (LUC) activity measured after transfection of different reporter plasmids in U2OS cells followed by si‐NC or si‐STAG2 (Relative to si‐NC each group). I) A cartoon showing that BRCA1‐BARD1 complex and 53BP1 interact with different methylated H4 histones. J) Western blot of the indicated proteins from STAG2WT and STAG2KO U2OS cells treated with siRNA negative control and si‐KMT5A. K) Left: Immunofluorescence images and quantification of BRCA1 foci 4 h after treatment with irradiation (W/IR, 5 Gy) in STAG2WT and STAG2KO U2OS cells treated with siRNA negative control and si‐KMT5A. Right: Quantification of BRCA1 foci 4 h after treatment with irradiation (W/IR, 5 Gy) in STAG2WT and STAG2KO U2OS cells with siRNA negative control and si‐KMT5A, related to the left panel. At least 50 nuclei were randomly counted in each group. L) Quantification of HR efficiency using direct repeat U2OS DR‐GFP reporter assay. Cells were treated with si‐NC, si‐STAG2, si‐BRCA1, si‐KMT5A, si‐BRCA1+si‐STAG2, si‐BRCA1+si‐KMT5A, and si‐STAG2+si‐KMT5A. M) Left: Representative images of colony formation by STAG2WT or STAG2KO U2OS cells treated with si‐NC and si‐KMT5A, and treated with DMSO or ATMi (KU‐60019, 1 µM). Right: Clonogenic survival assays of STAG2WT and STAG2KO U2OS cells treated with siRNA negative control and si‐KMT5A and treated with DMSO or ATMi (KU‐60019). Data are shown as mean ± SEM from three independent experiments and were analyzed using the one‐way ANOVA test (B, G, H, K, and L), and two‐way ANOVA (M). ns, not significant, *p<0.05, **p<0.01, ***p < 0.001.
Figure 5
Figure 5
Knockout of STAG2 increases the sensitivity of PARPi and improves the synergy effect of ATMi and PARPi combination in vitro and in vivo. A) Clonogenic survival assays of multiple cancer cells treated with PARP inhibitor (PARPi, Olaparib) after sg‐STAG2, stable clones of STAG2 knockout via CRIPSR‐Cas9. B,C) Tumor images and volumes of xenograft tumors formed in nude mice (n = 6). Nude mice were injected subcutaneously with 2 × 10^6 DLD1 STAG2WT or STAG2KO cells, and intraperitoneally with or without PARP inhibitor (DMSO or 50 mg kg−1 AZD2281) every three days for 16 days. An image of day 16 tumors is shown. Dynamic tumor volumes were monitored and analyzed. D) Representative images of colony formation by STAG2WT or STAG2KO U2OS cells treated with si‐NC and si‐KMT5A and treated with DMSO or PARPi (Olaparib, 2 µM). E,F) Representative images of colony formation by STAG2WT or STAG2KO DLD1 cells after treatment with gradient concentrations of ATMi (KU‐60019) and PARPi (Olaparib). Coefficient of drug interaction of combined treatment with ATMi and PARPi in STAG2WT or STAG2KO DLD1 cells. Coefficient of drug interaction (CDI) < 1 indicates synergistic effect, CDI < 0.7 indicates good synergistic effect, CDI = 1 indicates no synergy, and CDI > 1 indicates antagonism. G,H) Tumor volumes and weights of xenograft tumors in nude mice (n = 6). Nude mice were injected subcutaneously with 2 × 10^6 DLD1 STAG2WT or STAG2KO cells intraperitoneally with DMSO, ATMi (KU‐55933, 5 mg kg−1), PARPi (Olaparib, 25 mg kg−1), or a combination of ATMi and PARPi (5 mg kg−1 KU‐55933 + 25 mg kg−1 Olaparib) three days for 16 days. Dynamic tumor volumes were monitored and analyzed. Day 16 weights are shown. Data are shown as mean ± SEM, and were analyzed by two‐way ANOVA test (A, C, and G), and one‐way ANOVA test (H). * p<0.05, *** p<0.001.
Figure 6
Figure 6
STAG2‐deficient xenograft tumors exhibit higher DNA damage after treatment with ATMi and PARPi, and high STAG2 indicates a poor clinical outcome. A) Western blot of the indicated proteins from xenograft tumor lysates. Tissues were derived from xenograft tumors that were subcutaneously treated with STAG2WT and STAG2KO DLD1 cells. B) Representative immunohistochemical images of STAG2, KMT5A, H4K20me0, and H4K20me1 in fixed tumor tissues from xenograft tumors. Tissues were derived from xenograft tumors that were subcutaneously treated with STAG2WT and STAG2KO DLD1 cells. Scale bars: 100 µm. C,D) Representative immunohistochemical images and western blot of γ‐H2AX and cleaved Caspase‐3 in fixed tumor tissues and lysates from xenograft tumors, respectively. Tissues were derived from xenograft tumors that were subcutaneously treated with STAG2WT and STAG2KO DLD1 cells following the treatment with DMSO, ATMi (KU‐55933, 5 mg kg−1), PARPi (Olaparib, 25 mg kg−1), and ATMi + PARPi (5 mg kg−1 KU‐55933 + 25 mg kg−1 Olaparib). Scale bars: 100 µm. E) Violin plot of STAG2 mRNA expression level (log2(fpkm‐uq)) of normal and tumor tissues in the TCGA colorectal adenocarcinoma (COADREAD) cohort. Error bars indicate a standard error and p‐value was calculated using Student's t‐test. F) Kaplan–Meier curves depicting overall survival (OS) of patients with high and low STAG2 mRNA expression levels in the TCGA colorectal adenocarcinoma (COADREAD) cohort. Statistical analysis was performed using log‐rank test. G) Representative immunohistochemical images of low and high expression of STAG2 in the SYSUCC colorectal adenocarcinoma (COADREAD) cohort. Scale bars: 200 µm. H) Kaplan–Meier curves depicting overall survival (OS) of patients with high and low STAG2 protein expression levels in the SYSUCC colorectal adenocarcinoma (COADREAD) cohort. Statistical analysis was performed using log‐rank test.

References

    1. Pilié P. G., Tang C., Mills G. B., Yap T. A., Nat. Rev. Clin. Oncol. 2019, 16, 81. - PMC - PubMed
    1. Shiloh Y., Ziv Y., Nat. Rev. Mol. Cell Biol. 2013, 14, 197. - PubMed
    1. Weber A. M., Ryan A. J., Pharmacol. Ther. 2015, 149, 124. - PubMed
    1. Cai M.‐Y., Dunn C. E., Chen W., Kochupurakkal B. S., Nguyen H., Moreau L. A., Shapiro G. I., Parmar K., Kozono D., D'andrea A. D., Cell Rep. 2020, 30, 2402. - PMC - PubMed
    1. Jann J.‐C., Tothova Z., Blood 2021, 138, 649. - PMC - PubMed

Publication types

MeSH terms