. 2024 Sep;42(9):1394-1403.
doi: 10.1038/s41587-023-01988-1. Epub 2023 Nov 20.

Spatial host-microbiome sequencing reveals niches in the mouse gut

Affiliations

Spatial host-microbiome sequencing reveals niches in the mouse gut

Britta Lötstedt et al. Nat Biotechnol. 2024 Sep.

Abstract

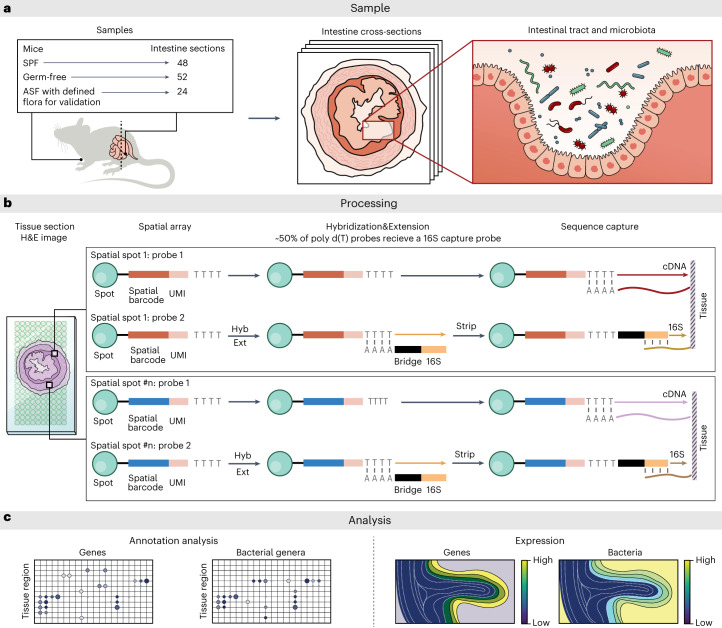
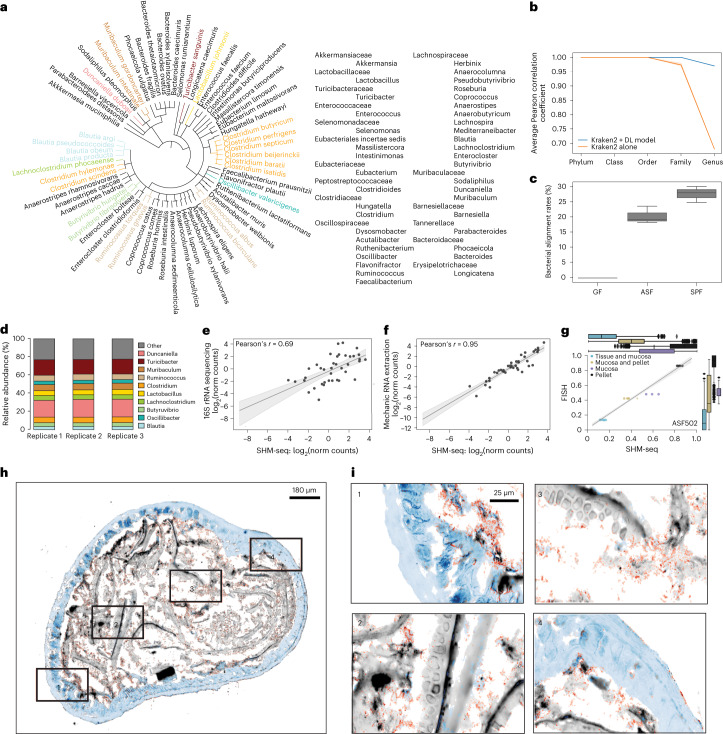
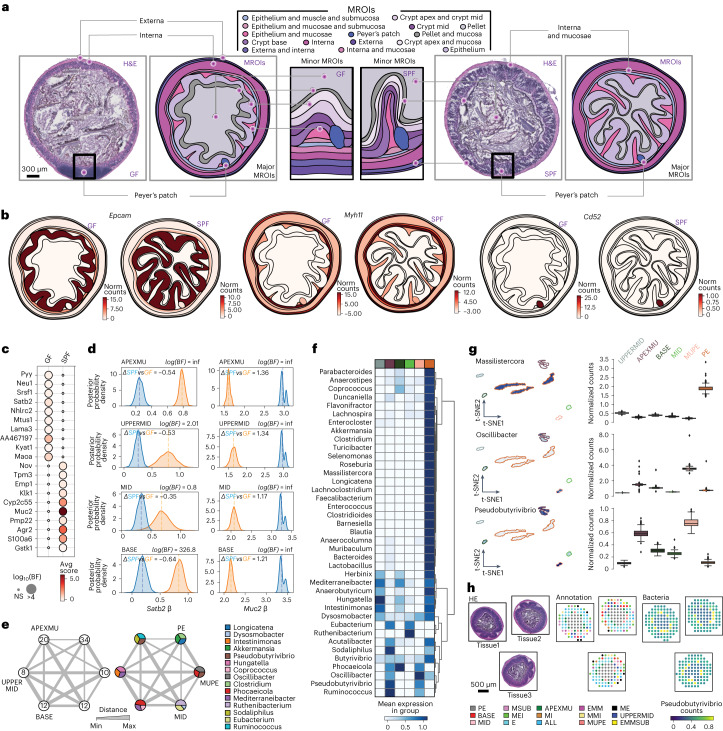
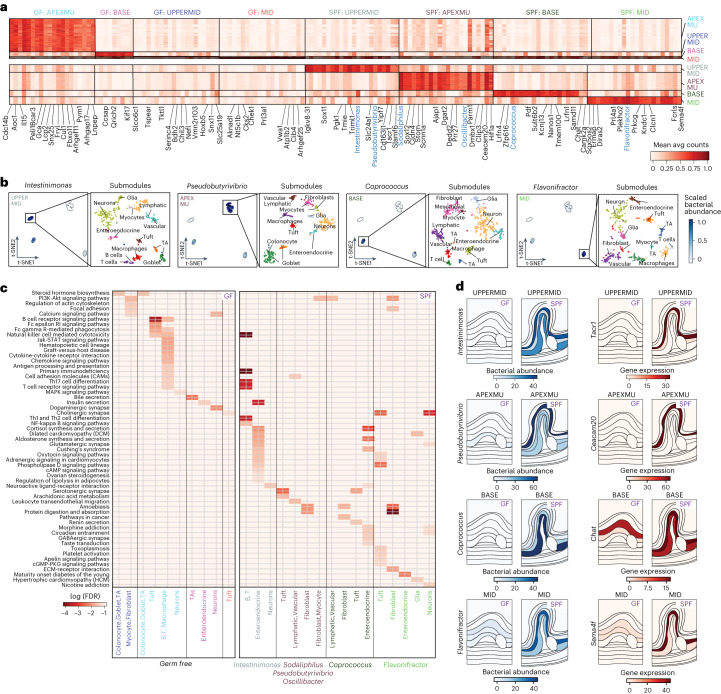
Mucosal and barrier tissues, such as the gut, lung or skin, are composed of a complex network of cells and microbes forming a tight niche that prevents pathogen colonization and supports host-microbiome symbiosis. Characterizing these networks at high molecular and cellular resolution is crucial for understanding homeostasis and disease. Here we present spatial host-microbiome sequencing (SHM-seq), an all-sequencing-based approach that captures tissue histology, polyadenylated RNAs and bacterial 16S sequences directly from a tissue by modifying spatially barcoded glass surfaces to enable simultaneous capture of host transcripts and hypervariable regions of the 16S bacterial ribosomal RNA. We applied our approach to the mouse gut as a model system, used a deep learning approach for data mapping and detected spatial niches defined by cellular composition and microbial geography. We show that subpopulations of gut cells express specific gene programs in different microenvironments characteristic of regional commensal bacteria and impact host-bacteria interactions. SHM-seq should enhance the study of native host-microbe interactions in health and disease.


Conflict of interest statement

A.R. is a founder and equity holder of Celsius Therapeutics; is an equity holder in Immunitas Therapeutics; and, until 31 August 2020, was a scientific advisory board member of Syros Pharmaceuticals, Neogene Therapeutics, Asimov and Thermo Fisher Scientific. From 1 August 2020, A.R. is an employee of Genentech and an equity holder in Roche. S.V is an author on patents applied for by Spatial Transcriptomics AB (10x Genomics). S.V. and A.R. are co-inventors on PCT/US2020/015481, related to this work. The remaining authors declare no competing interests.

Figures

Fig. 1
Fig. 1. SHM-seq.
a, Three different mouse conditions used in the study analyzing cross-sections in the mouse gut. b, Tissue sections from mouse colons were placed on a barcoded glass array, with a barcoded surface adapted for simultaneous capture of polyadenylated host transcripts and 16S bacterial rRNA. Tissue sections were imaged, cells were permeabilized and cDNA was synthesized on the array surface before library preparation and sequencing. c, Data analysis identifies regional gene programs, their cell type constituents, association with mouse condition and regional association with specific commensal bacteria. Hyb, hybridization; Ext, extension.
Fig. 2
Fig. 2. SHM-seq accurately captures bacterial representation and abundances in SPF and ASF mice.
a, Bacterial reference of the mouse gut microbiome. Phylogenetic tree of SPF colonic content, representing the 65 species colored to highlight taxonomic families and genera. b, Enhanced annotation performance of the deep learning model. Average Pearson correlation coefficient (y axis) between true and predicted taxonomic labels from spatial spots (Methods) on five taxonomic levels (x axis) when using Kraken2 (orange) or Kraken2 together with the deep learning model (blue) (y axis) (n = 3). Error bars: 95% confidence intervals. c, Highly specific mapping of bacterial reads. Overall bacterial alignment rates to reference genomes (y axis, %) for GF (left, n = 3), ASF (middle, n = 3) and SPF (right, n = 3) tissue sections using spatial 16S sequencing. d, High reproducibility of bacterial abundances in SPF mouse colons by SHM-seq. Percentage (y axis) of the top 10 most abundant bacteria genera in each of three independent samples of SPF mouse colons (x axis). e, SHM-seq compares well to 16S rRNA sequencing. Pseudo-bulk abundances of bacterial genera (dot) from SHM-seq (x axis, SPF mice, n = 3) and bulk 16S rRNA sequencing (y axis, SPF mice, n = 3). Top left: Pearson r. f, Enzymatic (SHM-seq) extraction of bacterial content agrees with established mechanic extraction. Pseudo-bulk abundances of each bacterial genera (dot) from SHM-seq (x axis, SPF mice, n = 3) and mechanical extraction (y axis, SPF mice, n = 3). gi, SHM-seq agreement with FISH probes targeting ASF502. g, Distribution (box plot, normalized signals per region) and individual measurements (scatter plot, mean signal per region and sample, n = 6) of ASF502 counts by FISH (y axis) and SHM-seq (x axis). Shaded areas: 95% confidence interval. c,g, Box plots: center black line, median; color-coded box, interquartile range; error bars, 1.5× interquartile range; black dots; outliers. h, Cross-section of an ASF mouse colon (scale bar, 180 μm) with four regions (red rectangles) and their zoom-ins (i) (scale bar, 25 μm). Colors: tissue (blue), fibers (gray) and ASF502 (red). e,f, Line: linear regression model fit. Shaded areas: 95% confidence interval. norm, normalized; DL, deep learning.
Fig. 3
Fig. 3. Spatial detection of bacteria and host gene expression with SHM-seq.
a, MROI in the mouse colon. H&E-stained tissue sections from GF (left) and SFP (right) mice (left panels) annotated and visualized with vector representations (right panels), showing bacteria and host expression in major and minor MROIs associated with each anatomical tissue layer (right panels). Scale bar, 300 μm. b, Spatial host gene expression in three major MROIs. Expression (color bar, normalized gene expression) of selected spatially variable genes in GF (left) and SPF (right) tissue sections in major MROIs. c, Differential gene expression between mouse conditions. Significance (dot size, log10BF; Methods) of differential expression and expression level (normalized gene expression) of the top 10 genes (rows) differentially expressed between GF and SPF mouse tissue sections (columns) (Methods). d, Gene expression differences between morphological regions. Posterior distributions of the region-specific coefficient parameters (β) of Satb2 (left) and Muc2 (right) in four MROIs describing colonic crypts in SPF (blue) and GF (orange) mice. Dashed lines: mean of each distribution. e, Bacteria detected across six MROIs in SPF mouse tissues. Number of (left) and top three most abundant (right) bacteria genera (color code) detected in minor MROIs. Line thickness: average Euclidean distances between MROIs. f, Regional abundance of taxa. Scaled normalized bacterial counts (normalized counts scaled within each genus, color bar) in MROIs (color code, columns) for each detected bacteria (rows). g, Association between taxa and spatial regions. t-distributed stochastic neighbor embedding (t-SNE) of scaled bacterial count profile of each spatial spot (color scale, dots, n = 4,655, left panel) and the distribution of normalized bacterial count for all spatial spots (right panel) in six minor MROIs (color code) in SPF mice for different genera. Boxplots: Center black line, median; color-coded box, interquartile range; error bars, 1.5x interquartile range; black dots; outliers. h, Reproducibility of bacterial associations across individual sections. H&E (left), MROI annotations (color code, middle) and normalized bacterial count for Pseudobutyrivibrio (color scale, right) in three tissue sections. Circles: spatial spots. Scale bar, 500 μm. Abbreviations as in Methods (ch). MROI color code shared (f,g). Norm, normalized; NS, not significant; inf, infinity.
Fig. 4
Fig. 4. Bacterial presence influences host expression in four major tissue regions.
a, Regional association of bacterial taxa and host gene expression. Mean average count (color scale) of selected top differentially expressed genes (columns, black text) and top differentially abundant taxa (columns, blue text) in each spatial region (rows) across four major tissue MROIs (color code, right, and labels on top). b, Regional association of taxa and cell type composition. Left panels: t-distributed stochastic neighbor embedding (t-SNE) of scaled bacterial count vectors in each spatial spot (dots) colored by abundance of taxa (blue color scale, scaled normalized bacterial counts, taxon on top) that are differentially abundant in each of four MROIs (color code, labels in upper left corner). Right panels: t-SNE of host snRNA-seq cell profiles (dots) mapped in each individual MROI colored by cell type label. c, Expression submodules in different regions reflect distinct biological processes associated with bacterial presence. Significance (color scale, −log10(FDR), one-tailed Fisher exact test) of enrichment of KEGG pathways (rows) in each submodule (columns) associated with each spatial region and mouse condition (color code, middle) and bacterial taxa associated with the same spatial region and condition (bottom). Color coding of spatial modules as in a. d, Differential regional gene expression associated with bacterial taxa. Region maps colored by spatial abundance of bacterial genera (blue color scale, normalized bacterial counts) and normalized spatial expression of cell type marker genes (red color scale) in each MROI in SPF and GF.

References

    1. Tlaskalová-Hogenová, H. et al. Commensal bacteria (normal microflora), mucosal immunity and chronic inflammatory and autoimmune diseases. Immunol. Lett.93, 97–108 (2004). 10.1016/j.imlet.2004.02.005 - DOI - PubMed
    1. Donaldson, G. P. et al. Gut microbiota utilize immunoglobulin A for mucosal colonization. Science360, 795–800 (2018). 10.1126/science.aaq0926 - DOI - PMC - PubMed
    1. Hanahan, D. & Coussens, L. M. Accessories to the crime: functions of cells recruited to the tumor microenvironment. Cancer Cell21, 309–322 (2012). 10.1016/j.ccr.2012.02.022 - DOI - PubMed
    1. Bodenmiller, B. Multiplexed epitope-based tissue imaging for discovery and healthcare applications. Cell Syst.2, 225–238 (2016). 10.1016/j.cels.2016.03.008 - DOI - PubMed
    1. Liu, J. Z. et al. Association analyses identify 38 susceptibility loci for inflammatory bowel disease and highlight shared genetic risk across populations. Nat. Genet.47, 979–986 (2015). 10.1038/ng.3359 - DOI - PMC - PubMed

Substances

LinkOut - more resources