. 2024 Jan;76(1):e12925.
doi: 10.1111/jpi.12925. Epub 2023 Nov 20.

The MT1 receptor as the target of ramelteon neuroprotection in ischemic stroke

Affiliations

The MT1 receptor as the target of ramelteon neuroprotection in ischemic stroke

Xinmu Zhang et al. J Pineal Res. 2024 Jan.

Abstract

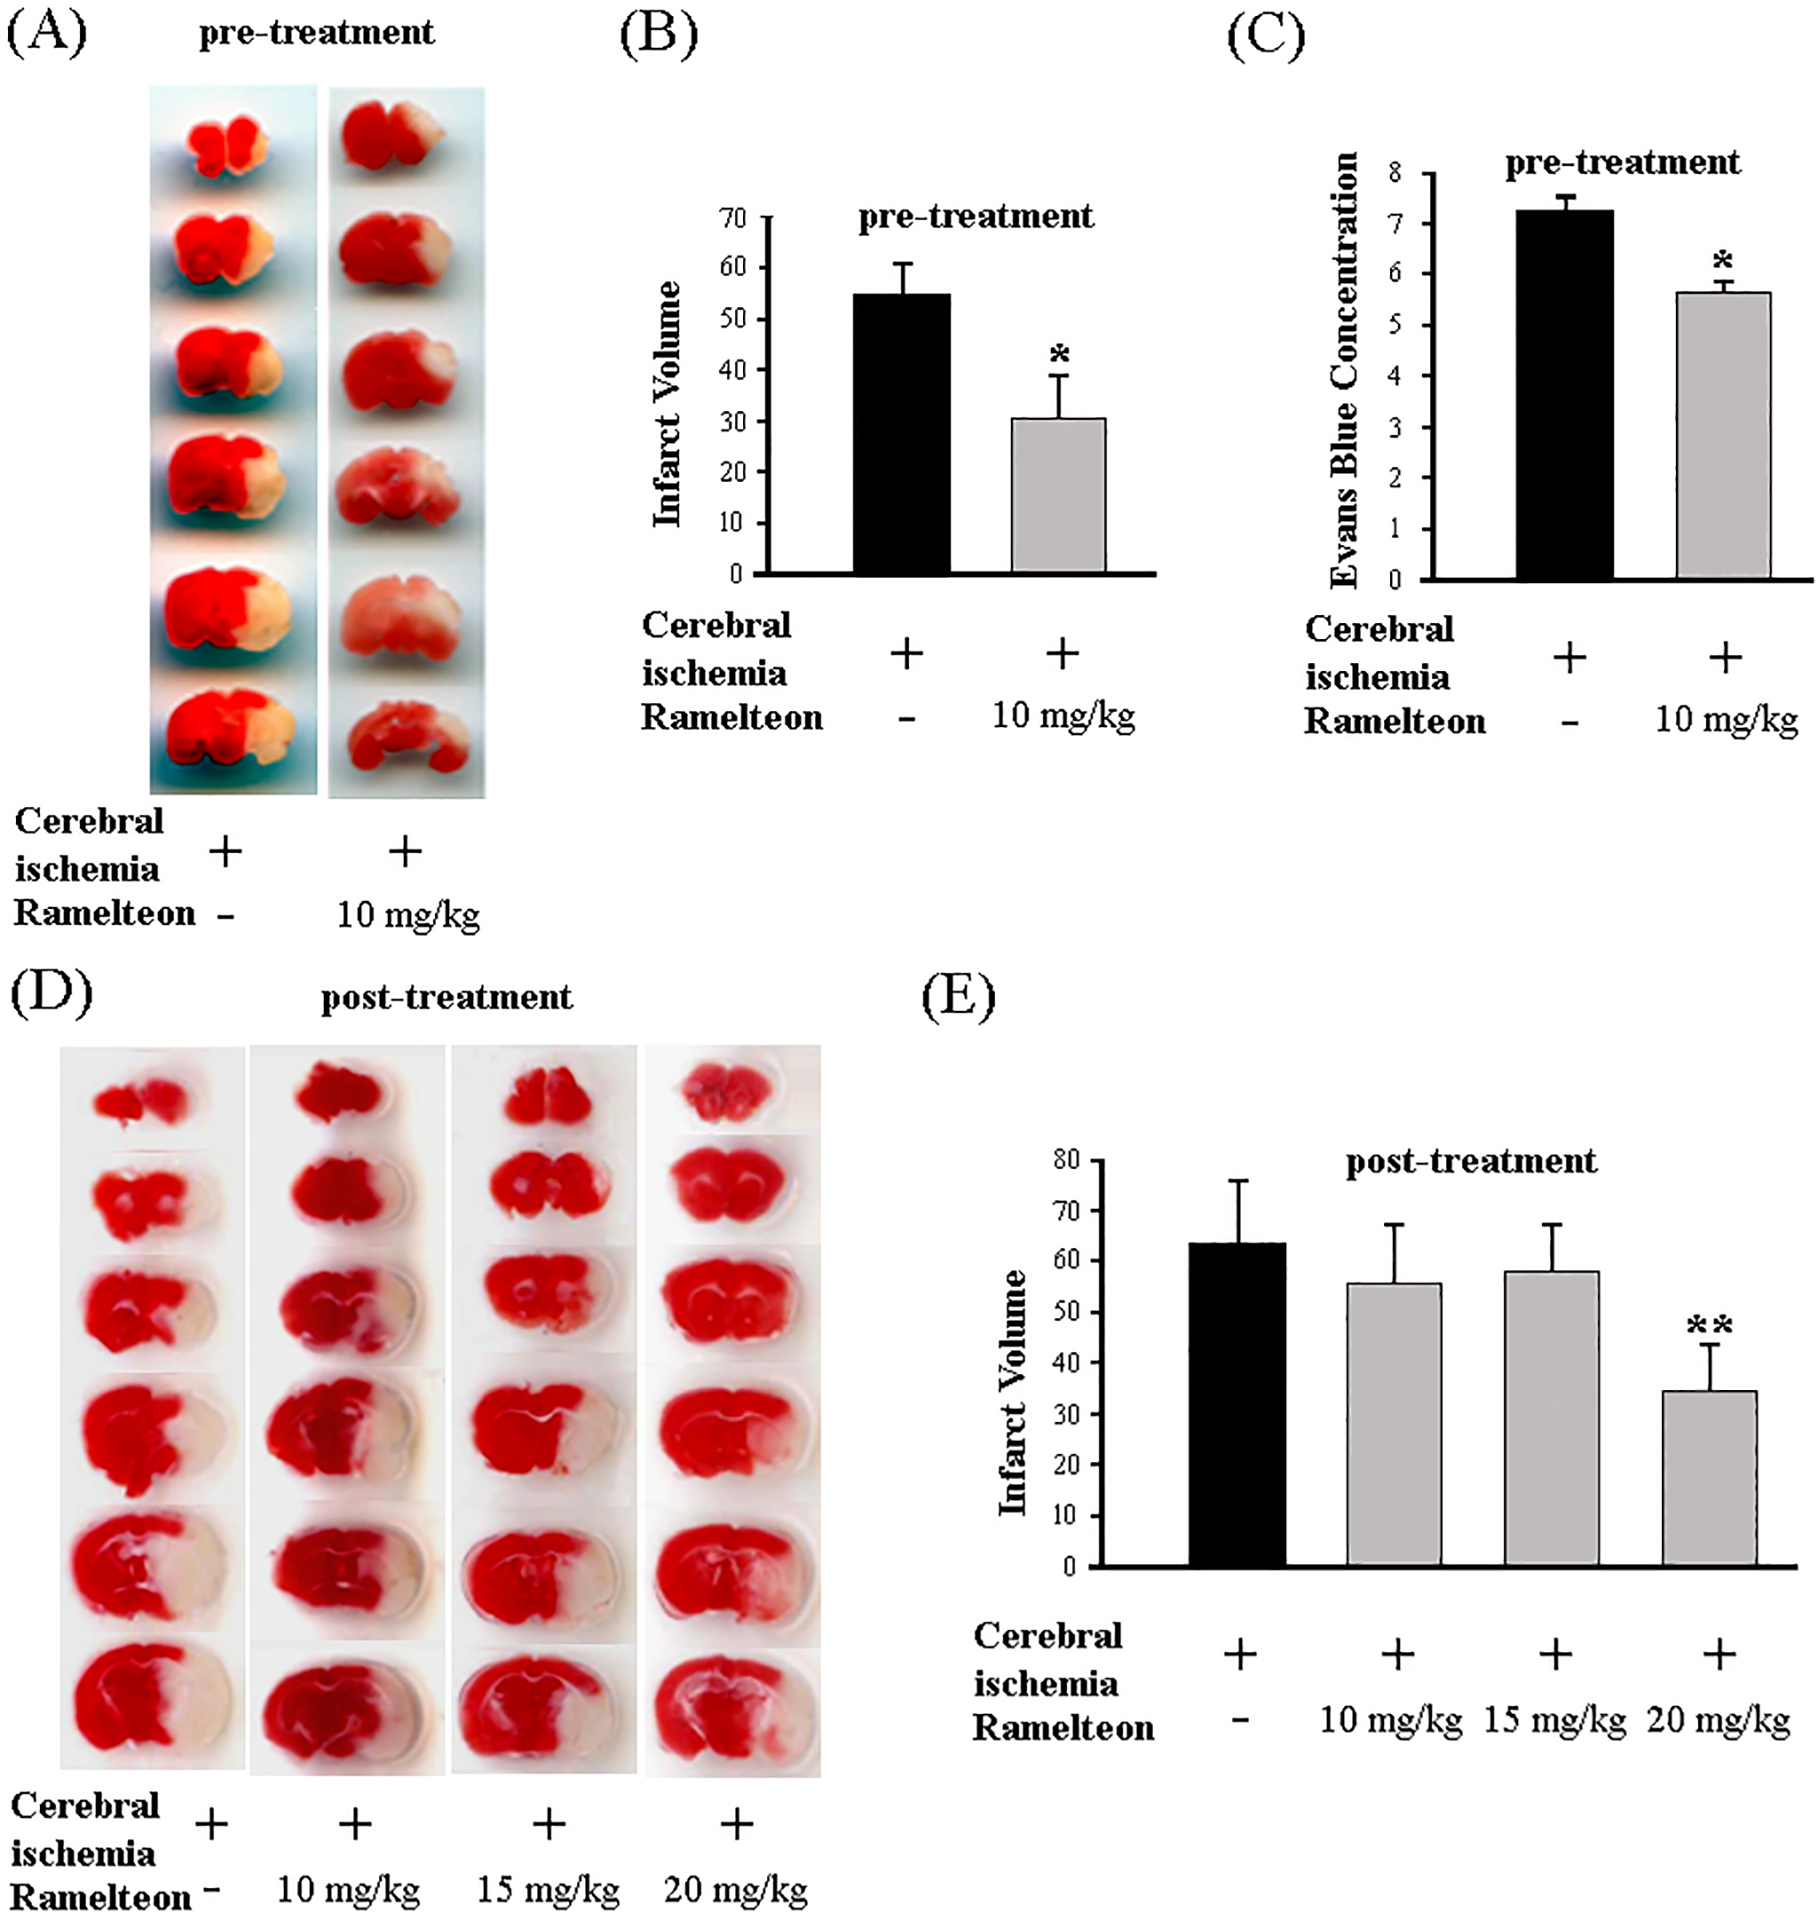
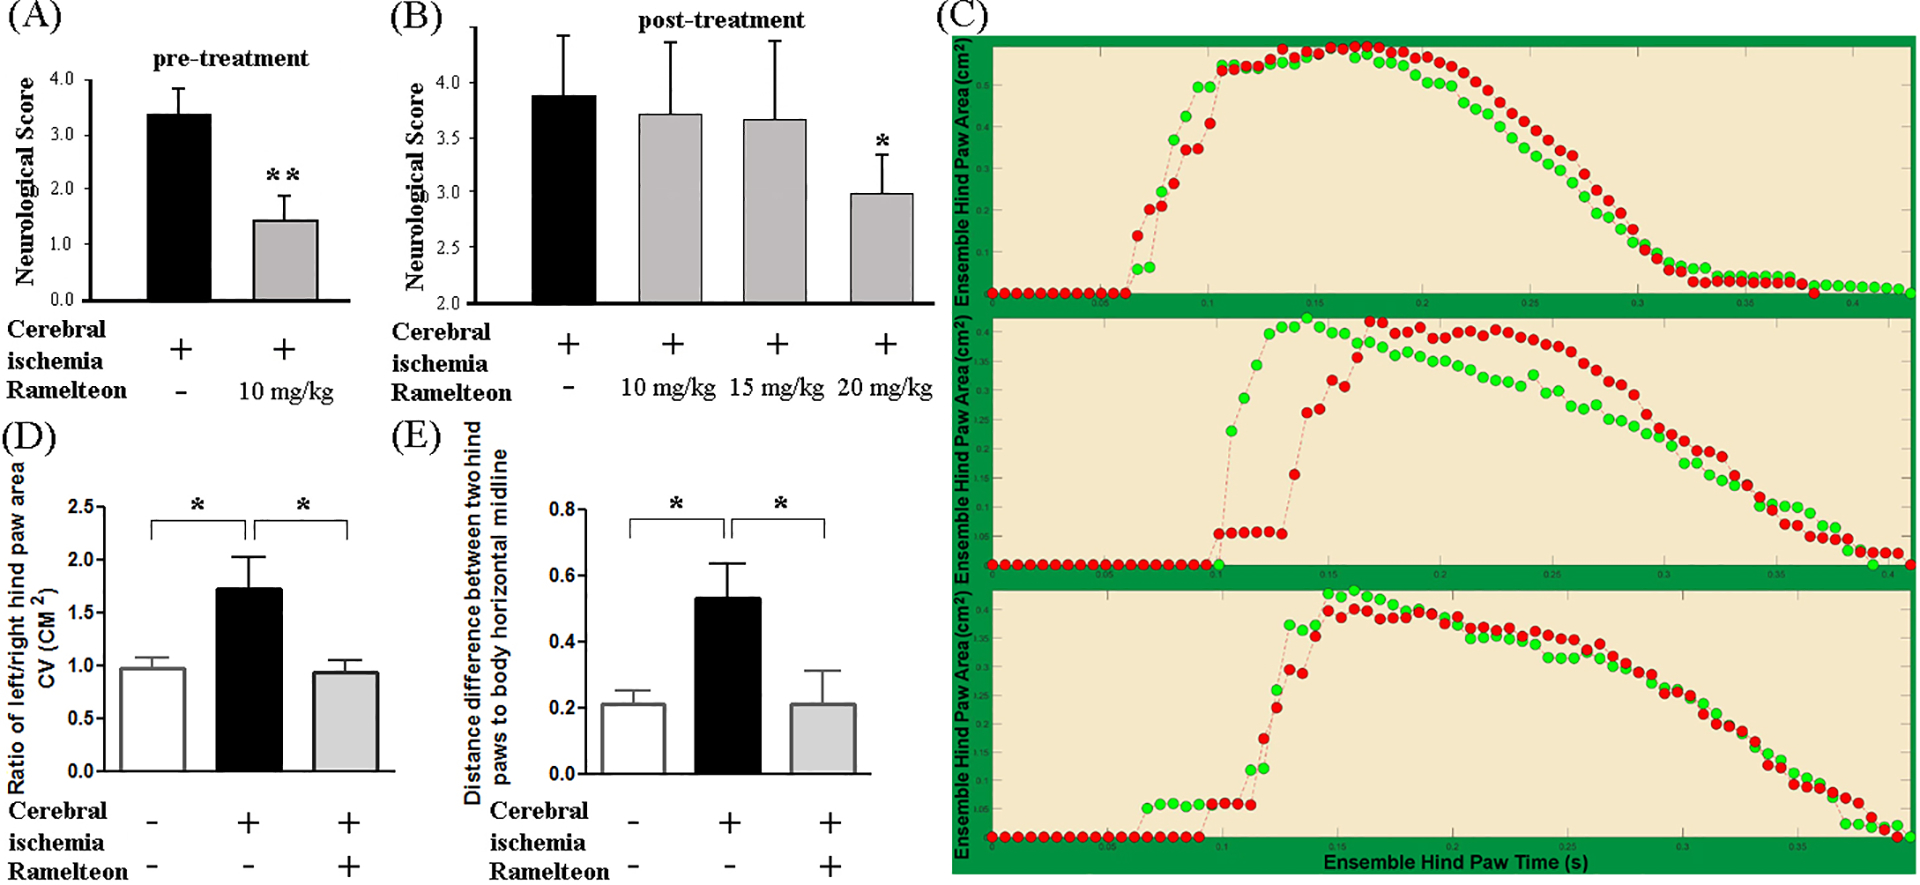
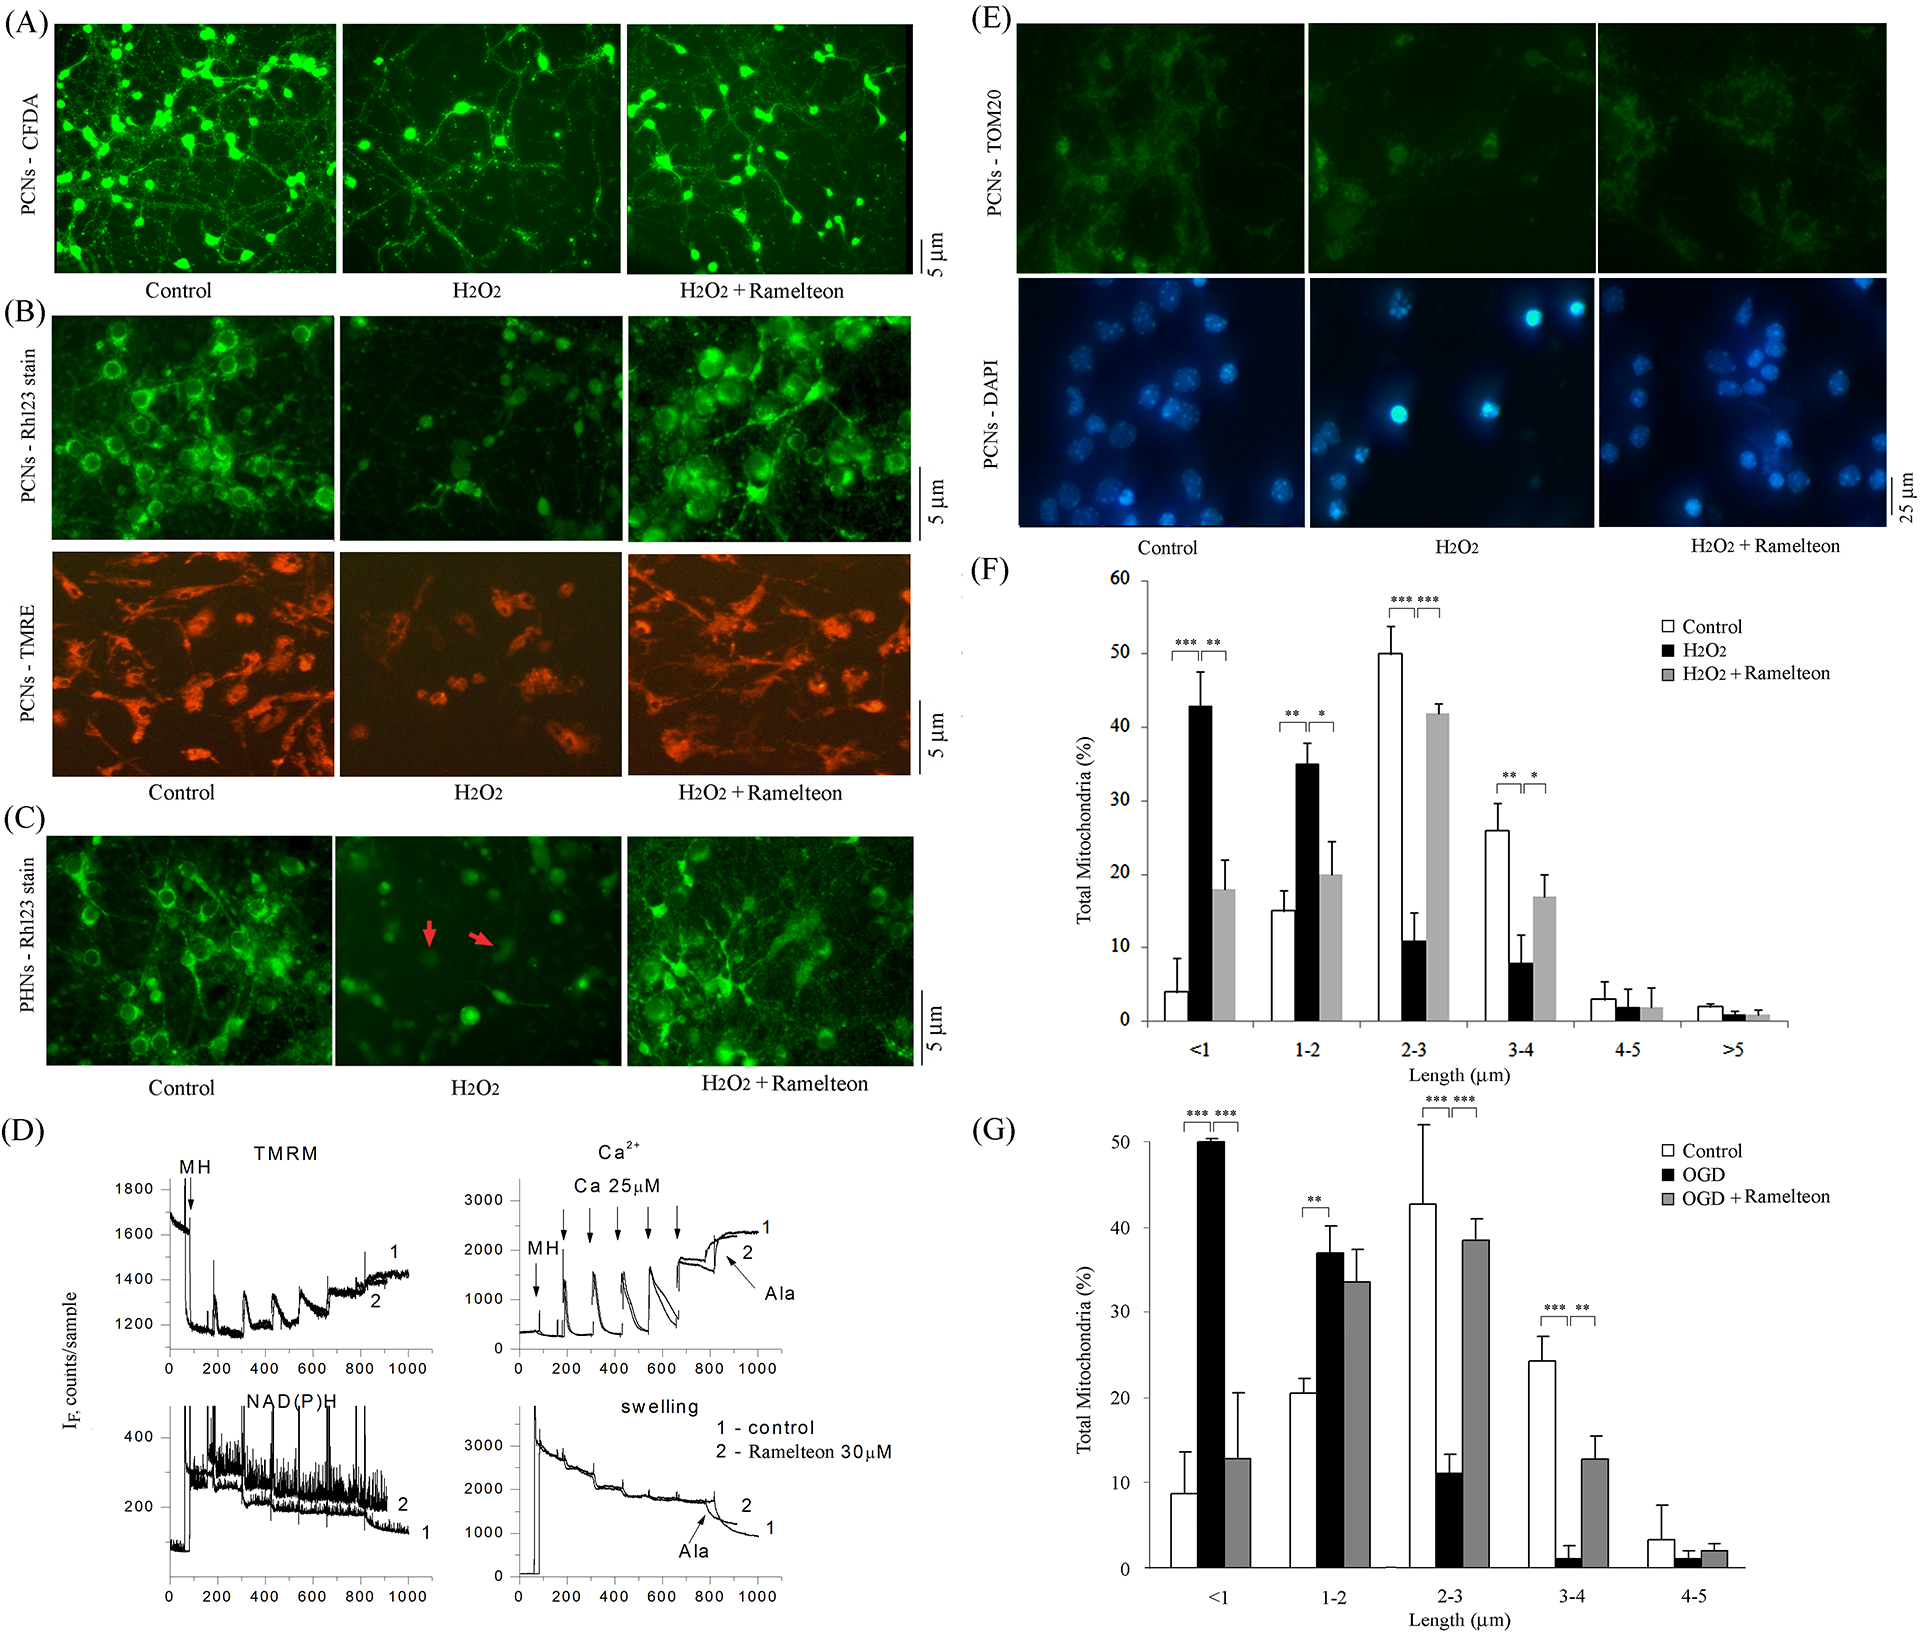
Stroke is the leading cause of death and disability worldwide. Novel and effective therapies for ischemic stroke are urgently needed. Here, we report that melatonin receptor 1A (MT1) agonist ramelteon is a neuroprotective drug candidate as demonstrated by comprehensive experimental models of ischemic stroke, including a middle cerebral artery occlusion (MCAO) mouse model of cerebral ischemia in vivo, organotypic hippocampal slice cultures ex vivo, and cultured neurons in vitro; the neuroprotective effects of ramelteon are diminished in MT1-knockout (KO) mice and MT1-KO cultured neurons. For the first time, we report that the MT1 receptor is significantly depleted in the brain of MCAO mice, and ramelteon treatment significantly recovers the brain MT1 losses in MCAO mice, which is further explained by the Connectivity Map L1000 bioinformatic analysis that shows gene-expression signatures of MCAO mice are negatively connected to melatonin receptor agonist like Ramelteon. We demonstrate that ramelteon improves the cerebral blood flow signals in ischemic stroke that is potentially mediated, at least, partly by mechanisms of activating endothelial nitric oxide synthase. Our results also show that the neuroprotection of ramelteon counteracts reactive oxygen species-induced oxidative stress and activates the nuclear factor erythroid 2-related factor 2/heme oxygenase-1 pathway. Ramelteon inhibits the mitochondrial and autophagic death pathways in MCAO mice and cultured neurons, consistent with gene set enrichment analysis from a bioinformatics perspective angle. Our data suggest that Ramelteon is a potential neuroprotective drug candidate, and MT1 is the neuroprotective target for ischemic stroke, which provides new insights into stroke therapy. MT1-KO mice and cultured neurons may provide animal and cellular models of accelerated ischemic damage and neuronal cell death.

Keywords: CBF; MRI; MT1 receptor; MT1−/− cultured neurons; MT1−/− mice; Nrf2/HO-1; ROS; Ramelteon; bioinformatics; ischemic stroke; mitochondrial and autophagic death pathways; p-eNOS/eNOS.


Conflict of interest statement

CONFLICT OF INTEREST

The authors declare no conflict of interest.

Figures

Figure 1
Figure 1. Ramelteon provides neuroprotection preventively and therapeutically in an MCAO mouse model of cerebral ischemia.
Ramelteon (10 mg/kg) was administered by IP injection 10 min before and 20 min after the onset of MCAO (preventive pre-treatment in A-C). Brains were removed after 24 h of ischemia, cut into coronal sections, and stained with 2% TTC. Lesion size (A, B) was determined for mice injected with saline (MCAO group, n = 10) and ramelteon (MCAO + ramelteon group, n = 10). Ramelteon (10, 15, 20 mg/kg) was administered by IP injection 1 h after the onset of MCAO (therapeutic post-treatment, n = 5–8) (D, E). Lesion size (B, E) was determined for mice injected with saline and ramelteon (n = 6 – 8). The data are presented as mean ± SEM, *p < 0.05, **p < 0.01. Deficits in BBB permeability were induced in MCAO-exposed vehicle mice, and ramelteon significantly reduced BBB injury in MCAO-exposed mice (C). Evans blue dye (2% in saline, 4 ml/kg body weight) was injected intravenously as a BBB permeability tracer via the tail vein 0.5 h before the animals were sacrificed. Cortex tissue (100 mg) was dissected under a stereomicroscope and incubated in formamide at 60°C for 7–8 hours and extracted Evans blue dye was quantitatively measured at a wavelength of 620 nm and calculated using a standard curve. The Evans blue leakage was expressed as micrograms per gram of brain tissue and Evans blue concentration is shown (C), * p < 0.01.
Figure 2
Figure 2. Ramelteon reduces stroke lesion volume and enhances CBF in MCAO mice.
Experimental mice, including the control group, MCAO group, ramelteon (20 mg/kg) treated MCAO group at 72 h after the MCAO operation, were scanned on a Bruker 7 Tesla MRI scanner. T2WI was generated, and accumulated stroke lesion volume was quantitatively assessed with 3D Slice software (A, B). CBF was analyzed, and representative photos of three groups of mice were shown (C). The average difference of CBF (D) for an ischemic region/ipsilateral hemisphere was compared with their anatomical parallel in the contralateral hemisphere among the three groups of mice (n = 3–4/group). Furthermore, the control group, MCAO group, ramelteon (20 mg/kg) treated MCAO group at 24 h after the MCAO operation were scanned, and the representative LSCI images were presented (E). The blood flow index (PU) was compared (F). Brains of the three groups of mice were quickly removed, and whole cell lysates were extracted for analysis by WB using antibodies to p-eNOS (Ser1177) (upper panel, G) or eNOS (middle panel, G). β-actin was used as a loading control (lower panel, G). These blots are representative of three independent experiments. Densitometry was performed to quantify the intensity of the p-eNOS (Ser1177) or eNOS bands compared to that from β-actin (H or I, respectively, *p < 0.05, **p < 0.01).
Figure 3
Figure 3. Ramelteon improves MCAO-caused neurological and behavioral deficits.
Animals were assessed for neurological deficits 24 h (A, B) or Digi Gait analysis 48 h (D) after the MCAO procedure in indicated groups of mice. Ramelteon (10, 15, or 20 mg/kg) was administered preventively (A) and therapeutically (B-D). Each mouse was assigned a neurological score, and the neurological score was compared (A, n = 10; B, n = 5 – 8). Mice were submitted to the Digi Gait automated gait analysis system on a treadmill set at 15 cm/second. A representative gait signal in the control group, MCAO group, and MCAO + ramelteon group were shown by the ensemble paw area (cm2) (C). Behavioral quantitative gait parameters measured post-ischemia include a ratio of left/right hind paw area and distance difference between two hind paws to the body horizontal midline. The ratio of left/right hind paw area and distance difference between two hind paws to the body horizontal midline in different groups of mice (D and E, respectively, n = 3 – 8) were compared. Statistically significant differences are indicated with *p < 0.05 and **p < 0.01.
Figure 4
Figure 4. Neuroprotective effects of ramelteon on the cell death of PCNs and PHNs in vitro and OHSCs ex vivo.
Cell death of PCNs (A-C), PHNs (D-F), HT-22 cells (G), and OHSCs (H, I) was induced by 3 h exposure to OGD (A, D, G, H, I) or 18 h exposure to 0.5 mM NMDA (B, E) and 1000 μM H2O2 (C, F) ± a series of concentrations of ramelteon. Cultured cells and OHSCs were preincubated with ramelteon for 2 h. Cell death was evaluated by LDH assay (A-F, I) or MTS assay (G). Data from three independent experiments are presented, and statistically significant differences are indicated with *p < 0.05, **p < 0.01, and ***p < 0.001. The resulting curves (plotted semi-logarithmically) define the IC50 and maximum protection calculated by the GraphPad Prism program. PI fluorescence images were obtained (H). Hippocampal slices under normal control conditions displaying background PI fluorescence (H, left). Intense PI labeling in OHSCs exposed to OGD mainly occurred in the CA1, CA3 pyramidal cell fields as well as dentate gyrus (H, middle). Ramelteon significantly attenuated PI labeling, demonstrating neuroprotective effects (H, right). Scale bars: upper lane, 0.5 mm; lower lane, 0.1 mm.
Figure 5
Figure 5. Ramelteon inhibits the dissipation of mitochondrial ΔΨm, mitochondrial fragmentation, and morphology alteration.
PCNs (B, E, F, G) and PHNs (A, C) were subjected to 1000 μM H2O2 (A-C, E, F) for 18 h or 3 h OGD (G) with or without 10 μM ramelteon. Neurite growth in PHNs was observed and analyzed by CFDA stain (A). PHNs under normal control conditions display regular CFDA fluorescence (A, left). Remarked reduction of CFDA stain in PHNs exposed to H2O2 (A, middle). Ramelteon significantly attenuated the loss of CFDA and the loss of neurite outgrowth, demonstrating its effect on augmenting neurogenesis (A, right). Living cells were stained with 2 μM Rh 123 (green in B, upper panel, and C) or TMRE (red-orange in B, lower panel). Brain mitochondria (0.25 mg/ml) energized with glutamate/malate 5 mM were challenged with a series of Ca 2+ additions (25 mM each) until they began to spontaneously release Ca 2+ (D). Changes ΔΨm and absorbance, indicators of mitochondrial swelling and induction of mPT, were monitored. Alamethicin (Ala) was added. Ramelteon (30 μM) was added 1 min before Ca 2+ addition. Representative images of TOM20 immunostaining (green) and DAPI staining (blue) were shown (E). ImageJ software was used to set a scale and Nano Measurers software to measure the percentage of various mitochondrial lengths (F, G). A minimum of 200 mitochondria/per picture was counted. Mitochondria were classified into different categories from a length ranging from < 1, 1–2, 2–3, 3–4, 4–5, to > 5 μm. The quantitative measurement represents three independent experiments. White bars: control PCNs. Black bars: H2O2- or OGD-treated PCNs. Grey bars: PCNs with H2O2 or OGD ± ramelteon. *p < 0.05, **p < 0.01, and ***p < 0.001. Scale bars correspond to 5 μm (A-C) or 25 μm (E).
Figure 6
Figure 6. Ramelteon inhibits mitochondrial and autophagic cell death.
PCNs (A, C, D, G, I, J) and OHSCs (E) were induced by subjecting PCNs to 1000 μM H2O2 for 18 h (A, C, D, G, I, J) and subjecting OHSC to 1500 μM H2O2 for 18 h (E) ± 10 μM ramelteon. Ramelteon (10 mg/kg) was administered by IP injection 10 min before and 20 min after the onset of MCAO (B, F, H, K, L). PCNs were extracted, and either cytosolic components (A) or whole-cell lysates (C, D, G, I) were analyzed by WB. Lysates of brain tissue were resolved into cytosolic fractions (B) or whole-cell lysates (F, H, K, L) for analysis by WB. Each sample (50 μg of protein) was analyzed by antibodies to cyto. c (A, B), or caspase-3 (C, E, F), or LC-3/Beclin 1/P62 (G, H) or Nrf2/HO-1 (J, K, L). β-actin was used as a loading control. Densitometry was performed to quantify the intensity of the bands from the three independent experiments. Caspase-3 activity was also quantified using a fluorogenic assay in lysed PCNs (D). PCN cell lysates in indicated treatments were centrifuged for 10 min at 3000 rpm, and generated supernatants were submitted for intercellular ROS (IU/ml) measurement (I). Conditioned media was collected and assayed for mature IL-1β release after the completion of H2O2 induction (M). The quantitative analyses come from three independent experiments (D, I, J). In all graphs, data are presented as mean ± SEM, statistically significant effects are marked with *p < 0.05, **p < 0.01, and ***p < 0.001. White bars correspond to control PCNs (A, C, D, E, G, I, J) or brain samples from animals (B, F, H, K, L) that neither underwent MCAO nor received ramelteon. Black bars correspond to samples from H2O2-treated PCNs (A, C, D, E, G, I, J) or saline-injected animals (B, F, H, K, L) that did undergo MCAO. Grey bars correspond to samples from H2O2- and ramelteon-treated PCNs (A, C, D, E, G, I, J) or test mice (B, F, H, K, L) that were both treated with ramelteon and underwent MCAO.
Figure 7
Figure 7. Bioinformatic analysis of ramelteon.
(A). Ramelteon’s differential expression profile was used as input to the online CMap tool L1000. L1000 generated three connections, Anti-Amyloidogenic Agents, JAK Inhibitor and ATPase Inhibitor. Green bars are positive connections and the red bar is a negative connection. These connections, especially the strong negative connection with ATPase inhibitor at 97%, are consistent with ramelteon’s neuroprotection role observed in vivo and in vitro. (B). The bar graph of the CMap connections of the differentially expressed genes by ramelteon. (C). MCAO mouse’s differential expressed genes were used as input to the online CMap tool L1000. L1000 generated five interesting connections, Aurora Kinase Inhibitor, JAK Inhibitor, Mitochondrial Complex I Inhibitor, Src Inhibitor and Melatonin Receptor Agonist. A heatmap representing the connection name and connection score, instances in red area and yellow area indicate negative connection score and instances in green area indicate positive connection score. The negative connection with melatonin receptor agonists is consistent with MT1 deficiency in the brains of MCAO mice. (D). The bar graph of the CMap connections of MCAO mice differential expressions, with the green bar being a positive connection and the red bars being negative connections. (E). The heatmap of the CMap connections. Legends: AKI (Aurora Kinase Inhibitor), JI (JAK Inhibitor), MCII (Mitochondrial Complex I Inhibitor), SI (Src inhibitor), MRA (Melatonin Receptor Agonist), and CS (Connection Score).
Figure 8
Figure 8. MT1 is the neuroprotective target of ramelteon in cellular and animal models of ischemic stroke.
MT1 brain levels are reduced in MCAO mice and ramelteon mainly recovers MT1 expression (A); Luzindole eliminates the neuroprotection of ramelteon (B, C); Knockdown of MT1 directly blocks the protection of ramelteon in primary neurons in vitro and MCAO mice in vivo (D, E). Ramelteon (20 mg/kg) was administered by IP injection about 60 mins after the onset of MCAO (A). Brains of indicated groups of mice were quickly removed, and wholecell lysates were extracted for analysis by WB using antibodies to MT1 (A). β-actin was used as a loading control (A). This blots are representative of three independent experiments. Densitometry was performed to quantify the intensity of the MT1 bands compared to that from β-actin (B, n = 6–8 in each group (A), *p < 0.05, **p < 0.01). PCN (B) or PHN (C) cell death was induced by 18 h exposure to 1000 μM H2O2 ± ramelteon (1, 5, 7.5, and 10 μM) in the presence or absence of luzindole. White bars represent control PCNs (B) or PHNs (C). Black bars represent H2O2-treated PCNs (B) or PHNs (C). Grey bars represent H2O2- and ramelteon-treated PCNs (B) or PHNs (C). Red bars represent H2O2- and ramelteon-treated PCNs (B) or PHNs (C) in the presence of luzindole. Cell death of PCN from wild-type mice (D, white bars) or MT1−/− mice (D, blue bars) was induced by 18 h exposure to 1000 μM H2O2 ± ramelteon (1, 5, 7.5, and 10 μM). Cells were preincubated with ramelteon or luzindole for 2 h. Cell death was evaluated by LDH assay (B-D). Data from three independent experiments are presented, and statistically significant differences are indicated with *p < 0.05, **p < 0.01, and ***p < 0.001. Ramelteon (10 mg/kg) was administered by IP injection 10 min before and 20 min after the onset of MCAO in MT1−/− mice. Lesion size (E, F, blue bars) and neurological scores (G, blue bars) were determined for mice injected with saline and ramelteon (n = 6–7). Brains were quickly removed after 24 h of ischemia, cut into coronal sections, and stained with 2% TTC, and neurological scores were rated. The data are presented as mean ± SEM.

References

    1. Wang X, Figueroa BE, Stavrovskaya IG, Zhang Y, Sirianni AC, Zhu S, Day AL, Kristal BS, Friedlander RM. Methazolamide and melatonin inhibit mitochondrial cytochrome c release and are neuroprotective in experimental models of ischemic injury. Stroke. 2009;40:1877–1885 - PMC - PubMed
    1. Zhou H, Wang J, Jiang J, Stavrovskaya IG, Li M, Li W, Wu Q, Zhang X, Luo C, Zhou S, Sirianni AC, Sarkar S, Kristal BS, Friedlander RM, Wang X. N-acetyl-serotonin offers neuroprotection through inhibiting mitochondrial death pathways and autophagic activation in experimental models of ischemic injury. The Journal of neuroscience : the official journal of the Society for Neuroscience. 2014;34 - PMC - PubMed
    1. Sinha B, Wu Q, Li W, Tu Y, Sirianni AC, Chen Y, Jiang J, Zhang X, Chen W, Zhou S, Reiter RJ, Manning SM, Patel NJ, Aziz-Sultan AM, Inder TE, Friedlander RM, Fu J, Wang X. Protection of melatonin in experimental models of newborn hypoxic-ischemic brain injury through mt1 receptor. Journal of pineal research. 2018;64 - PubMed
    1. Wang X, Sirianni A, Pei Z, Cormier K, Smith K, Jiang J, Zhou S, Wang H, Zhao R, Yano H, Kim JE, Li W, Kristal BS, Ferrante RJ, Friedlander RM. The melatonin mt1 receptor axis modulates mutant huntingtin-mediated toxicity. J Neurosci. 2011;31:14496–14507 - PMC - PubMed
    1. Zhang Y, Cook A, Kim J, Baranov SV, Jiang J, Smith K, Cormier K, Bennett E, Browser RP, Day AL, Carlisle DL, Ferrante RJ, Wang X, Friedlander RM. Melatonin inhibits the caspase-1/cytochrome c/caspase-3 cell death pathway, inhibits mt1 receptor loss and delays disease progression in a mouse model of amyotrophic lateral sclerosis. Neurobiol Dis. 2013;55:26–35 - PMC - PubMed