[Preprint]. 2024 Feb 5:2023.10.16.562452.
doi: 10.1101/2023.10.16.562452.

Transcriptome-wide analysis of the function of Ded1 in translation preinitiation complex assembly in a reconstituted in vitro system

Affiliations

Transcriptome-wide analysis of the function of Ded1 in translation preinitiation complex assembly in a reconstituted in vitro system

Fujun Zhou et al. bioRxiv. .

Update in

Abstract

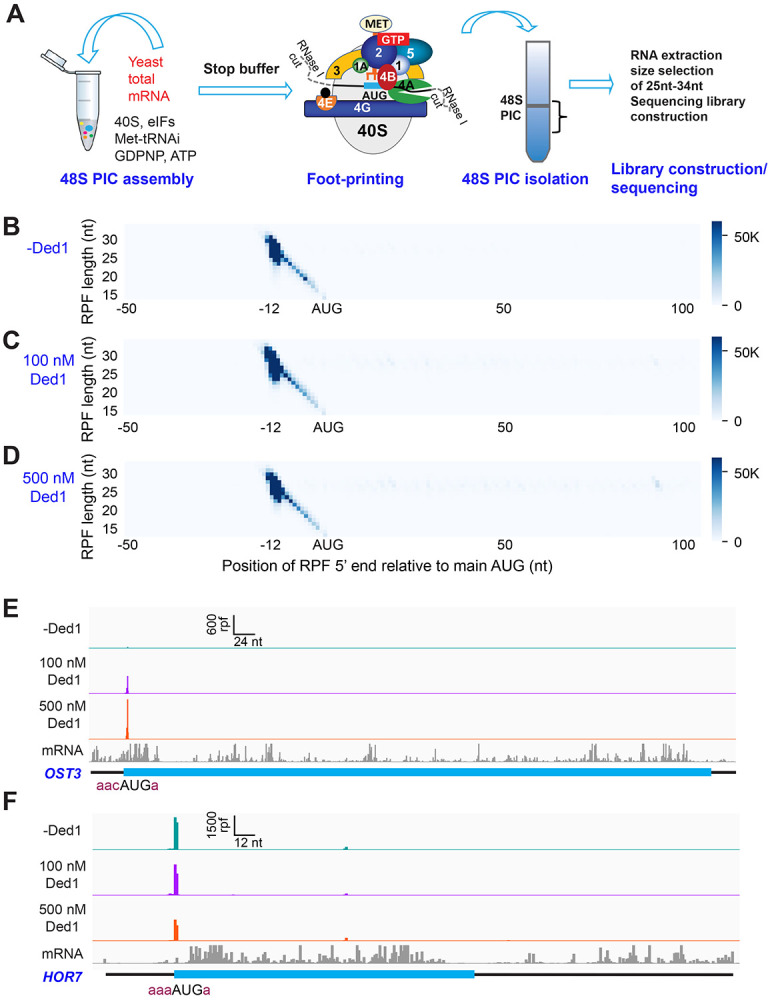
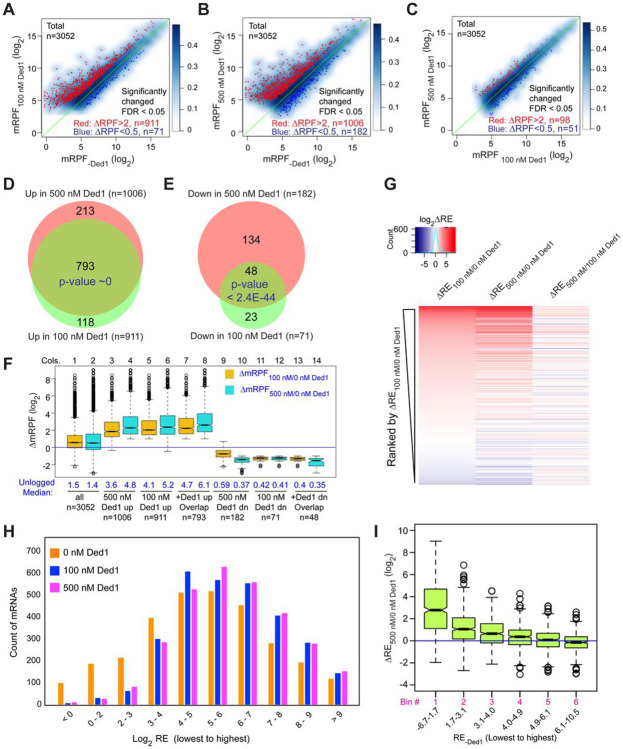
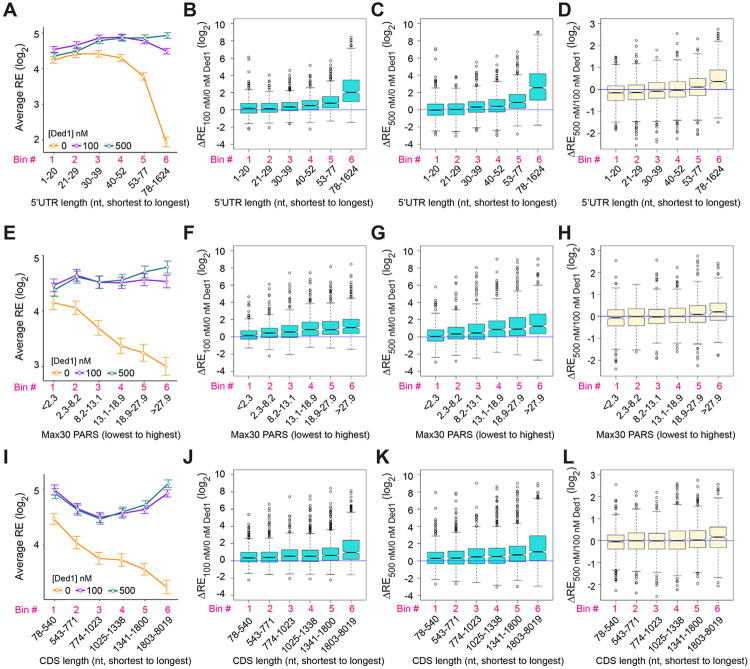
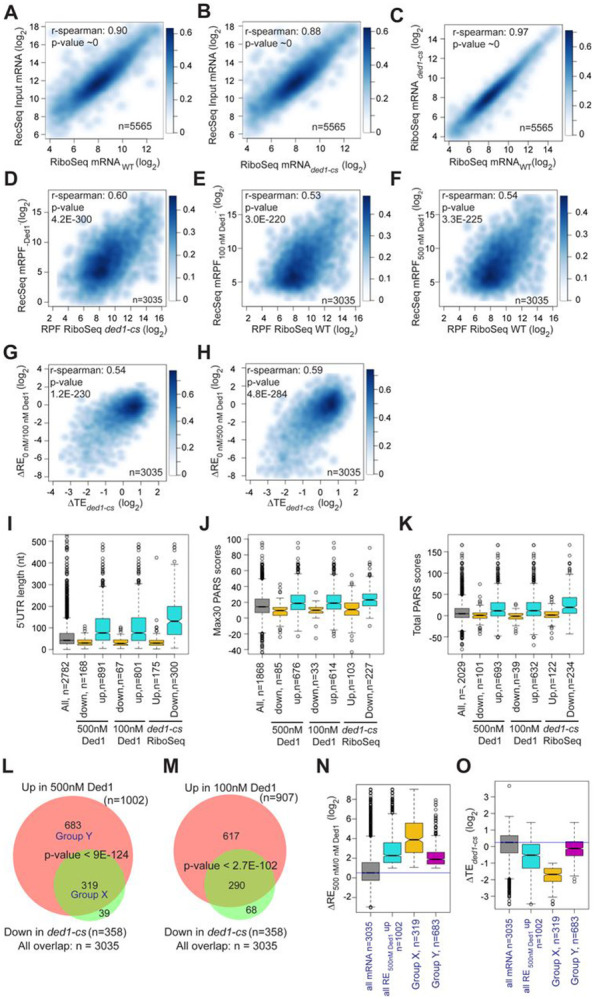
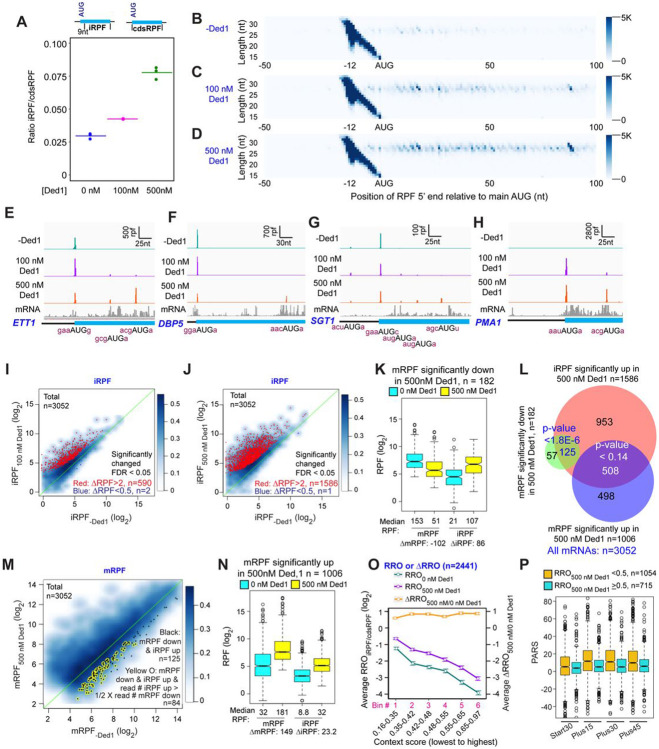
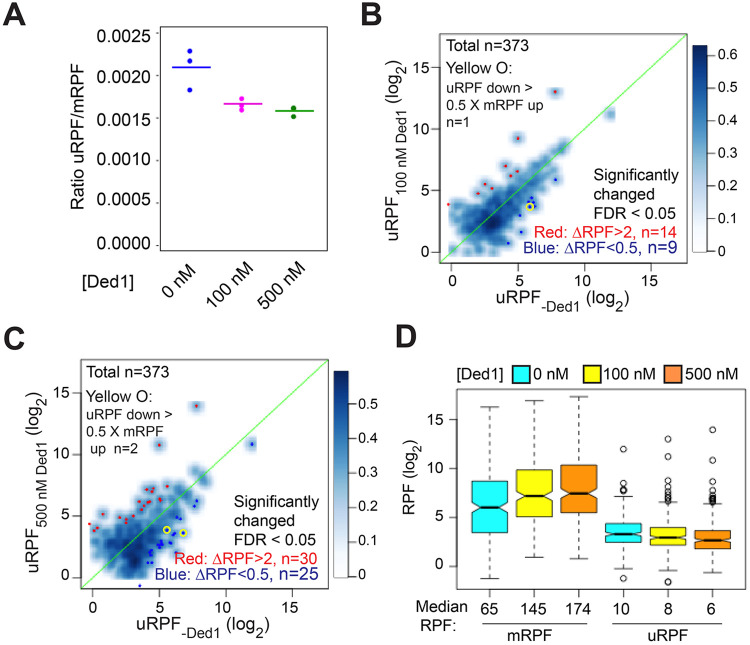
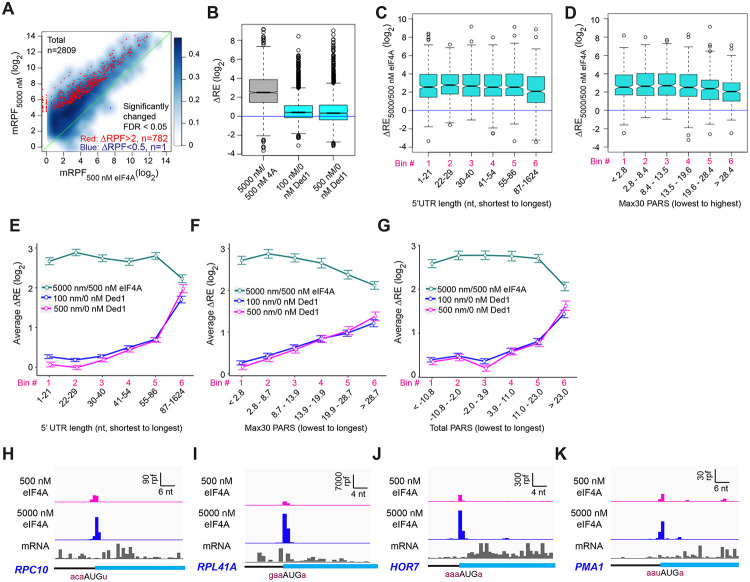
We have developed a deep sequencing-based approach, Rec-Seq, that allows simultaneous monitoring of ribosomal 48S pre-initiation complex (PIC) formation on every mRNA in the translatome in an in vitro reconstituted system. Rec-Seq isolates key early steps in translation initiation in the absence of all other cellular components and processes. Using this approach we show that the DEAD-box ATPase Ded1 promotes 48S PIC formation on the start codons of >1000 native mRNAs, most of which have long, structured 5'-untranslated regions (5'UTRs). Remarkably, initiation measured in Rec-Seq was enhanced by Ded1 for most mRNAs previously shown to be highly Ded1-dependent by ribosome profiling of ded1 mutants in vivo, demonstrating that the core translation functions of the factor are recapitulated in the purified system. Our data do not support a model in which Ded1acts by reducing initiation at alternative start codons in 5'UTRs and instead indicate it functions by directly promoting mRNA recruitment to the 43S PIC and scanning to locate the main start codon. We also provide evidence that eIF4A, another essential DEAD-box initiation factor, is required for efficient PIC assembly on almost all mRNAs, regardless of their structural complexity, in contrast to the preferential stimulation by Ded1 of initiation on mRNAs with long, structured 5'UTRs.


Figures

Figure 1.
Figure 1.. Recruitment Sequencing (Rec-Seq) allows transcriptome-wide analysis of early steps of translation initiation in a purified system.
(A) Overview of steps in the Rec-Seq method. 48S ribosomal pre-initiation complexes (PICs) are assembled in vitro from purified S. cerevisiae components. 48S PICs are treated with RNase I to digest unprotected mRNA and then isolated using sucrose density gradient ultracentrifugation. Ribosome-protected mRNA fragments (RPFs) are used to construct a sequencing library. (B-D) Metagene plots of RPF distributions over 150 nt windows (−50 to +100 nt) on all mRNAs aligned to their main AUG start codons for no Ded1 (B); 100 nM Ded1 (C), or 500 nM Ded1 (D). RPF lengths are shown on the Y axis and the position of the 5’ends of the RPFs relative to the main start codon are shown on the X axis. A 5’end located 12 nt from the start codon is expected for 48S PICs with the AUG in the P site of the 40S subunit (Wagner et al. 2020). The color scale shows RPF density. All reads for 3 replicates for each condition were combined. (E, F) RPFs for the 0, 100 and 500 nM Ded1 experiments for previously identified Ded1 hypo-dependent (OST3, E) and hyper-dependent (HOR7, F) mRNAs. The position of the main CDS is shown in cyan and the −3 to −1 and +4 context nucleotides surrounding the main AUG are shown in brick red text. mRNA sequencing reads are also shown below each set of tracks (gray). The Integrated Genome Viewer (IGV, Broad Institute) was used to display RPF and mRNA reads, with RPF and nucleotide (nt) scales indicated on top of each panel. For these and all other gene browser views, the RPFs are plotted to their predicted P-site positions, and the mRNA reads are plotted to their first position from their transcript 5’ends.
Figure 2.
Figure 2.. Ded1 promotes the recruitment of a group of 1000 mRNAs.
(A-C) Scatterplots of normalized read densities on the main start codons of mRNAs (mRPF, number of RPFs mapping to the main AUG normalized by the geometric means of the spike-in internal control RPFs) for 3052 mRNAs with > 90 total reads in 9 samples (3 replicates each for 0, 100 and 500 nM Ded1) for 100 versus 0 nM Ded1 (A), 500 versus 0 nM Ded1 (B), or 500 versus 100 nM Ded1 (C). mRNAs with significantly changed recruitment were defined as those with false discovery rates (FDR) < 0.05 and RPF changes (ΔRPF) of > 2 for increased or < 0.5 for decreased are indicated in red or dark blue, respectively. The number of significantly changed mRNAs are indicated in red (increased) and blue (decreased). (D and E) Overlaps between the mRNAs displaying significantly increased (D) or significantly reduced (E) mRPFs between 100 and 500 nM Ded1 conditions. P-values for the overlap between each group were calculated using an online tool (http://nemates.org/MA/progs/overlap_stats.html). (F) Box plot analysis of the distribution and median of log2 change in mRPF between 0 and 100 nM Ded1 (ΔmRPF100/0 nM Ded1, orange) or 0 and 500 nM Ded1 (ΔmRPF500/0 nM Ded1, cyan) for all 3052 mRNAs (cols. 1-2), and for the following 6 groups of mRNAs: 1006 or 911 for which mRPFs were significantly up in 500 or 100 nM Ded1, respectively, relative to no Ded1 (cols. 3-6, for red dots in B and A); 793 mRNAs for which mRPFs were significantly up with both 100 and 500 nM Ded1 (cols. 7-8, for the overlapping mRNAs in D); 182 and 71 mRNAs for which mRPFs were significantly down in 500 or 100 nM Ded1 relative to no Ded1 (cols. 9-12, blue dots in B and A); and 48 mRNAs for which mRPFs were significantly down with both 100 and 500 nM Ded1 (cols.13-14, for the overlaps in E). The blue horizontal line shows no change in mRPFs (ΔmRPF = 1). (G) Heat-map analysis of the recruitment efficiency changes ΔRE100/0 nM Ded1, ΔRE500/0 nM Ded1 and ΔRE500/100 nM Ded1 for the 3052 mRNAs described in A-C, ordered by rank of ΔRE100/0 nM Ded1 from most increased (top) to most decreased (bottom) using the R heatmap.2 function. (H) The distributions of all observed mRNAs across 10 bins of increasing RE values at each concentration of Ded1 (0, 100, 500 nM). (I) Boxplot analysis of ΔRE500/0 nM Ded1 for all 3052 observed mRNAs binned by RE in the absence of Ded1 (RE-Ded1) from the lowest to the highest.
Figure 3.
Figure 3.. Ded1 promotes the recruitment of mRNAs with long or structured 5’UTRs.
(A) Line plot analysis of average recruitment efficiency (RE) for the 2804 mRNAs observed in the RecSeq experiments that have annotated 5’UTRs binned by 5’UTR length at 0, 100 and 500 nM Ded1. Average RE values were determined from the RE values of all mRNAs in each bin. (B-D) Box plot analyses of the recruitment efficiency changes (ΔRE) between each of two different conditions for the same mRNA bins as in (A) for ΔRE100/0nM_Ded1 (B), ΔRE500/0nM_Ded1 (C), or ΔRE500/100nM_Ded1 (D). (E) Line plot analysis of average RE values for the 1874 mRNAs observed in the RecSeq experiments with reported PARS scores binned according to Max30 PARS scores from the lowest to highest. PARS scores were determined by Kertesz et al. (2010) and Max30 and other PARS score intervals were calculated as described in Sen et al. (2015). (F-H) Box plot analyses for the same mRNA bins as in (E) for ΔRE100/0nM_Ded1 (F), ΔRE500/0nM_Ded1 (G), or ΔRE500/100nM_Ded1 (H). (I) Line plot analysis of average REs for all 3052 mRNAs divided into six equal-sized bins according to CDS lengths from the shortest to the longest for 0, 100 and 500 nM Ded1. (J-L) Box plot analysis for the same mRNA bins as in (I) for ΔRE100/0nM_Ded1 (J), ΔRE500/0nM_Ded1 (K), or ΔRE500/100nM_Ded1 (L). All bins contain an equal number of mRNAs.
Figure 4.
Figure 4.. Ded1 dependencies observed in Rec-Seq experiments correlate strongly with in vivo results from previous ribosome profiling of the ded1-cs mutant.
(A-B) Scatterplots comparing Rec-Seq input RNA reads and ribosome profiling mRNA reads of WT (A) or ded1-cs (B) strains. (C) Scatterplot comparing ribosome profiling mRNA reads between WT and ded1-cs strains. (D-F) Scatterplots comparing 48S PIC RPFs from Rec-Seq to 80S RPFs from ribosome profiling for the 3035 mRNAs that passed the significance cutoffs in both experiments for Rec-Seq at 0 nM Ded1 versus ribosome profiling of the ded1-cs mutant (D) or Rec-Seq at 100 nM (E) or 500 nM (F) Ded1 versus ribosome profiling of the WT strain. (G-H) Scatterplots comparing changes in translational efficiency (ΔTE) from ribosome profiling of the ded1-cs mutant versus WT to ΔRE0/100nM_Ded1 (G) or ΔRE0/500nM Ded1 (H) values from Rec-Seq. (I-K) Boxplot analysis of 5’UTR lengths (I), Max30 PARS (J), or Total PARS (K) for mRNAs with annotated 5’UTR lengths or PARS scores that showed significantly decreased (Down) or increased (Up) REs in 100 nM or 500 nM Ded1 versus no Ded1, or significantly increased (Up) or decreased (Down) TEs in the ded1-cs mutant versus WT. (L-M) Overlaps between mRNAs identified by Rec-Seq at 100 nM Ded1 (L) or 500 nM Ded1 (M) with significantly increased REs versus no Ded1 in Rec-Seq and mRNAs with significantly increased TEs in ribosome profiling of the ded1-cs mutant versus WT. P-values for the overlaps were calculated as described in Fig. 2D-E. Group X and Y mRNAs in (L) are those in common between the two groups being compared (X) or those found exclusively in the set of 1002 mRNAs with significantly increased RE in 500 nM Ded1 versus no Ded1 in Rec-Seq (Y). (N-O) Boxplot analysis of log2 ΔRE500/0nM_Ded1 (N) or log2 ΔTEded1-ts- (O) values for all 3035 mRNAs observed in both Rec-Seq and ribosome profiling, the 1002 mRNAs with significantly increased recruitment with 500 nM Ded1 versus no Ded1 (of L), the 319 mRNAs in group X (of L), and the 683 mRNAs in group Y (of L).
Figure 5.
Figure 5.. Ded1 increases leaky scanning of main start codons
(A) The ratio of the total RPFs internal to the CDS in mRNAs, excluding the main start codon, to the total RPFs for the full CDS including the main start codon (iRPF/cdsRPF ratio) for each of the three replicates at 0, 100 and 500 nM Ded1. iRPFs were counted from the +9 position of the main AUG to the stop codon, while the cdsRPFs were counted from the start codon to the stop codon of the CDS. The average of the three replicates is indicated by the colored bars (red, green and blue for 0, 100 and 500 nM Ded1, respectively). (B-D) Metagene plots showing RPF density distribution on all mRNAs aligned to their main AUGs as in Fig. 1B-D for 0 (B), 100 (C) and 500 nM Ded1 (D), with color scales adjusted to show internal RPFs (iRPFs). (E-H) 48S PIC RPFs and input mRNA reads on four selected mRNAs that showed elevated internal ribosome occupancies in 100 and 500 nM Ded1 conditions. The −3 to −1 and +4 context nucleotides surrounding the main AUG, iAUG or upstream AUG (uAUG) are indicated in brick red text. (I-J) Scatterplots comparing log2 iRPF between 100 (I) or 500 nM Ded1 (J) to 0 nM Ded1 as described in Fig. 2A-B for the same group of 3052 mRNAs. Red dots show mRNAs that meet the significance cutoff for increases in iRPF (FDR < 0.05, >2-fold increase in iRPFs) and blue dots show mRNAs that meet the significance cutoff for decreases in iRPF (FDR < 0.05, <0.5-fold decrease in iRPFs). (K) Box plot comparing mRPFs and iRPFs between 500 and 0 nM Ded1 for the 182 mRNAs that showed significantly reduced mRPFs with 500 nM Ded1 versus no Ded1. (L) Overlaps between mRNAs with significantly elevated iRPFs (orange), significantly reduced mRPFs (green) or significantly increased mRPFs (blue) with 500 nM Ded1 relative to 0 nM Ded1. The Venn diagram was generated and p-values calculated as in Fig. 2D. (M) Scatter plot comparing mRPFs with 500 nM versus 0 nM Ded1. The 125 mRNAs that showed significantly increased iRPFs and significantly decreased mRPFs in 500 nM Ded1 relative to 0 nM Ded1 are labeled by black dots. Among this set, the mRNAs for which the iRPFs increase by at least 50% of the decrease in mRPFs are labeled by yellow circles, to indicate the 84 mRNAs for which the decrease in mRPFs could be responsible for the increase in iRPFs. (N) Boxplot comparing mRPFs and iRPFs between 500 nM and 0 nM Ded1 for the 1006 mRNAs that showed significantly increased mRPFs. (O) Line plot analysis of average RRO (relative ribosome occupancy; iRPF/cdsRPF ratio; left axis) and ΔRRO500/0 nM Ded1 (right axis) for 2441 of 3052 mRNAs in J with 5’UTR length >5 nt binned by main AUG context scores from lowest to highest. (P) Boxplot analysis of Start30, Plus15, Plus30 and Plus45 PARS scores for mRNAs with RROiRPF/cdsRPF < 0.5 (orange) or ⩾ 0.5 with 500 nM Ded1.
Figure 6.
Figure 6.. Ded1 modestly promotes readthrough of start codons in 5’ UTRs of mRNAs.
(A) The ratios of RPFs in 5’UTRs to RPFs on main start codons (uRPF/mRPF ratios) for each of the three replicates with 0 (blue), 100 (magenta) or 500 (green) nM Ded1. The 5’UTR RPFs (uRPFs) were counted from the 5’end of the mRNA to the −5 position relative to the main AUG. The mean of the three replicates is indicated by the colored bars. uRPFs on GCN4 mRNA were analyzed separately (Fig. 6-S1), because 42% and 57% of all uRPFs were mapped to the GCN4 5’UTR in assays with 100 and 500 nM Ded1, respectively. (B-C) Scatterplots comparing uRPFs in the presence of either 100 nM (B) or 500 nM (C) Ded1 versus 0 nM Ded1. mRNAs with significantly increased or decreased uRPFs in the presence of Ded1 are indicated in red or dark blue dots, respectively. The criteria used for significance were FDR < 0.05 and a greater than 2-fold increase or decrease. Yellow circles denote the very few mRNAs whose uRPF read number decreases by more than 50% of the increases in their mRPF reads, indicating a clear reciprocal relationship between the decrease in uRPFs and the increase in mRPFs. (D) Box plot analysis of mRPF and uRPF read numbers for the 257 mRNAs that had both uRPFs and mRPFs ⩾ 2 reads averaged over all assays conducted at 0, 100 and 500 nM Ded1 concentrations. Unlogged median RPF numbers are labeled under each box.
Figure 7.
Figure 7.. eIF4A enhances the recruitment of almost all mRNAs
(A) Scatterplots of normalized read densities mapped to main AUGs (mRPFs) with 5000 nM versus 500 nM eIF4A for the 2809 mRNAs with ⩾ 8 total reads in 4 samples (2 replicates each for 5000 and 500 nM eIF4A). Red and blue dots show mRNAs with mRPFs significantly increased or decreased, respectively, at 5000 versus 500 nM eIF4A. The criteria for significance were FDR < 0.05 and a > 2-fold change in RPFs. (B) Boxplot comparing ΔRE5000/500 nM eIF4A (grey) to ΔRE100/0 nM Ded1 and ΔRE500/0 nM Ded1 (cyan) for the 2698 mRNAs that passed the cutoff mentioned in (A) in both experiments. (C) Boxplot of ΔRE5000/500 nM eIF4A for the 2538 of all 2809 mRNAs in (A) that have annotated 5’UTRs, divided into six equal sized bins according to 5’UTR lengths from the shortest to the longest. (D) Similar to (C), but for the 1708 of all 2809 mRNAs in (A) with annotated PARS scores, binned by Max30 PARS from lowest to highest. (E-G) Line plots of mean log2 RE changes, ΔRE5000/500 nM eIF4A (green), ΔRE100/0 nM Ded1 (magenta), and ΔRE500/0 nM Ded1 (blue), for mRNAs divided into six equal sized bins according to the specific mRNA features of 5’UTR length (E), Max30 PARS score (F), or Total PARS score (G). (H-K) RPFs assembled with 500 or 5000 nM eIF4A and input mRNA reads for mRNAs shown previously to be hypo-dependent on Ded1 (RPC10, RPL41A, HOR7) or hyper-dependent on Ded1(PMA1) by in vivo ribosome profiling experiments in the ded1-cs mutant.

Similar articles

References

    1. Acker MG, Kolitz SE, Mitchell SF, Nanda JS, Lorsch JR. 2007. Reconstitution of yeast translation initiation. Methods Enzymol 430: 111–145. - PubMed
    1. Archer SK, Shirokikh NE, Beilharz TH, Preiss T. 2016. Dynamics of ribosome scanning and recycling revealed by translation complex profiling. Nature 535: 570–574. - PubMed
    1. Arribere JA, Gilbert WV. 2013. Roles for transcript leaders in translation and mRNA decay revealed by transcript leader sequencing. Genome Res 23: 977–987. - PMC - PubMed
    1. Beckham C, Hilliker A, Cziko AM, Noueiry A, Ramaswami M, Parker R. 2008. The DEAD-box RNA helicase Ded1p affects and accumulates in Saccharomyces cerevisiae P-bodies. Mol Biol Cell 19: 984–993. - PMC - PubMed
    1. Berthelot K, Muldoon M, Rajkowitsch L, Hughes J, McCarthy JE. 2004. Dynamics and processivity of 40S ribosome scanning on mRNA in yeast. Mol Microbiol 51: 987–1001. - PubMed

Publication types