[Preprint]. 2024 Sep 17:2023.11.07.565069.
doi: 10.1101/2023.11.07.565069.

Divergent reward cue representations in prefrontal cortex underlie differences in reward motivation between adolescents and adults

Affiliations

Divergent reward cue representations in prefrontal cortex underlie differences in reward motivation between adolescents and adults

Gabriela Manzano Nieves et al. bioRxiv. .

Abstract

A prevailing view on postnatal brain development is that brain regions gradually acquire adult functions as they mature. The medial prefrontal cortex (mPFC) regulates reward learning, motivation, and behavioral inhibition, and undergoes a protracted postnatal maturation. During adolescence, reward-seeking behavior is heightened compared to adulthood - a developmental difference that may be driven by a hypoactive mPFC, with decreased top-down control of impulsive reward-seeking. However, this hypothesis has been difficult to test directly, due in part to technical challenges of recording neuronal activity in vivo across this developmental period. Here, using a novel 2-photon imaging-compatible platform for recording mPFC activity during an operant reward conditioning task beginning early in life, we show that the adolescent mPFC is hyper-responsive to reward cues. Distinct populations of mPFC neurons encode reward-predictive cues across development, but representations of no-reward cues and unrewarded outcomes are relatively muted in adolescence. Chemogenetic inhibition of GABAergic neurons decreased motivation in adolescence but not in adulthood. Together, our findings indicate that reward-related activity in the adolescent mPFC does not gradually increase across development. On the contrary, adolescent mPFC neurons are hyper-responsive to reward-related stimuli and encode reward-predictive cues and outcomes through qualitatively different mechanisms relative to the adult mPFC, opening avenues to developing distinct, developmentally informed strategies for modulating reward-seeking behavior in adolescence and adulthood.

Keywords: 2-Photon Calcium Imaging; Adolescence; Chemogenetics; Development; Medial prefrontal cortex; Motivation; Neuronal Decoding; Reward Learning.


Figures

Extended Data Figure 1:
Extended Data Figure 1:. Adolescents have increased licking during Hit outcomes compared to False Alarm outcomes.
Graph of lick rates to tones that resulted in a Hit or a False Alarm. A repeated measures two-way ANOVA revealed that adolescent mice had significant differences in the lick rate between trial outcomes (F1,12 = 106.4, p < 0.0001), and across days (F3.27, 39.34 = 2.90, p = 0.042), with a significant day by outcome type interaction (F3.076, 36.91 = 6.46, p = 0.0012). Šídák’s multiple comparison analysis comparing lick rates for each day found all days to be significantly different (p < 0.05). n=13 mice, the same mice are shown for Hit and False Alarm.
Extended Data Figure 2:
Extended Data Figure 2:. Adolescent neurons have increased activity during Hit outcomes.
Analysis of the mean tone activity for adult and adolescent glutamatergic and GABAergic neurons. A three-way ANOVA for age, outcome, and cell type, revealed that age was a main source of variation (F1,9792 = 6.88, p = 0.0087). Significant main interaction of age by outcome (F 3, 9792 = 16.14, p < 0.0001), age by cell type (F1, 9792 = 4.54, p = 0.033), and outcome by cell type (F3, 9792 = 3.63, p = 0.012) were also observed. A main effect of outcome was also observed (F3, 9792 = 16.62, p < 0.0001), indicating that neurons displayed differences in tone responses for the differing trial types. Follow-up two-way ANOVAs were conducted for each of the two neuronal subtypes (glutamatergic and GABAergic). In glutamatergic neurons, we found a main effect of outcome (F3, 8563 = 11.11, p < 0.0001) and an interaction between outcome and age (F3, 8563 = 21.48, p < 0.0001). Glutamatergic mean tone activity was significantly different between adolescent and adult mice during Hit (p < 0.0001) and correct rejection trials (p = 0.0009). For GABAergic neurons, a main effect of age (F 1, 1229 = 5.77; p = 0.016), outcome (F3, 1229 = 8.80; p < 0.0001), and interaction of age by outcome (F3, 1229 = 6.21; p = 0.0003) were detected. Mean tone activity during Hit trials were significantly different between adolescent and adult GABAergic neurons (p < 0.0001).
Extended Data Figure 3:
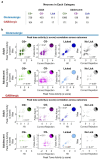
Extended Data Figure 3:. Stability of individual neurons across outcomes.
a) Table showing the number of adult (left) and adolescent (right) neurons significant for each GLM predictor (CS+, CS−, Lick). Neurons significant for more than one predictor are represented more than once. b) Pairwise correlations of neuronal activity by trial outcome for each CS (CS+ and CS−), and behavior (Licked or No Lick). Each point represents the peak tone response magnitude (positive or negative) of a glutamatergic (top) or GABAergic (bottom) neuron in a given trial type. Only task-relevant neurons (GLM significant) are plotted. The linear coefficient of correlation (r) is presented on each graph, with * indicating a significant correlation (p < 0.05). Pie chart insets display the percent of neurons that showed a sign reversal in their peak response magnitude (black wedges), indicating a transition from inhibition (negative values) to excitation (positive values), or vice versa. The colored wedges represent the percent of neurons whose activity remained in the same direction (remained inhibited or remained excited) for both outcomes. Neurons exhibited sign reversal in their peak response magnitude (pie graph insets) in adult glutamatergic during CS+ (25.4%), CS− (13.1%), and No Lick (32.9%) trials and in adolescent glutamatergic neurons during CS+ (32.7%), CS− (30.3%) and No Lick (28.7%) trials. GABAergic neurons exhibited sign reversal in adults during CS+ (24.2%), CS− (12.9%), and No Lick (35.9%) trials and in adolescents during CS+ (42.8%), CS− (36.7%) and No Lick (30.9%) trials. No neuron exhibited sign reversal during Licked trials.
Extended Data Figure 4:
Extended Data Figure 4:. Neural decoding ability and within age comparisons.
a) Graphs of the decoding accuracy for CS identity (top) and Rewarded trials (bottom), for adult (left) and adolescent (right) neuronal subsets compared to decoding accuracy of the same subsets trained on shuffled labels. Significance was tested using Šídák’s multiple comparison test. * p < 0.05, ** p < 0.01 *** p < 0.001. b) Decoding accuracy of CS identity (left) and Rewarded trials (Right) by distinct neuronal subpopulations. A Tukey multiple comparison analysis was used to determine which subsets performed significantly better or worse than the subset that contained all neurons (labeled All Neurons in the graph), and to determine significant differences in accuracy between adolescent and adult neuronal subsets (significance shown in figure legends). Individual values represent one decoding test. Individual runs and mean ± SEM for the decoder is shown. * p < 0.05, ** p < 0.01, *** p < 0.001
Extended Data Figure 5:
Extended Data Figure 5:. Adult CS− encoding neurons can distinguish between outcomes.
a) Table containing the number of neurons in each category. b) Analysis of the mean tone activity for adult glutamatergic neuronal subpopulations across outcomes. A two-way ANOVA found a main effect of outcome (F3, 5006 = 4.51, p = 0.0036), subpopulation (F5, 5006 = 313.9, p < 0.0001) and an interaction between outcome and subpopulation (F15, 5006 = 29.37, p < 0.0001). A Tukey multiple comparison analysis was used to measure simple effects of mean tone response for each neuronal subpopulation across outcomes. For each comparison * p < 0.05, ** p < 0.01, *** p < 0.001. CR = Correct Rejection, FA = False Alarm. c) Analysis of the mean tone activity for adolescent glutamatergic neuronal subpopulations across outcomes. A two-way ANOVA found a main effect of subpopulation (F5, 4247 = 106.4, p < 0.0001) and an interaction between outcome and subpopulation (F15, 4247 = 51.33, p < 0.0001), but not outcome (F3, 4247 = 1.81, p = 0.14). A Tukey multiple comparison analysis was used to measure simple effects of mean tone response for each neuronal subpopulation across outcomes. For each comparison * p < 0.05, ** p < 0.01, *** p < 0.001. CR = Correct Rejection, FA = False Alarm.
Extended Data Figure 6:
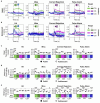
Extended Data Figure 6:. Neuronal subpopulations activity changes across outcomes.
a) Plot of mean activity for adult neuronal subpopulations significant for each of the 3 predictors (CS+: green; CS−: magenta; and Lick: blue) during each outcome. Graphs show mean ± SEM (shaded area). b) Plot of mean activity for adolescent neuronal subpopulations significant for each of the 3 predictors (CS+: green; CS−: magenta; and Lick: blue) during each outcome. Graphs show mean ± SEM (shaded area). c) Comparison of mean tone activity of adult and adolescent neuronal subpopulations. Separate two-way ANOVA and Šídák test were run for each outcome. Two-way ANOVA was used to analyze each outcome for a main effect of age, neuronal subset, and interaction between age and neuronal subset. A main effect of age was only found for Hit (F1, 2575 = 5.694, p = 0.017). While a main effect of neuronal subset (Hit: F5, 2575 = 266.9, p < 0.0001; Miss: F5, 1528 = 57.54, p < 0.0001; Correct Rejection: F5, 2575 = 57.70, p < 0.0001; False Alarm: F5, 2575 = 102.1, p < 0.0001), and interaction between neuronal subset by age (Hit: F5, 2575 = 5.814, p < 0.0001; Miss: F5, 1528 = 8.791, p < 0.0001; Correct Rejection: F5, 2575 = 9.103, p < 0.0001; False Alarm: F5, 2575 = 2.893, p = 0.013) was found for all four outcomes. A Šídák’s multiple comparisons was used to determine simple effects of age, significance is shown on the graph. Mean ± SEM are shown. For each comparison * p < 0.05, ** p < 0.01, *** p < 0.001. d) Comparison of maximum tone activity of adult and adolescent neuronal subpopulations. Separate two-way ANOVA and Šídák test were run for each outcome. Two-way ANOVA was used to analyze each outcome for a main effect of age, neuronal subset, and interaction between age and neuronal subset. A significant main effect of age (Hit: F1, 2575 = 7.09, p = 0.0078; Miss: F1, 1528 = 28.06, p < 0.0001; Correct Rejection: F1, 2575 = 217.1, p < 0.0001; False Alarm: F 1, 2575 = 37.40, p < 0.0001), neuronal subset (Hit: F5, 2575 = 172.2, p < 0.0001; Miss: F5, 1528 = 34.48, p < 0.0001; Correct Rejection: F5, 2575 = 22.41, p < 0.0001; False Alarm: F5, 2575 = 54.42, p < 0.0001), and interaction of neuronal subset by age (Hit: F5, 2575 = 4.46, p < 0.0005; Miss: F5, 1528 = 6.65, p < 0.0001; Correct Rejection: F5, 2575 = 2.39, p = 0.035; False Alarm: F5, 2575 = 5.15, p = 0.0001) was found in all four outcomes. A Šídák’s multiple comparisons was used to determine simple effects of age, significance is shown on the graph. Mean ± SEM are shown. For each simple comparison * p < 0.05, ** p < 0.01, *** p < 0.001. e) Comparison of maximum tone activity of adult and adolescent neuronal subpopulations. Separate two-way ANOVA and Šídák test were run for each outcome. Two-way ANOVA was used to analyze each outcome for a main effect of age, neuronal subset, and interaction between age and neuronal subset. A main effect of age was found for Miss (F1, 1528 = 49.97, p < 0.0001), Correct Rejection (F1, 2575 = 374.6, p < 0.0001), and False Alarm (F1, 2575 = 128.1, p < 0.0001) outcomes. A main effect of neuronal subset was found for each outcome (Hit: F5, 2575 = 295.7, p < 0.0001; Miss: F5, 1528 = 25.93, p < 0.0001; Correct Rejection: F5, 2575 = 15.18, p < 0.0001; False Alarm: F5, 2575 = 41.46, p < 0.0001). An interaction between neuronal subsets by age was observed for Miss (F5, 1528 = 2.44, p = 0.032) and Correct Rejection (F5, 2575 = 2.55, p = 0.025) outcomes. A Šídák’s multiple comparisons were used to determine simple effects of age, significance is shown on the graph. Mean ± SEM are shown. For each simple comparison * p < 0.05, ** p < 0.01, *** p < 0.001.
Extended Data Figure 7:
Extended Data Figure 7:. mPFC GABAergic neuron changes lick motivation in adolescents, but not adults.
a) Inhibition (red) and excitation (blue) of glutamatergic mPFC neurons in adult (top) and adolescent mice. A Tukey’s multiple comparison analysis was run per graph. n = 8–14 mice per condition per age. # p <0.10, * p < 0.05, ** p < 0.01, *** p < 0.001 b) Inhibition (red) and excitation (blue) of GABAergic mPFC neurons in adult (top) and adolescent mice. A Tukey’s multiple comparison analysis was run per graph. n = 5–19 mice per condition per age. # p <0.10, * p < 0.05, ** p < 0.01, *** p < 0.001. For 3-way ANOVA analysis of age by treatment by day effects see Extended Data Table. 1
Figure 1:
Figure 1:. Adolescent mice have increased reward motivation.
a) Experimental timeline. b) Schematic of CS+ only training sessions. c) Schematic of CS+/CS− training session. d) Rasterized lick times for an adult (top row) and adolescent (bottom row) mouse during early (day 1) and late (day 12) CS+/CS− training sessions. Plots are aligned to tone onset (at 0 s). If rewarded, a sucrose droplet is delivered at tone offset (at 5 s). CS+ trials are green, CS− trials are magenta. Every 4th trial (25 trials) is shown for ease of visualization. e) Graphs of % acquired CS+ trials (top) and CS+ lick rates during Hit trials (bottom). Adolescent mice have significantly higher % trials (F1,26 = 21.70, p < 0.0001), and tone lick rate during Hit trials (F1,26 = 15.27, p = 0.0006) compared to adults. Mice generally increase tone lick rates across training days (F3.8,99.7 = 12.11, p < 0.0001). Data is shown as mean ± SEM. A two-way repeated measures ANOVA was used for the main effects. * indicates p < 0.05 on Šídák’s multiple comparison post hoc test. n = 10–15 mice per age group. f) Graphs of % acquired CS− trials (top) and CS− lick rates in False Alarm trials (bottom). Adolescent mice obtained significantly higher False Alarm trials (CS− trials where they lick) (F1,26 = 7.16, p = 0.012), but not False Alarm lick rates (F1,26 = 0.49, p = 0.48), compared to adults. Mice generally decreased % False Alarm trials acquired across training days (F4.6,121.5 = 9.59, p < 0.0001). A significant interaction of age by training day was observed (F11,284 = 2.15, p = 0.016) for False Alarm tone licks. Data is shown as mean ± SEM. Main effects were determined with a two-way repeated measures ANOVA (top), or mixed-effects model analysis (bottom). * indicates p < 0.05 on Šídák’s multiple comparison post hoc test. n = 10–15 mice per age group.
Figure 2:
Figure 2:. Adolescent mPFC overrepresents reward cues and exhibits increased reward cue activity.
a) Illustration of a mouse during 2P imaging and histological image of prism implant in mPFC. b) Representative images of glutamatergic (green only) and GABAergic (co-labeled green and red) neurons during 2P imaging. Images were captured using Galvano imaging and processed using a max intensity projection. Neurons were recorded from 5 adult and 4 adolescent mice. c) Experimental timeline of behavioral training. 2P imaging data was extracted from day 7 of CS+/CS− training. d) Schematic of generalized linear model (GLM) used to classify neurons. 3 predictors were used: CS+, CS−, and Lick. Pre-tone and Tone activity (−5 to 5 seconds) was used in the GLM. e) Plot of individual values and mean percent of task-relevant neurons in adult and adolescent mice (top) (t.test: t 7 = 2.34, p = 0.051), and pie charts of pooled neurons from all task-relevant (colored) and non-task-relevant (white) neurons (Chi2: χ2(1) = 159.5, p < 0.0001). f) Heatmap of neuronal activity of task predictive glutamatergic neurons. Neurons are sorted from greatest to least mean tone activity (0 to 5 seconds). Neuronal activity of adults (top), adolescents (middle), and the average neuronal trace (bottom; average of heatmaps) are presented. g) Heatmap of neuronal activity of task predictive GABAergic neurons, displayed as in Fig. 2g. h) Plot of glutamatergic neuron’s mean tone activity (0 to 5 seconds) for each outcome in adults (top) and adolescents (bottom). A main effect of outcome was found in adults (F3, 4594 = 11.81, p < 0.0001), and adolescents (F3, 3969 = 19.84, p < 0.0001). One-way ANOVA followed by Tukey’s multiple comparison analysis. Data is shown as mean ± SEM. * p < 0.05, ** p < 0.01, *** p < 0.001 i) Plot of GABAergic neurons mean tone activity (0 to 5 seconds) for each outcome for adults (top) and adolescents (bottom). A main effect of outcome was found in adolescents (bottom; F3, 668 = 12.69, p < 0.0001), but not adults. One-way ANOVA followed by Tukey’s multiple comparison analysis. Data is shown as mean ± SEM. * p < 0.05, ** p < 0.01, *** p < 0.001 j) Venn diagram of glutamatergic mPFC neurons significant for GLM predictors (CS+, CS− and/or Lick), comparing adult (top), and adolescent (bottom) neurons (Chi2: χ2(2) = 232.2, p < 0.0001). The percent of neurons are shown. For n of neurons see Extended Data Fig. 3. k) Venn diagram of GABAergic mPFC neurons significant for GLM predictors (CS+, CS− and/or Lick), comparing adult (top), and adolescent (bottom) neurons (Chi2: χ2(2) = 19.47, p < 0.0001). The percent of neurons are shown. For n of neurons see Extended Data Fig. 3.
Figure 3:
Figure 3:. Adolescent mPFC has more cue and reward predictive information than the adult mPFC.
a) Schematic of Support Vector Machine (SVM) decoding of neuronal subpopulations (left). SVMs were run on matrices containing glutamatergic and GABAergic neurons. The 5 seconds of tone activity was used for decoding. 20 train/test sessions were run for each subpopulation. For each run, the 120 CS trials were randomly shuffled, with the time series remaining intact. For comparison against shuffled data, within age effects, and full statistics see Extended Data Fig. 4. b) Test of the sufficiency of neuronal subsets to decode Rewarded trials (Hit versus Miss, Correct Rejection, and False Alarm). X-axis labels indicate neuronal subsets included in the SVM decoder model. Individual trials and mean ± SEM for the decoder is shown. A Tukey multiple comparison analysis was used. * p < 0.05, ** p < 0.01, *** p < 0.001. c) Test of the sufficiency of neuronal subsets to decode CS identity (CS+ versus CS− trials). X-axis labels indicate neuronal subsets included in the SVM decoder model. Individual trials and mean ± SEM for the decoder is shown. A Tukey multiple comparison analysis was used. * p < 0.05, ** p < 0.01, *** p < 0.001. d) Test of the necessity of neuronal subsets to decode Rewarded trials (Hit versus Miss, Correct Rejection, and False Alarm). Individual trials and mean ± SEM for the decoder is shown. A Tukey multiple comparison analysis was used. * p < 0.05, ** p < 0.01, *** p < 0.001. e) Test of the necessity of neuronal subsets to decode CS identity (CS+ versus CS− trials). Individual trials and mean ± SEM for the decoder is shown. A Tukey multiple comparison analysis was used. * p < 0.05, ** p < 0.01, *** p < 0.001.
Figure 4:
Figure 4:. Neuronal subpopulation activity changes across outcomes.
a) Mean activity for every subpopulation of adult neurons during each outcome. For each predictor, two lines are shown: a negative beta weight predictor (darker line) and a positive predictor (lighter line). Graphs show mean ± SEM (shaded area). b) Mean activity for every subpopulation of adolescent neurons during each outcome. For each predictor, two lines are shown: a negative beta weight predictor (darker line) and a positive predictor (lighter line). Graphs show mean ± SEM (shaded area). c) Within-age analysis of subpopulations of neurons in the adult (top) and adolescent (bottom) mPFC. For analysis, a two-way ANOVA followed by a Tukey multiple comparison test was used to determine if the mean tone activity of each subpopulation significantly changed across outcomes (Hit, Miss, Correct Rejection, False Alarm). The heatmap shows the significant (p < 0.05) and non-significant Tukey post-hoc comparisons. See Extended Data Fig. 5 for full statistical analysis. d) Heatmap of significant comparisons between the adult and adolescent mean (left), maximum (middle), and minimum (right) tone activity for each neuronal subpopulation. A separate two-way ANOVA, containing tone data for all 6 neuronal subpopulations, was run for each of the four outcomes. The heatmap shows the significant (p < 0.05) and non-significant Šídák post-hoc comparisons of each subpopulation. See Extended Data Fig. 6 for full statistical analysis.
Figure 5:
Figure 5:. Adolescent mPFC has an expanded role in reward-seeking.
a) Illustration of viral injections and CNO administration in mice. b) Experimental timeline. All mice are injected with saline solution on days 4 and 5, CNO on days 6 and 7, and saline on day 8. The equation used to measure the change is displayed below. c) Pictures of DREADD viral expression in glutamatergic (left) and GABAergic (right) neurons. d) Inhibition (red) and excitation (blue) of glutamatergic mPFC neurons in adult (top) and adolescent mice. A Tukey’s multiple comparison analysis was run per graph. n = 8–14 mice per condition per age. # p <0.10, * p < 0.05, ** p < 0.01, *** p < 0.001 e) Inhibition (red) and excitation (blue) of GABAergic mPFC neurons in adult (top) and adolescent mice. A Tukey’s multiple comparison analysis was run per graph. n = 5–19 mice per condition per age. # p <0.10, * p < 0.05, ** p < 0.01, *** p < 0.001. For 3-way ANOVA analysis of age by treatment by day effects see Extended Data Table. 1
Figure 6:
Figure 6:. Proposed model for mPFC-driven increased adolescent reward motivation
a) Adolescent mice have an overrepresentation of CS+ encoding neurons, and an underrepresentation of CS− encoding neurons within the mPFC. This leads to increased reward-motivated behavior in adolescence, indexed by increased licking. b) In adults, the CS− encoding population is smaller than the CS+ encoding population, but much larger than the CS− encoding population in adolescents. This balance between CS+ and CS− encoding neurons allows the adult to better control when they will lick, decreasing overall lick rates and allowing them to withhold licks to non-rewarding cues.

References

    1. Hammerslag L. R. & Gulley J. M. Age and sex differences in reward behavior in adolescent and adult rats. Dev. Psychobiol. 56, 611–621 (2014). - PMC - PubMed
    1. Marshall A. T., Liu A. T., Murphy N. P., Maidment N. T. & Ostlund S. B. Sex-specific enhancement of palatability-driven feeding in adolescent rats. PLoS One 12, e0180907 (2017). - PMC - PubMed
    1. Friemel C. M., Spanagel R. & Schneider M. Reward sensitivity for a palatable food reward peaks during pubertal developmental in rats. Front. Behav. Neurosci. 4, (2010). - PMC - PubMed
    1. Whelan R. et al. Adolescent impulsivity phenotypes characterized by distinct brain networks. Nat. Neurosci. 15, 920–925 (2012). - PubMed
    1. Romer D. Adolescent risk taking, impulsivity, and brain development: implications for prevention. Dev. Psychobiol. 52, 263–276 (2010). - PMC - PubMed

Publication types