[Preprint]. 2023 Nov 11:2023.11.07.566063.
doi: 10.1101/2023.11.07.566063.

2D and 3D multiplexed subcellular profiling of nuclear instability in human cancer

Affiliations

2D and 3D multiplexed subcellular profiling of nuclear instability in human cancer

Shannon Coy et al. bioRxiv. .

Abstract

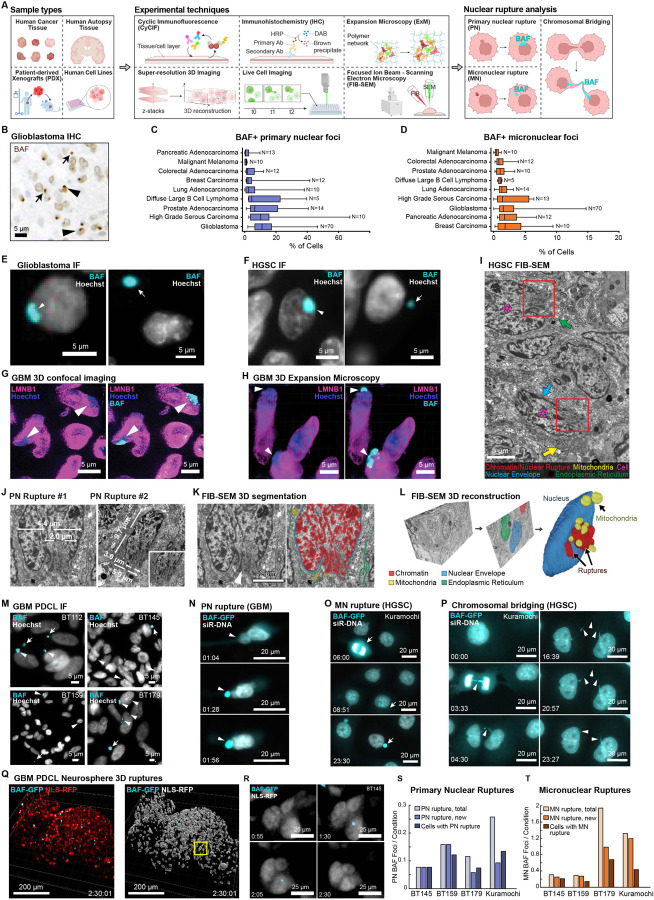
Nuclear atypia, including altered nuclear size, contour, and chromatin organization, is ubiquitous in cancer cells. Atypical primary nuclei and micronuclei can rupture during interphase; however, the frequency, causes, and consequences of nuclear rupture are unknown in most cancers. We demonstrate that nuclear envelope rupture is surprisingly common in many human cancers, particularly glioblastoma. Using highly-multiplexed 2D and super-resolution 3D-imaging of glioblastoma tissues and patient-derived xenografts and cells, we link primary nuclear rupture with reduced lamin A/C and micronuclear rupture with reduced lamin B1. Moreover, ruptured glioblastoma cells activate cGAS-STING-signaling involved in innate immunity. We observe that local patterning of cell states influences tumor spatial organization and is linked to both lamin expression and rupture frequency, with neural-progenitor-cell-like states exhibiting the lowest lamin A/C levels and greatest susceptibility to primary nuclear rupture. Our study reveals that nuclear instability is a core feature of cancer, and links nuclear integrity, cell state, and immune signaling.


Conflict of interest statement

Declaration of Interests PKS is a co-founder and member of the BOD of Glencoe Software, member of the BOD for Applied Biomath, and member of the SAB for RareCyte, NanoString, and Montai Health; he holds equity in Glencoe, Applied Biomath, and RareCyte. PKS consults for Merck and the Sorger Laboratory has received research funding from Novartis and Merck in the past five years. The DFCI receives funding for KLL’s research from the following entities: BMS, Lilly. KLL is co-founder of Travera Inc. KLL receives consulting fees from BMS, Travera, Integragen, Blaze Biosciences and BMS. DFCI and KLL have patents related to molecular diagnostics of cancer. D.P. is a member of the Volastra Therapeutics scientific advisory board. The other authors declare no outside interests.

Figures

Figure 1:
Figure 1:. Primary and micronuclear ruptures are common in human cancer
A, Schematic of sample types, experimental methods, and features analyzed in this study (generated with BioRender). B, Representative BAF immunohistochemistry of human GBM tissue (arrowheads, PN ruptures; arrows, MN ruptures). C,D, Quantification of nuclear rupture across multiple cancer types (n=156) showing frequency of PN (C) and MN (D) rupture (boxes 1st - 3rd quartile, bars 1.5xIQR). E,F, Immunofluorescence images of BAF-positive PN ruptures (left panels) and MN ruptures (right panels) in (E) GBM and (F) high-grade serous ovarian carcinoma (HGSC). G,H, 3D confocal (G) and 3D expansion immunofluorescence (H) showing lamin B1 defects and chromatin herniation indicative of PN rupture at BAF foci in GBM tissue. I, Focused ion beam scanning electron microscopy (FIB-SEM) image of human HGSC tissue, showing two atypical tumor cells with NE ruptures (boxes). J, Ultrastructural measurement of PN ruptures from two tumor cells. K, Representative segmentation of FIB-SEM images. L, 3D reconstruction of the FIB-SEM dataset showing nucleus, mitochondria, and herniated chromatin from two PN ruptures interdigitating between mitochondria. M, BAF immunofluorescence in unaltered GBM PDCLs showing spontaneous rupture events (arrows, MN rupture; arrowheads, PN rupture). N-P, Time lapse microscopy of BAF-eGFP transgenic PDCL labeled with siR-DNA. (N) PN rupture associated with nuclear deformation in GBM PDCL (BT145). O,P, MN formation and rupture (O) and chromosomal bridging (P) in Kuramochi ovarian cancer cells following mitotic chromosomal mis-segregation. Q, 3D reconstruction and surface rendering of a BAF-eGFP / NLS-RFP transgenic GBM PDCL neurosphere. R, Time-lapse imaging of a de novo PN rupture event in 3D neurosphere culture, showing formation and resolution of a PN BAF focus. S,T, Quantification of existing, new, and total ruptures in 2D adherent culture of BAF-eGFP cell lines, for PN (S) and MN (T). Times shown in hh:mm.
Figure 2:
Figure 2:. Multiplexed subcellular imaging of cell line models reveals primary and micronuclear rupture are associated with distinctive protein expression patterns
A, Experimental overview. Human RPE cells were treated with LMNB1 siRNA, MPS1i, or X-ray radiation (2Gy), to induce PN or MN rupture then analyzed using plate-based CyCIF. B, Representative images of each treatment group (arrows, MN rupture; arrowheads, PN rupture). C, Quantification of BAF-positive PN and MN ruptures following treatment (mean % of cells +/− S.D) (*p<0.05) (t-test, two-sided, unpaired). D, p-CyCIF images of a ruptured, BAF-positive PN bleb in cells treated with LMNB1 siRNA, showing localized disorganization and accumulation of lamin A/C and emerin, reduced levels of lamin B1/B2 and NUP133, and absence of pH2AX, LBR, and STING. E, Percentage of BAF-negative or BAF-positive PN blebs in LMNB1-kd cells expressing each intensity of a given marker, based on semi-quantitative visual scoring (t-test, two-sided, unpaired). F, p-CyCIF images of a ruptured, BAF-positive micronucleus a cell treated with MPS1 inhibitor, exhibiting low lamin A/C, lamin B1/B2, and NUP133, and accumulation of emerin, LBR, pH2AX, cGAS, and STING. G, Percentage of BAF-negative or BAF-positive MN expressing each intensity of a given marker in MPS1i-treated cells, based on semi-quantitative visual scoring (t-test, two-sided, unpaired). H, Representative images of XR-treated cells with PN and MN ruptures associated with accumulation of cGAS and/or pH2AX. I, Representative images of XR-treated cells with occasional pH2AX-positive PN blebs. J,K, Percentage of BAF-negative or BAF-positive PN (J) or MN (K) with a given expression level of indicated markers. L, Representative p-CyCIF images of STING in RPE cells per condition (arrowheads, STING foci). M, Quantification STING foci in each experimental condition (*p<0.05, ***p=0.0503) (t-test, two-sided, unpaired).
Figure 3:
Figure 3:. Nuclear envelope rupture is associated with differences in lamin subtype expression in glioblastoma tissues
A, Overview of 28-plex t-CyCIF experiment on a glioma tissue microarray (TMA). B, Selected t-CyCIF images of glioma TMA with cores de-arrayed. Right top: primary IDH-WT GBM tumor with high lamin A/C expression and few PN ruptures. Right bottom: primary IDH-WT GBM tumor with low lamin A/C expression and many PN ruptures. C,D, Examples of segmentation of PN rupture (C) and MN rupture (D). E,F, Probability density plots of lamin A/C, lamin B1, and lamin B2 protein expression in 161,834 PN (E) and 5,974 MN (F) from 82 primary IDH-WT GBM. P values as indicated (t-test, two-sided, unpaired). G,H, Scatter plot of the mean number of BAF foci per cell versus mean nuclear lamin A/C or lamin B1 expression in primary IDH-WT GBM (N=82, duplicate cores). Pearson correlation analysis shows that lamin A/C is inversely correlated with PN BAF focus frequency (rho=−0.28, p=0.02) (G); lamin B1 shows no significant association (rho=0.05, p=0.66) (H). I,J, t-CyCIF images of BAF, pH2AX, cGAS in primary IDH-WT GBM with PN (I) and MN (J) ruptures. K,L, Probability density plots of pH2AX (K) and cGAS (L) signal in segmented BAF+ rupture foci and BAF-negative PN. M,N, Probability density plots of pH2AX (M) and cGAS (N) signal in segmented BAF-positive PN and BAF-negative and -positive MN.
Figure 4:
Figure 4:. Primary nuclear rupture and lamin expression are correlated with GBM tumor cell states
A, scRNA-seq from 28 adult and pediatric GBM (n=24,131 cells) showing lamin RNA expression by GBM cell state. *p<0.05; t-test, two-sided, unpaired. B, Plots of scRNA-seq data showing putative markers of each cell state in GBM (*p<1x10⁻¹⁶) (t-test, two-sided, unpaired). C, Schematic of t-CyCIF experiment and markers to explore rupture and lineage correlations (generated with BioRender). D, Representative GBM t-CyCIF images showing cell state marker expression in distinct tumor cell populations, with reduced lamin A/C expression and increased PN rupture in NPC-like cells (DCX, ELAVL4) (white arrowheads) compared with NDRG1-expressing MES-like cells (white arrows) and HOPX-expressing AC-like cells (red arrowheads). TMA core image with ROI indicated (upper left). E, Two-dimensional representation of GBM cell states from t-CyCIF. Each quadrant represents a cell state (based on Neftel et al.), with position reflecting the relative score and indicated cell state scores for each cell and intensity values for the indicated markers. F, Composite representation of cell state groups in scRNA-seq data for validated markers. G, Plot of scores for each cell state mapped to individual tumor cells, showing an excellent correspondence of cell state designations at a single-cell level in t-CyCIF data. H, Correlation of manual gating of marker intensity and designation of cells according to core cell state markers and mapping of continuous cell state data. I, mapping of lamin A/C levels by cell state score shows that NPC-like cells exhibit the lowest lamin A/C expression. J, Quantification of PN rupture rate in t-CyCIF TMA data normalized to cell count. K, Quantification of mean nuclear Ki-67 expression in different cell states shows significantly higher proliferation rates in NPC-like cells compared to other populations (p<1x10−50 for all comparisons). L,M, Quantification of cell state markers in 82 primary IDH-WT GBM comparing cells with ruptured and unruptured PN (L) and MN (M), showing enrichment of NPC cell state markers and EGFR in ruptured cells compared to the mean of all markers (**p<0.01) (t-test, two-sided, unpaired). N, two-dimensional mapping of EGFR expression by cell state shows that while AC-like cells exhibit the strongest overall expression, a secondary cluster of NPC-like cells also exhibits EGFR expression.
Figure 5:
Figure 5:. Multiplexed 3D confocal imaging of nuclear instability and cell state in glioblastoma
A, Schematic of experimental plan for 3D confocal CyCIF, with indicated markers (generated in BioRender). B, High-resolution confocal imaging of GBM tissues reveals nuclear morphology and abundant PN and MN rupture events. C, 3D confocal CyCIF confirms that PN ruptures are correlated with reduced expression of lamin A/C, but not lamin B1. D, 3D confocal CyCIF of primary IDH-WT GBM showing highly heterogeneous expression of cell state markers E, Examination of cell state markers and BAF confirms enrichment of PN BAF foci in NPC-like cells (DCX+, ELAVL4+), compared to other cell state populations. F, NPC-like cells exhibit low expression of lamin A/C and high rates of BAF-positive PN rupture. G, 3D confocal CyCIF shows colocalization of BAF, pH2AX, and cGAS in a ruptured MN H, 3D confocal CyCIF enables visualization and characterization of complex nuclear structures including chromosomal bridges. I, 3D reconstruction and mapping of chromosomal bridges reveals their complex architecture, including hairpin turns, and focal ruptures with BAF, pH2AX, and cGAS accumulation.
Figure 6:
Figure 6:. Multiplex imaging of whole-slide tissue specimens reveals the spatial organization of GBM tumor cell states
A, Schematic of sample types and design of GBM cell state analysis. B, Human GBM autopsy tissue with tumor, necrotic areas, and tumor-brain invasive margin indicated. t-CyCIF images showing representative cell state markers. C, Representative t-CyCIF images of human IDH-WT GBM autopsy cell state regions. NPC-like regions exhibit low lamin A/C and higher rates of PN rupture than other cell state regions (arrows, BAF-positive PN ruptures). D, Two-dimensional representation of all cells from a human autopsy specimen (#1), correlating state-assignment with underlying cell state scores. E, Spatial map of lineage cell state scores across a human autopsy specimen, showing regional differentiation of tumor cells. F, Quantitative analysis of cell state scores from the center of the tumor to edge and adjacent regions, showing gradual reduction of AC-like markers (HOPX) and lamin A/C and a gradual increase of NPC-like markers. G, Analysis of cell state differentiation patterns in RNA-sequencing data from cultured GBM PDCL lines. H, Representative t-CyCIF imaging of patient-derived xenografts (PDX) from 3 PDCL lines: BT112, BT159, and BT179. I, t-CyCIF imaging of BT112 shows reduced lamin A/C expression and increased NE rupture at the periphery of the tumor, corresponding to regions of NPC-like differentiation. J, Representative t-CyCIF images from the invasive margin of BT112 showing a tight cluster of NPC-like tumor cells (DCX+, ELAVL4+, with low lamin A/C and elevated BAF-positive PN ruptures).
Figure 7:
Figure 7:. Primary and micronuclear ruptures are associated with cGAS-STING and interferon signaling
A, Schematic of t-CyCIF imaging to analyze inflammatory and DNA damage states in the glioma TMA. B, Representative CyCIF images of primary IDH-WT GBM showing numerous BAF foci and heterogeneous expression of inflammatory markers in tumor cells. C,D, Representative t-CyCIF images showing a large PN bleb (C) and MN (D) with NE rupture (BAF+) and co-accumulation of TREX1, and pH2AX. E, Representative t-CyCIF images of primary IDH-WT GBM cells showing co-localization of BAF and cGAS at ruptured PN (top row) and MN (bottom row), nuclear translocation of IRF3, NF-kB, and pSTAT3, and expression of IFITM1/2/3 (top row). STING showed substantial background staining (bottom row). F, Probability density analysis of pH2AX, cGAS, and TREX1 signal in PN and MN BAF foci normalized to Hoechst signal, showing significantly greater signal in MN rupture relative to PN ruptures for each marker (p<1x10−40). G,H, Quantification of interferon signaling-related markers in 82 primary IDH-WT GBM comparing cells with ruptured and unruptured PN (G) and the nearest PN associated with ruptured MN (H). p<0.05, **p<0.01; t-test, two-sided, unpaired. I, Schematic of super-resolution 3D CyCIF markers and image processing. J, Overview of 3D super-resolution CyCIF of 20µm FFPE GBM tissue. K,L, Representative 3D surface rendering of primary IDH-WT GBM tumor cells with a BAF-positive ruptured primary nuclear bleb (K) and BAF-positive ruptured micronucleus (L). BAF forms a ‘shell’ around each ruptured structure. M-P, Representative 3D surface rendering of primary IDH-WT GBM tumor cells with PN rupture, showing frequent co-localization of BAF and CHMP4B consistent with ESCRT-III recruitment and repair (M). PN ruptures, indicated by BAF, occur at sites of reduced lamin B1 expression (N). Super-resolution CyCIF shows frequent co-localization of cGAS (O), and Emerin (P) at BAF-positive rupture sites. Q, Representative 3D surface rendering of primary IDH-WT tumor cells with a micronuclear rupture, showing co-localization of CHMP4B, cGAS, and STING. R, Super-resolution CyCIF imaging reveals complex nuclear bridges connecting multiple tumor cell nuclei (arrows; yellow coloration indicates contiguous nuclear structures).

References

    1. Zink D., Fischer A. H. & Nickerson J. A. Nuclear structure in cancer cells. Nat Rev Cancer 4, 677–687 (2004). - PubMed
    1. Fletcher C. D. M. Diagnostic Histopathology of Tumors. (Elsevier, 2013).
    1. Müller J. Ueber den feinern Bau und die Formen der krankhaften Geschwülste. (G. Reimer, 1838).
    1. Kato H. & Sandberg A. A. Chromosome pulverization in human cells with micronuclei. J Natl Cancer Inst 40, 165–179 (1968). - PubMed
    1. Crasta K. et al. DNA breaks and chromosome pulverization from errors in mitosis. Nature 482, 53–58 (2012). - PMC - PubMed

Publication types