[Preprint]. 2023 Nov 10:2023.11.08.566322.
doi: 10.1101/2023.11.08.566322.

Dynamic RNA Polymerase II Recruitment Drives Differentiation of the Intestine under the direction of HNF4

Affiliations

Dynamic RNA Polymerase II Recruitment Drives Differentiation of the Intestine under the direction of HNF4

Kiranmayi Vemuri et al. bioRxiv. .

Update in

Abstract

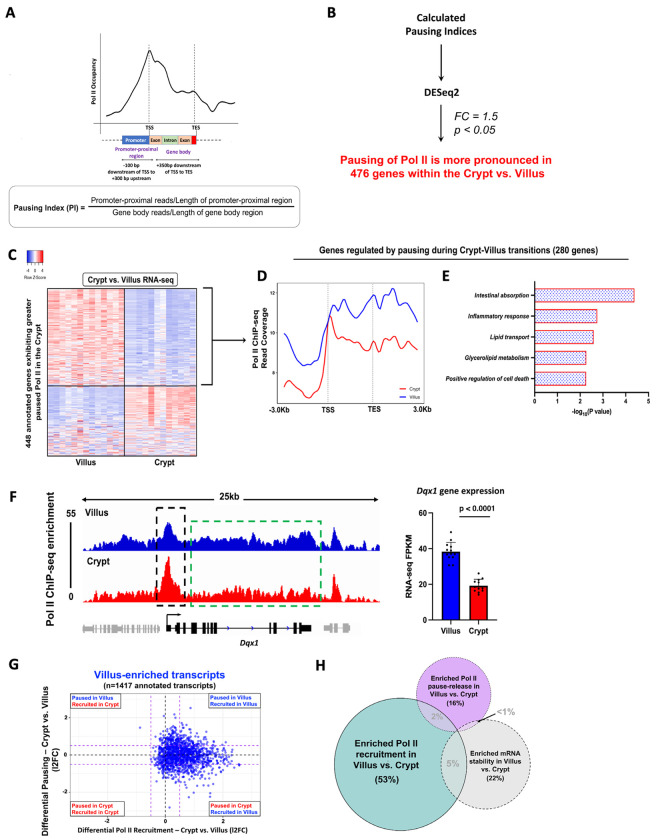
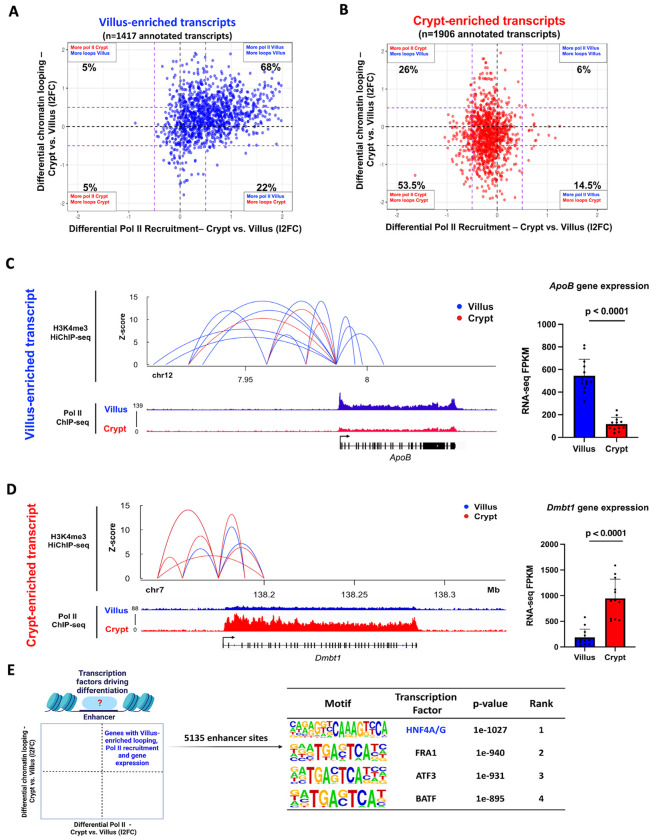
Terminal differentiation requires a massive restructuring of the transcriptome. During intestinal differentiation, the expression patterns of nearly 4000 genes are altered as cells transition from progenitor cells in crypts to differentiated cells in villi. We identified dynamic recruitment of RNA Polymerase II (Pol II) to gene promoters as the primary driver of transcriptomic shifts during intestinal differentiation in vivo. Changes in enhancer-promoter looping interactions accompany dynamic Pol II recruitment and are dependent upon HNF4, a pro-differentiation transcription factor. Using genetic loss-of- function, ChIP-seq and IP mass spectrometry, we demonstrate that HNF4 collaborates with chromatin remodelers and loop-stabilizing proteins and facilitates Pol II recruitment at hundreds of genes pivotal to differentiation. We also explore alternate mechanisms which drive differentiation gene expression and find pause-release of Pol II and post- transcriptional mRNA stability regulate smaller subsets of differentially expressed genes. These studies provide insights into the mechanisms of differentiation in a renewing adult tissue.

Keywords: HNF4 transcription factors; Pol II ChIP; RNA polymerase II; chromatin looping; crypt-villus axis; dynamic Pol II recruitment; intestinal epithelium; post-transcriptional regulation; promoter-proximal pausing; rapid immunoprecipitation mass spectrometry of endogenous proteins.


Conflict of interest statement

DECLARATION OF INTERESTS The authors declare no competing interests.

Figures

Fig.1.
Fig.1.. Dynamic Pol II occupancy correlates with dynamic gene expression during intestinal differentiation.
(A) H&E shows crypt and villus structure from WT mice. Images are representative of 3 biological replicates. Heatmap of villus-enriched and crypt-enriched transcripts reveals dynamic gene expression patterns during differentiation from crypts onto villi (Crypt vs. Villus RNA-seq, n = 13 villi and 12 crypts; DESeq2: l2FC > 1 or < −1, FDR < 0.05, FPKM > 1; GEO: GSE133949). (B) Experimental design for Pol II ChIP sequencing from isolated duodenal crypt and villus cells (n=3 biological replicates) (C) Volcano plot of differential Pol II occupancy between villus and crypt cells (n = 3 biological replicates). Significant Pol II occupancy was called with DESeq2 (l2FC > 0.58 or < −0.58; FDR < 0.05). Genes with significant Pol II enrichment in the villus and crypt were identified as blue and red points, respectively. Points in black represent genes with similar Pol II binding patterns in both cell types. 780 genes in the villus and 392 genes in the crypt exhibit differential Pol II occupancy (See Table S2). (D) Metagene plots show the average signal profiles of Pol II in genes with villus-enriched or crypt-enriched Pol II (differential Pol II; DESeq2, l2FC > 0.58 or < −0.58; FDR < 0.05). (E) Functional annotation (DAVID) of villus-enriched Pol II genes and crypt-enriched Pol II genes. p values were calculated using DAVID (See full table in Table S2). (F) Examples of differential Pol II binding to gene loci as illustrated using merged Pol II ChIP-seq replicate data. Villus tracks are depicted in blue and crypt tracks are depicted in red. Loci are indicated above, data visualized using IGV. Bar plots show FPKM values for each gene in crypt and villus derived from RNA-seq (GEO: GSE133949). FPKM data is presented as mean ± s.e.m. (n = 13 villi and 12 crypts, two-sided Student’s t-test). (G) Quadrant plots comparing Pol II-enriched genes with crypt vs. villus differential expression patterns. The red and blue points indicate crypt- and villus- enriched Pol II gene sets respectively (differential Pol II; DESeq2, l2FC > 0.58 or < −0.58; FDR < 0.05), which display large magnitude fold changes in Pol II occupancy and differential expression (crypt vs. villus RNA-seq, DESeq2 l2FC > 1 or < −1, FDR < 0.05, FPKM > 1; GEO: GSE133949). The dotted purple lines show a fold change cut-off of 1.5.
Fig.2.
Fig.2.. A subset of genes with similar Pol II expression yet differential expression are regulated post-transcriptionally.
(A) Quadrant plots comparing 6429 genes (from Fig. S1) with gene expression from crypt vs. villus RNA-seq (GEO: GSE133949). The red and blue points indicate crypt- and villus- enriched Pol II gene sets respectively (differential Pol II; DESeq2, l2FC >0.58 or < −0.58; FDR < 0.05). Black points indicate genes which have similar Pol II signal (differential Pol II; DESeq2, l2FC < 0.58 or > −0.58). Black points highlighted with red boxes indicate genes with similar Pol II occupancy yet are differentially expressed (crypt vs. villus RNA-seq; DESeq2 l2FC > 1 or < −1, FDR < 0.05, FPKM > 1; GEO: GSE133949). The dotted purple lines show a fold change cut-off of 2. (B) Venn diagram shows there are 700 genes with similar Pol II occupancy and differential expression between crypt and villus cells (See Table S2). (C) Metagene profile shows similarity in Pol II occupancy patterns between crypt and villus in the 700 genes. Confidence bands were generated at 95%. (D) Schematic showing principle behind DiffRAC, a computational framework to assess differential mRNA stability based on differential exonic and intronic read counts. (E) Plot shows 670 genes (genes without introns were excluded) with similar Pol II occupancy yet differential expression are more likely to be regulated by differential mRNA stability than any differences in Pol II, as evidenced by comparison with differential crypt-villus expression (differential mRNA stability: crypt vs. villus RNA-seq, DiffRAC DESeq2, l2FC > 0 or < 0; differential gene expression: crypt vs. villus RNA-seq, DESeq2 l2FC > 1 or < −1, FDR < 0.05, FPKM > 1; GEO: GSE133949) (See Table S3). (F) and (G) Representative examples of genes showing similar Pol II occupancies (genomic tracks) yet significantly different exonic counts (bar plots). Villus-enriched is shown in (F) and crypt-enriched is shown in (G). Loci are indicated above, data visualized using IGV. Villus tracks are depicted in blue and crypt tracks are depicted in red. Bar plots depict FPKM values, exonic counts and intronic counts for each gene in crypt and villus derived from RNA-seq (GEO: GSE133949). The data are presented as mean ± s.e.m. (n = 13 villi and 12 crypts, two-sided Student’s t-test).
Fig.3.
Fig.3.. Pause release of Pol II during crypt-villus transitions is an additional gene regulatory mechanism.
(A) Diagram illustrating the procedure for calculating the Pausing Index (PI) as a measure of promoter-proximal pausing of Pol II. (B) Schematic illustrating the approach used to identify 476 genes demonstrating significantly elevated promoter-proximal pausing of Pol II within the crypt (See Table S2). (C) Heatmap shows expression patterns of 448 annotated genes which exhibit higher Pol II pausing in the crypt vs. villus (Pol II ChIP-seq; differential PI: DESeq2, l2FC < −0.58, p < 0.05, See Table S2). (D) Metagene plot of 280 genes which exhibit greater Pol II pausing in the crypt yet higher expression in the villus, pointing to Pol II pause-release being the major regulatory mechanism. (E) Functional annotation of 280 crypt-paused, villus-expressed genes show functional gene classes which preferentially undergo pause release in the villus vs. the crypt (See full table in Table S2). (F) An illustration of Pol II occupancy patterns at the Dqx1 gene. Genomic tracks show elevated Pol II presence at promoters in crypt cells contrasted with heightened Pol II occupancy along gene bodies in villus cells (demonstrated through merged Pol II ChIP-seq replicate data). Villus tracks are depicted in blue and crypt tracks are depicted in red, data visualized using IGV. Bar plots show FPKM values for each gene in crypt and villus derived from crypt vs. villus RNA-seq (GEO: GSE133949). FPKM data is presented as mean ± s.e.m. (n = 13 villi and 12 crypts, two-sided Student’s t-test). (G-H) Comparison of differential Pol II pausing and differential Pol II occupancy at 1417 genes with villus-enriched transcripts (crypt vs. villus RNA-seq: DESeq2 l2FC > 1, FDR < 0.05, FPKM > 1; GEO: GSE133949) reveals differential Pol II recruitment to be the major gene regulatory mechanism driving differentiation-specific gene expression compared to pause-release or mRNA stability.
Fig.4.
Fig.4.. Dynamic transcriptional enhancer activities are associated with differential Pol II recruitment during intestinal differentiation.
(A) and (B) Quadrant plots showing distribution of genes with villus-enriched (A) and crypt-enriched (B) transcripts from RNA-seq data (crypt vs. villus RNA-seq: DESeq2 l2FC > 1 or < −1, FDR < 0.05, FPKM > 1; GEO: GSE133949) with respect to their associated differential enhancer-promoter loops (H3K4Me3 HiChIP-seq: GSE148691) and differential Pol II occupancy (Pol II ChIP-seq). The dotted purple lines show a fold change cut-off of 1.5. (C) and (D) Gene loci of ApoB (C) and Dmbt1 (D) with corresponding enhancer-promoter loops and Pol II occupancy. Villus tracks are depicted in blue and crypt tracks are depicted in red. All loops shown have q < 0.0001 and counts > 4. Bar plots show FPKM values for each gene in crypt and villus derived from RNA-seq (GEO: GSE133949). FPKM data is presented as mean ± s.e.m. (n = 13 villi and 12 crypts, two-sided Student’s t-test). (E) Schematic showing the gene set selected for motif analysis using HOMER (genes with higher chromatin looping events, increased Pol II occupancy, and elevated gene expression in the villus) to identify enhancer-bound transcription factors driving differentiation. The highest-scoring motif identified in the analysis corresponds to the transcription factor HNF4. (See full table in Table S4).
Fig.5.
Fig.5.. Loss of transcription factor HNF4 compromises Pol II recruitment at its target genes.
(A) Schematic illustrating the timepoint at which cell collection was performed in Hnf4αγDKO mice. For ChIP studies, Hnf4αγDKO mice were injected with tamoxifen for 2 consecutive days and harvested the following day. For histology, Hnf4αγDKO mice were injected with tamoxifen for 3 consecutive days and harvested the following day. (B) H&E staining shows loss of HNF4 paralogs leads to loss of villus integrity and prevalence of elongating crypts (representative of 2 biological replicates). (C) Metagene plots show a reduction in Pol II recruitment in Hnf4αγDKO villus cells (n = 3). This reduction is particularly pronounced at the genes dependent on HNF4, compared to those which are not (HNF4 targets defined as bound and regulated by HNF4 as measured by HNF4A/G ChIP-seq: within 30 kb of HNF4 binding sites; and differentially regulated in WT vs. Hnf4αγDKO RNA-seq; GEO: GSE112946). (D) Examples of differential Pol II binding to gene loci in WT and Hnf4αγDKO villus within a 210kb window on chromosome 3, as illustrated using merged Pol II ChIP-seq replicate data. WT tracks are depicted in blue and Hnf4αγDKO tracks are depicted in green. Loci are indicated above, data visualized using IGV. Bar plots show FPKM values for each gene in WT and Hnf4αγDKO cells derived from RNA-seq (GEO: GSE112946). FPKM data is presented as mean ± s.e.m. (n = 3 biological replicates per group, two-sided Student’s t-test).
Fig.6
Fig.6. fosters open chromatin and enhances Pol II recruitment at genes specific to differentiation.
(A) Volcano plot of differential Pol II occupancy between WT and Hnf4αγDKO villus cells (n = 3 biological replicates). Significant Pol II occupancy was called with DESeq2 (Pol II ChIP-seq: l2FC > 0.58 or < −0.58, FDR < 0.05). Genes with significant Pol II enrichment in WT and Hnf4αγDKO were identified as blue and green points, respectively. Points in black represent genes with similar Pol II binding patterns in both cell types. 997 genes in the WT and 882 genes in the Hnf4αγDKO exhibit differential Pol II occupancy (see Table S2). (B) Heatmap shows the distribution of Pol II signal across the gene loci for 997 and 882 WT- and Hnf4αγDKO - enriched Pol II gene sets, respectively (Pol II ChIP-seq: DESeq2, l2FC > 0.58 or < −0.58; FDR < 0.05). (C) Functional annotation of differential Pol II gene sets show an enrichment in HNF4-dependent, villus specific functions in WT and a reversion to a crypt-like state in the Hnf4αγDKO. p values were calculated using DAVID (see full table in Table S2). (D) Schematic for Rapid Immunoprecipitation Mass Spectrometry of Endogenous proteins (RIME) using anti-HNF4α antibodies. (E) Differential analysis of peptide counts from RIME directed against HNF4α and IgG in primary mouse epithelium shows that cohesin subunits and peptides of the SWI/SNF complex co-IP with anti-HNF4α. Peptide fragments with > 1 spectral count and > 2 unique peptide fragments were used for analysis (DESeq2 of peptide counts, FDR < 0.05) (see Table S5). (F) Proposed model suggesting a mechanism by which HNF4 facilitates enhancer-promoter looping and chromatin remodeling, thus providing a conducive environment for Pol II recruitment to a promoter.

Similar articles

References

    1. Barker N., Van De Wetering M., and Clevers H. (2008). The intestinal stem cell. Genes & development 22, 1856. - PMC - PubMed
    1. Potten C.S. (1998). Stem cells in gastrointestinal epithelium: numbers, characteristics and death. Philosophical Transactions of the Royal Society of London. Series B: Biological Sciences 353, 821–830. - PMC - PubMed
    1. Creamer B., Shorter R., and Bamforth J. (1961). The turnover and shedding of epithelial cells: Part I The turnover in the gastro-intestinal tract. Gut 2, 110–116. - PMC - PubMed
    1. Kiela P.R., and Ghishan F.K. (2016). Physiology of Intestinal Absorption and Secretion. Best Pract Res Clin Gastroenterol 30, 145–159. 10.1016/j.bpg.2016.02.007. - DOI - PMC - PubMed
    1. Santaolalla R., Fukata M., and Abreu M.T. (2011). Innate immunity in the small intestine. Curr Opin Gastroenterol 27, 125–131. 10.1097/MOG.0b013e3283438dea. - DOI - PMC - PubMed

Publication types