[Preprint]. 2023 Nov 6:2023.11.04.564839.
doi: 10.1101/2023.11.04.564839.

Transcriptomics and chromatin accessibility in multiple African population samples

Affiliations

Transcriptomics and chromatin accessibility in multiple African population samples

Marianne K DeGorter et al. bioRxiv. .

Abstract

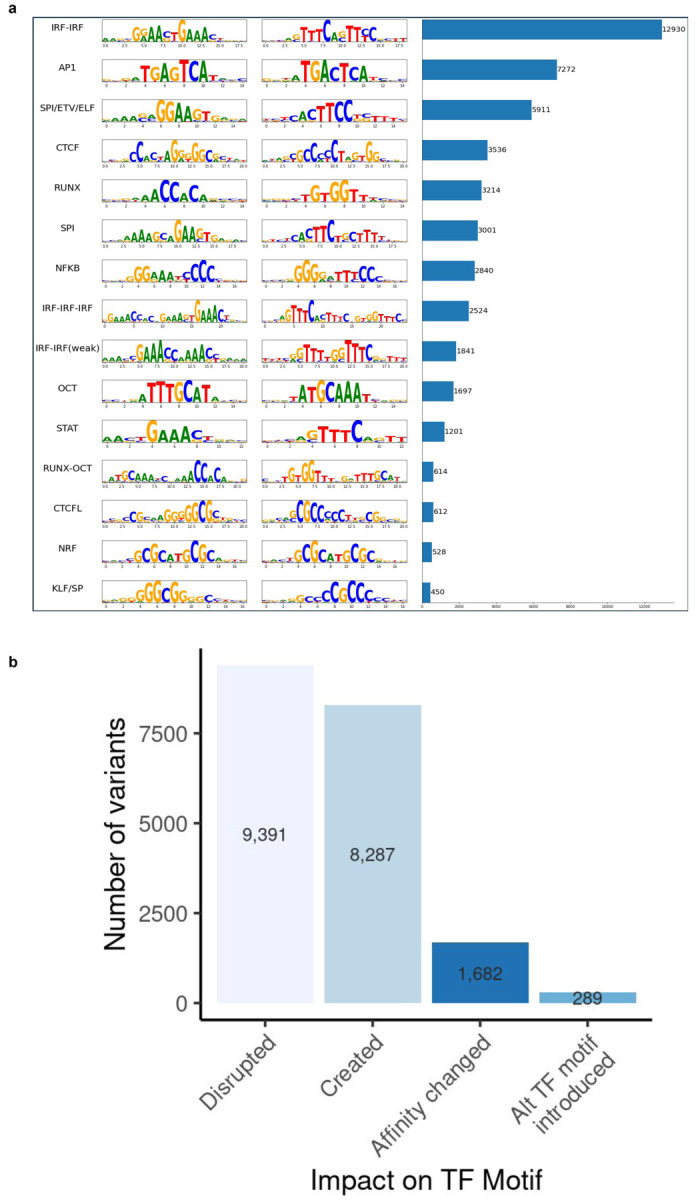
Mapping the functional human genome and impact of genetic variants is often limited to European-descendent population samples. To aid in overcoming this limitation, we measured gene expression using RNA sequencing in lymphoblastoid cell lines (LCLs) from 599 individuals from six African populations to identify novel transcripts including those not represented in the hg38 reference genome. We used whole genomes from the 1000 Genomes Project and 164 Maasai individuals to identify 8,881 expression and 6,949 splicing quantitative trait loci (eQTLs/sQTLs), and 2,611 structural variants associated with gene expression (SV-eQTLs). We further profiled chromatin accessibility using ATAC-Seq in a subset of 100 representative individuals, to identity chromatin accessibility quantitative trait loci (caQTLs) and allele-specific chromatin accessibility, and provide predictions for the functional effect of 78.9 million variants on chromatin accessibility. Using this map of eQTLs and caQTLs we fine-mapped GWAS signals for a range of complex diseases. Combined, this work expands global functional genomic data to identify novel transcripts, functional elements and variants, understand population genetic history of molecular quantitative trait loci, and further resolve the genetic basis of multiple human traits and disease.


Conflict of interest statement

Competing Interests PF is a member of the scientific advisory boards of Fabric Genomics, Inc., and Eagle Genomics, Ltd. AK is on the scientific advisory board of PatchBio, SerImmune, AINovo, TensorBio and OpenTargets, was a paid consultant with Illumina and owns shares in DeepGenomics, Immunai, Illumina, PatchBio and Freenome. SBM is a paid consultant for BioMarin, Tenaya Therapeutics and MyOme.

Figures

Extended Data Figure 1.
Extended Data Figure 1.. Expression of novel sequences transcribed from genome contigs missing from GRCh38
a. Pipeline for alignment and identifying novel reference genome and non-reference genome transcripts. b. The proportion of contigs that are anchored in each genomic region type, or remain unmapped, that harbor at least one expressed transcript over the total number of contigs anchored to that region type. Inset summarizes the mapping status of the parent contigs for the 367 transcripts originating from the non-reference genetic sequences; each square is a transcript. c. Treeplot of transcripts that mapped preferentially to the Sherman at al CAAPA contigs. Each box outlined in white represents a separate contig with at least one transcript; colored boxes indicate what type of region Sherman et al mapped the contig within and grey boxes indicate the contig was not anchored in the reference genome. The size represents the total number of expressed bases originating from that contig. Within each contig, boxes delineated with grey lines represent individual transcripts mapping to the contig, where the relative size and opacity represent the transcript length (in bp).
Extended Data Figure 2:
Extended Data Figure 2:. Characterization of expressed sequences transcribed from genome contigs missing from GRCh38
a. Scatter plot showing transcript size vs expression of transcripts mapped to the CAAPA contigs. Each point is a transcript, scaled by the number of individuals it was detected in, and colored by the context of the contig it mapped to (mRNA, exon, lncRNA, intergenic, or unmapped in Sherman et al.). Inset highlights six genes with median RPKM > 0.1 and transcript length > 700 bp. b. Stacked bar plots depicting the number of individuals with expression of the six transcripts highlighted in (E) across all AFGR populations. c. Scatter plot showing the minimum distance from the start of the transcript (Y-axis) and the end of the transcript (X-axis) to the edge of the contig. d. Gene expression distributions for a novel transcript of the HL-DQB1-mapping contig are similar across populations.
Extended Data Figure 3:
Extended Data Figure 3:. QTL-fine-mapping and credible set sizes
a. Number of independent signals detected by SusieR, per eGene, for all genes with a credible set in at least one African and at least one European population. b. Average credible set size per fine-mapped eGene across populations, for all genes with a credible set in at least one African and at least one European population. c. Number of credible sets with a single variant in the given population across all genes with a credible set in at least one African and at least one European population.
Extended Data Figure 4:
Extended Data Figure 4:. Trends in variants exhibiting allele-specific expression
a. Allele frequency spectra in African populations for variants displaying significant allele-specific expression (ASE), grouped by allele frequency status in the 1000 Genomes European populations. b. Average reference ratio measures for rare protein-truncating variants tested for ASE in AFGR. Variants in red are within genes with predicted PTV-induced gain-of-function effects. Solid points are known OMIM genes; variants in known OMIM genes with predicted PTV-GoF effects are labeled with the encompassing gene name. c. Flowchart illustrating the intersection of rare (MAF < 0.05) ASE variants with heterozygous eQTL variants.
Extended Data Figure 5:
Extended Data Figure 5:. ChromBPnet quality control
a. ChromBPnet logFC predictions for chromatin accessibility at sites tested for ASC, stratified by whether the site was determined to exhibit significant ASC in at least one sample (Allele-specific chromatin accessibility = 1) or not (Allele-specific chromatin accessibility = 0). b. Correlation of chromBPnet-predicted chromatin accessibility logFC scores and the average observed logFC in chromatin accessibility across samples exhibiting significant ASC (n=7,559). c. Correlation of chromBPnet-predicted logFC scores and caQTL effect sizes (betas) at significant caQTL variants (n=11,098). d. Enrichment of absolute caQTL effect size with absolute predicted allelic logFC at increasingly stringent chromBPnet permutation p-value thresholds.
Extended Data Figure 6:
Extended Data Figure 6:. Predicted impact on transcription factor binding sites
a. Top 15 most frequent transcription factor binding sites motifs predicted to be impacted by variants using chromBPNet score (logFC p-values < 0.001) and DeepShAP. b. Frequency of predicted impacts on human transcription factor binding motifs.
Extended Data Figure 7:
Extended Data Figure 7:. LD Score Regression & colocalization region selection
a. LD-Score enrichment values for selected GWAS. b. Schematic depicting prioritization of regions and variants used in colocalization testing. c. Flow chart summarizing number of significant GWAS regions identified, prioritized for colocalization with each QTL type, and colocalized with posterior probability of a shared causal signal >= 0.5
Extended Data Figure 8:
Extended Data Figure 8:. IL7 locus additional figures
a. Locuscompare plots at the IL7 locus showing the correlations for the meta-African IL7 eQTL p-values vs multiple sclerosis GWAS p-values (top); meta-European IL7 eQTL p-values vs multiple sclerosis GWAS p-values (middle); African caQTL p-values for one of three open chromatin regions at the TES of IL7 vs multiple sclerosis GWAS p-values (bottom) b. Hi-C data from 3DGenome showing interaction between IL7 TES and TSS c. [top] Predicted chromatin accessibility of the C allele (orange) and A allele (blue). [bottom] deepSHAP scores across IL7 locus in the presence of the C and A alleles, respectively.
Figure 1.
Figure 1.. Study overview and transcriptome diversity in African population samples
a. Map shows the number of donors from each population with RNA-Seq and ATAC-Seq samples in this study. Boxes highlight the primary data types made available with this resource: enhanced transcriptome annotations, open chromatin maps, observed allele-specific expression and chromatin accessibility measures at heterozygous sites, predicted allele-specific chromatin accessibility at all sites, quantitative trait loci for expression, splicing, and chromatin accessibility, iHS and Fst scores for the top percent of SNPs under selection, and local Eurasian ancestry estimates for all genes. b. Number of novel exons, transcripts, and loci detected from the reference-aligned reads present in at least 5% of samples, but not in the GENCODEv27 reference or NA12878 long read RNA-seq data. “Loci” refers to distinct transcript clusters. c. Sashimi plot of an example novel multi-exon locus from reference-aligned transcripts mapping to chr12:126831804–126858028 between LINC00944 and LINC02372 (bottom). d. Number of exons, transcripts, and loci detected from reads aligning to the CAAPA contigs from Sherman et al. e. Percent of CAAPA contigs anchored in each chromosome that demonstrated expression in the AFGR RNA-seq data. Lollipop size indicates the maximum expression level across all CAAPA contig-aligned transcripts on the given chromosome. Color indicates -log10 of the Fisher Exact p-value. f. Ideogram showing locations of the CAAPA contigs anchored to chromosome 6. Grey, unlabeled lines indicate the insert positions of unexpressed contigs. Contigs with at least one expressed transcript are colored and labeled with the contig accession number; blue indicates expressed contigs outside the HLA region and purple indicates expressed contigs within the HLA region.
Figure 2.
Figure 2.. Analysis of gene expression, chromatin accessibility and genetic differentiation by population and local ancestry
a. Principal component analysis (PCA) of gene expression by population. The first two principal components explain 10.08% and 7% of the variation, respectively. b. PCA of chromatin accessibility by population. The first two principal components explain 15.25% and 9.77% of the variation, respectively. c. PCA of genetic differentiation by population. The first two principal components explain 1.58% and 0.55% of the variation, respectively. d. Volcano plot of gene expression vs local Yoruban ancestry inference.
Figure 3.
Figure 3.. Overview of quantitative trait loci results
a. Number of independently associated signals per gene in the African and European meta-analyzed eQTLs, for genes with a signal in both groups. b. Mean credible set size for African and European meta-analyzed eQTL genes, where genes had a signal in both groups. c. Volcano plot of SV eQTLs and the estimated effect of the alternative allele on expression (β). Significant SV-eQTLs (10% false discovery rate) tested in both AFGR and 1000 Genomes European samples from GEUVADIS (GEU) are colored in purple; significant SV-eQTLs tested only in AFGR are colored in yellow and labeled with the eGene name. d. Number of QTLs with a significant difference in effect size between the indicated populations, determined using deviation contrasts derived from mashr. The color gradients represent the proportion of the eQTLs or sQTLs with significantly different effects, as a percentage of the total number that were tested in both populations. e. Example of a population-specific PSMC2 eQTL in GWD, with mashr-derived posterior z-scores representing the effect size of variants in this region of chromosome 7 in each population. f. Allele frequency distribution of lead AFGR meta-analysis eQTL variants in African and European populations from the 1000 Genomes Project. The allele frequency distribution in AFGR of lead meta-analysis variants not present in European populations (n=2,349) is depicted in gray at the far left of the plot. g. Lead variants (diamond), and variants in high ld (r2 > 0.8) with lead variants (circle), from population-level eQTLs with |iHS| > 2.5 and top 1% average Fst scores.
Figure 4.
Figure 4.. Colocalization and fine-mapping GWAS with QTLs prioritizes functional disease variants
a. Comparison of GWAS colocalizations with the meta-analyzed AFGR eQTLs, and the meta-analyzed European eQTLs from GEUVADIS (y-axis and x-axis, respectively). Loci testable with just AFGR or just GEUVADIS are plotted to the left of x=0 and below y=0, respectively. Point size represents the number of individual eQTL datasets with which the GWAS locus was tested for colocalization. Point color indicates the average probability of colocalization across all the tested groups. The IL7 locus associated with Multiple Sclerosis is circled in grey. b. Credible set size distributions, presented as a proportion of the total number of variants tested, for GWAS-eQTL colocalized regions. SusieR credible sets were generated for each colocalized region using the GWAS summary statistics and the corresponding colocalized QTL summary statistics independently. c. Locuszoom plots for region on chr8 associated with Multiple Sclerosis (top), expression of IL7 in the meta AFGR eQTLs (middle), and one of three chromatin accessibility windows near the transcription end site of IL7 (bottom). Lead GWAS SNP is indicated with the orange diamond in the GWAS panel, and points are colored by LD to the lead variant based on the 1000 Genomes European VCF. Variants prioritized in the SusieR credible sets are circled in grey. The annotation track at the bottom highlights the position and direction of the IL7 gene, and the genotype-associated open chromatin regions (caQTLs). d. Annotation heatmap of all susieR credible set variants at the IL7 locus. Top two rows depict African and European LD between credible set variant and lead GWAS variant; middle four rows display the posterior inclusion probability (PIP score) for each variant in the indicated credible set, where light grey indicates that the variant was tested but not included in the credible set; bottom two rows display the predicted allele-specific chromatin accessibility score from chromBPnet, and the proportion of heterozygous samples with significant observed ASC at that variant.

References

    1. Nurk S. et al. The complete sequence of a human genome. Science 376, 44–53 (2022). - PMC - PubMed
    1. Sherman R. M. et al. Assembly of a pan-genome from deep sequencing of 910 humans of African descent. Nat. Genet. 51, 30–35 (2019). - PMC - PubMed
    1. Lappalainen T. et al. Transcriptome and genome sequencing uncovers functional variation in humans. Nature 501, 506–511 (2013). - PMC - PubMed
    1. Aguet F. et al. The GTEx Consortium atlas of genetic regulatory effects across human tissues. bioRxiv 787903 (2019) doi: 10.1101/787903. - DOI - PMC - PubMed
    1. Genetic effects on gene expression across human tissues | Nature. https://www.nature.com/articles/nature24277.

Publication types