[Preprint]. 2023 Nov 9:2023.11.08.566351.
doi: 10.1101/2023.11.08.566351.

Are Escherichia coli causing recurrent cystitis just ordinary Uropathogenic E. coli (UPEC) strains?

Affiliations

Are Escherichia coli causing recurrent cystitis just ordinary Uropathogenic E. coli (UPEC) strains?

Nicolas Vautrin et al. bioRxiv. .

Update in

Abstract

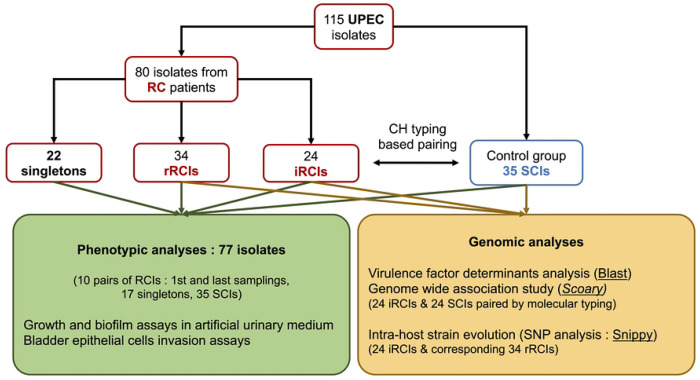
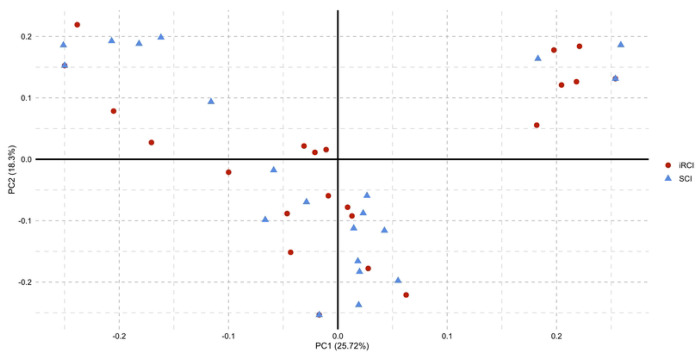
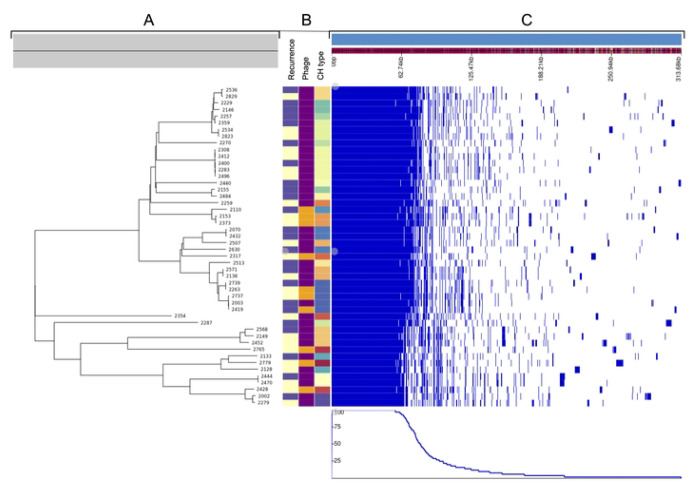
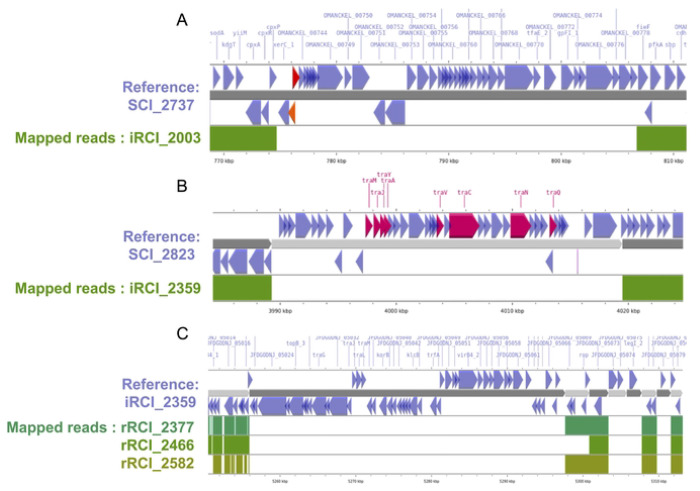
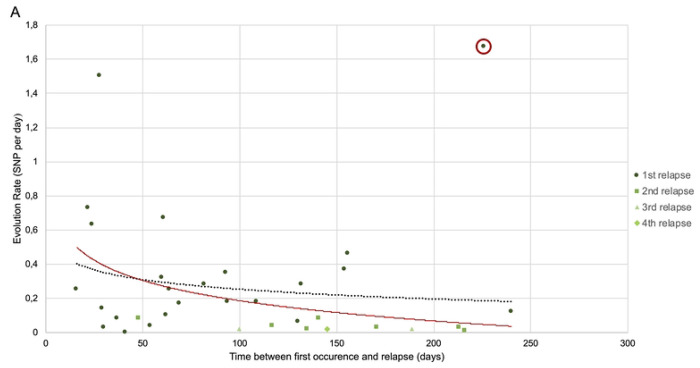
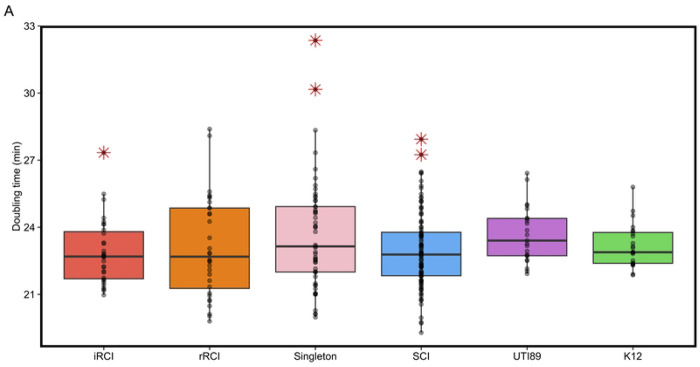
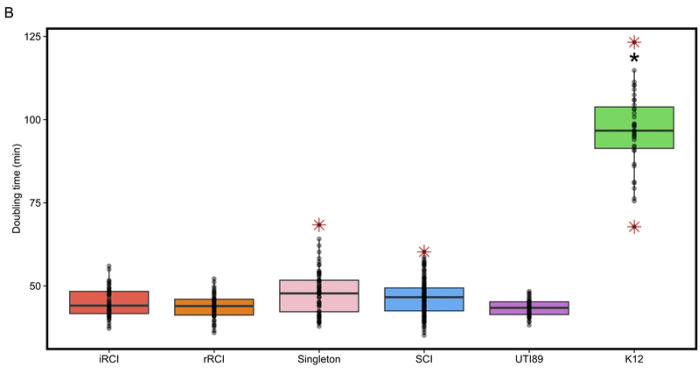
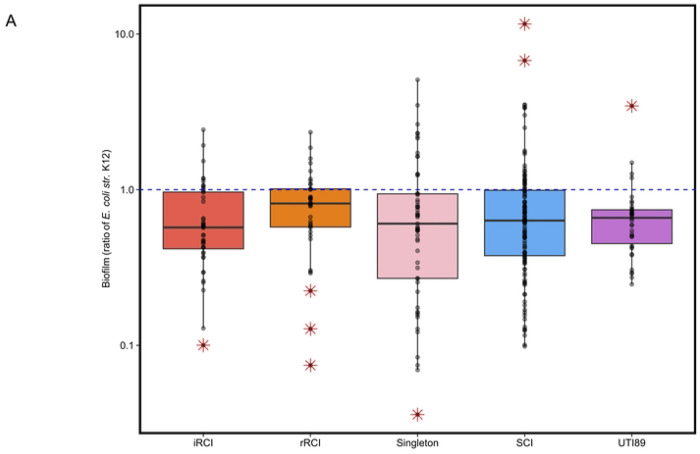
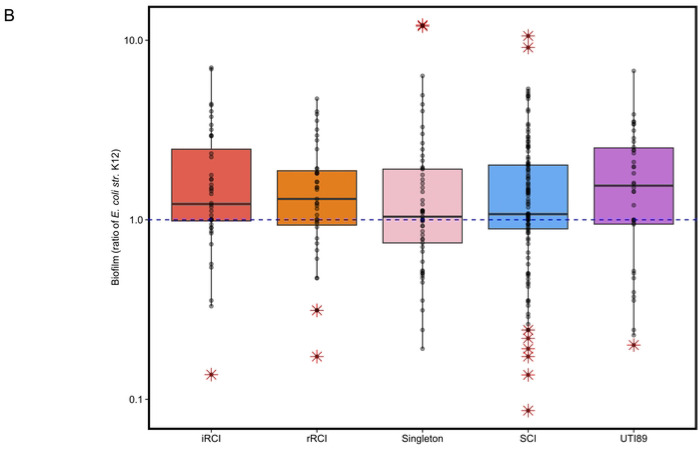
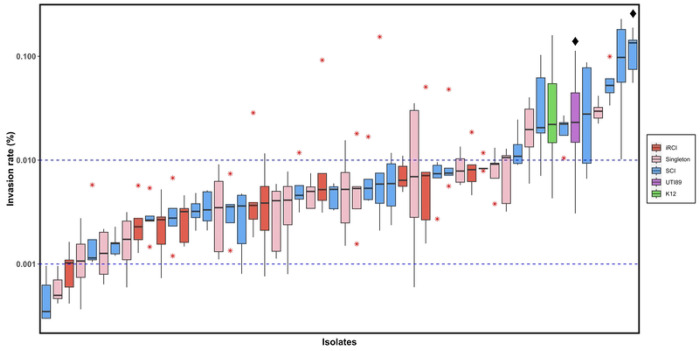
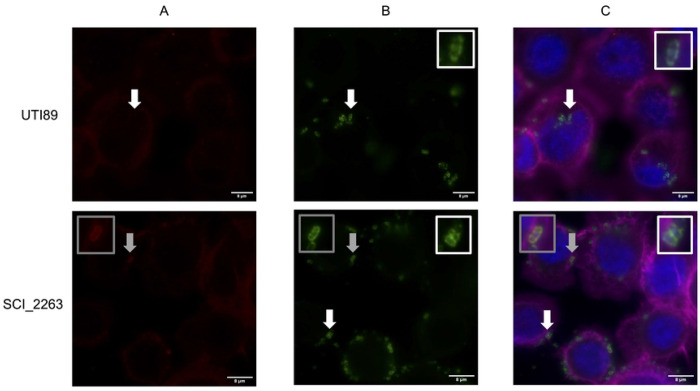
Specific determinants associated with Uropathogenic Escherichia coli (UPEC) causing recurrent cystitis are still poorly characterized. The aims of this study were (i) to describe genomic and phenotypic traits associated with recurrence using a large collection of recurrent and paired sporadic UPEC isolates, and (ii) to explore within-host genomic adaptation associated with recurrence using series of 2 to 5 sequential UPEC isolates. Whole genome comparative analyses between 24 recurrent cystitis isolates (RCIs) and 24 phylogenetically paired sporadic cystitis isolates (SCIs) suggested a lower prevalence of putative mobile genetic elements (MGE) in RCIs, such as plasmids and prophages. The intra-patient evolution of the 24 RCI series over time was characterized by SNP occurrence in genes involved in metabolism or membrane transport, and by plasmid loss in 5 out of the 24 RCI series. Genomic evolution occurred early in the course of recurrence, suggesting rapid adaptation to strong selection pressure in the urinary tract. However, RCIs did not exhibit specific virulence factor determinants and could not be distinguished from SCIs by their fitness, biofilm formation, or ability to invade HTB-9 bladder epithelial cells. Taken together, these results suggest a rapid but not convergent adaptation of RCIs that involves both strain- and host-specific characteristics.


Figures

Fig 1.
Fig 1.. Isolate and workflow description.
RC patients = patients with recurrent cystitis, iRCI = initial recurrent cystitis isolate, rRCI = recurrent cystitis isolate associated with relapse(s), SCI = sporadic cystitis isolate.
Fig 2.
Fig 2.. Principal component analysis based on the detection of virulence factor genes.
Red dots represent iRCIs (initial recurrent cystitis isolates) and blue triangles represent SCIs (sporadic cystitis isolates).
Fig 3.
Fig 3.. Core genome analysis of the 24 iRCIs and their 24 CH type paired SCIs.
iRCIs = initial recurrent cystitis isolates, SCIs = sporadic cystitis isolates. A. Neighbor-Joining phylogenetic tree based on the 48 strains’ translated core gene alignment (2,755,382 amino acid positions). B. Color-coded CH type, prophage presence (purple = absent, yellow = present), clinical context of recurrence (purple = iRCI, yellow = SCI) for the 48 strains. C. Presence/absence (blue/white) of the 15,682 genes from the pan genome in each strain, sorted by gene frequency among the 48 strains. The first 2,864 genes on the left represent the core genome.
Fig 4.
Fig 4.. Examples of mobile genetic elements that are found in SCIs but not in their paired iRCIs (A and B) or lost in sequential relapses in RCI patients (C).
Contigs from genome assemblies are shown in an alternance of dark and light grey arrows, iRCIs = initial recurrent cystitis isolates, rRCI = recurrent cystitis isolate associated with relapse(s), SCIs = sporadic cystitis isolates. Just above and below, blue arrows indicate the location and orientation of CDSs on the contigs. A. A 40 kb portion of SCI_2737 contig #6 is represented in dark grey. Orange and red arrows respectively indicate SCI-associated genes Sgene1 and Sgene2. Beneath, the regions covered by the reads from paired iRCI_2003 are indicated in green. The >30 kb SCI_2737 genome region that is not covered by iRCI_2003 reads includes 44 phage proteins similar to those from Peduovirus P24B2 (AccNum NC_049387). B. SCI_2823 contig #59 is represented in light grey. Pink arrows indicate the location of plasmid-specific genes from the tra operon. The reads from paired iRCI_2359 map to SCI_2823 contigs #58 and #60, but not to the >30 kb contig #59, which derives from a plasmid similar to the Escherichia coli strain HS13-1 plasmid pHS13-1-IncF (AccNum CP026494) C. Contig #3 from hybrid genome assembly of iRCI_ 2359 is indicated in dark grey. Below, the coverage of this contig by the reads of the corresponding rRCIs is shown in shades of green. iRCI_2359 contig #3 corresponds to a 42kb plasmid similar to the E. coli pRHB15-C18_3, (AccMum CP057780.1) that is lost in the first to third relapses.
Fig 5.
Fig 5.. Intra patient micro-evolution of RCIs by SNP acquisition.
RCIs = recurrent cystitis isolates A. Global representation of the evolution rates (SNPs per day) from the 24 series of intra-patient RCIs depending on the time elapsed between the first occurrence and the relapse (days). An outlier is circled in red. The black dotted curve represents the non-significant trend when including all the dots (p = 0.124). The red curve represents the significant trend when excluding the outlier (p = 0.028). B. Individual representation of the core SNPs observed over time in the largest intra-patient RCI serie (RCI2). SNPs are color-coded depending of the time of emergence (the darker, the latter). CHR = Contig on which the SNP was identified, POS = position of the SNP on the contig.
Fig 6.
Fig 6.. Boxplots representing the doubling time (in min) of each group of isolates in lysogenic broth (LB) (A) or in artificial urinary medium (AUM) (B).
iRCIs = initial recurrent cystitis isolates, rRCI = recurrent cystitis isolate associated with relapse(s), SCIs = sporadic cystitis isolates, K12 = E. coli str. K12. Each dot represents a mean doubling time for one isolate in the corresponding group. Red asterisks represent extreme phenotypes for a given group (outliers).
Fig 7.
Fig 7.. Biofilm formation in lysogenic broth (LB) (A) and in artificial urinary medium (AUM) (B) expressed as a ratio of E. coli str. K12 biofilm production.).
iRCIs = initial recurrent cystitis isolates, rRCI = recurrent cystitis isolate associated with relapse(s), SCIs = sporadic cystitis isolates. The blue dashed line represents the biofilm production level of E. coli str. K12. Each dot represents a mean ratio of biofilm production for one isolate in the corresponding group. Red asterisks represent extreme phenotypes for a given group (outliers).
Fig 8.
Fig 8.. Invasion capacity of UPEC isolates in HTB-9 bladder epithelial cells after gentamicin protection assay.
Boxplots represent the individual invasion rates of 10 iRCIs (initial recurrent cystitis isolates, red), 16 singletons (pink), 24 SCIs (sporadic cystitis isolates, blue), E. coli str. K12 (K12, green) and positive control strain UTI89 (purple). Red asterisks represent outliers. Diamonds indicates isolates for which microscopy results are presented in Fig 8. Blue dashed lines represent the invasion rate interval described by Schwartz et al. (2011).
Fig 9.
Fig 9.. Observation of intracellular bacteria (SCI_2263, reference strain UTI89) in HTB-9 bladder epithelial cells by fluorescence microscopy.
A. Extracellular bacteria are labelled in red (staining without cell membrane permeabilization). B. Total (i.e. intra + extracellular) bacteria are labeled in green (staining with cell permeabilization). C. BEC nuclei are labelled with DAPI (in blue) and actin with phalloidin (in purple). Extracellular bacteria are labelled in red or yellow (green + red) and intracellular bacteria are labelled strictly in green. White arrows and insets are focusing on strictly intracellular bacteria while grey arrows and insets on strictly extracellular bacteria.

References

    1. Foxman B. Epidemiology of urinary tract infections: Incidence, morbidity, and economic costs. Disease-a-Month. 2003;49: 53–70. doi:10.1067/mda.2003.7 - DOI - PubMed
    1. Foxman B. The epidemiology of urinary tract infection. Nat Rev Urol. 2010;7: 653–660. doi: 10.1038/nrurol.2010.190 - DOI - PubMed
    1. Glover M, Moreira CG, Sperandio V, Zimmern P. Recurrent urinary tract infections in healthy and nonpregnant women. Urological Science. 2014;25: 1–8. doi:10.1016/j.urols.2013.11.007 - DOI - PMC - PubMed
    1. Medina M, Castillo-Pino E. An introduction to the epidemiology and burden of urinary tract infections. Therapeutic Advances in Urology. 2019; 11: 175628721983217. doi:10.1177/1756287219832172 - DOI - PMC - PubMed
    1. Ejrnaes K, Sandvang D, Lundgren B, Ferry S, Holm S, Monsen T, et al. Pulsed-Field Gel Electrophoresis Typing of Escherichia coli Strains from Samples Collected before and after Pivmecillinam or Placebo Treatment of Uncomplicated Community-Acquired Urinary Tract Infection in Women. J Clin Microbiol. 2006;44: 1776–1781. doi:10.1128/JCM.44.5.1776-1781.2006 - DOI - PMC - PubMed

Publication types