[Preprint]. 2023 Nov 7:rs.3.rs-3484527.
doi: 10.21203/rs.3.rs-3484527/v1.

Multi-night cortico-basal recordings reveal mechanisms of NREM slow wave suppression and spontaneous awakenings at high-temporal resolution in Parkinson's disease

Affiliations

Multi-night cortico-basal recordings reveal mechanisms of NREM slow wave suppression and spontaneous awakenings at high-temporal resolution in Parkinson's disease

Md Fahim Anjum et al. Res Sq. .

Update in

Abstract

Background: Sleep disturbance is a prevalent and highly disabling comorbidity in individuals with Parkinson's disease (PD) that leads to worsening of daytime symptoms, reduced quality of life and accelerated disease progression.

Objectives: We aimed to record naturalistic overnight cortico-basal neural activity in people with PD, in order to determine the neurophysiology of spontaneous awakenings and slow wave suppression in non-rapid eye movement (NREM) sleep, towards the development of novel sleep-targeted neurostimulation therapies.

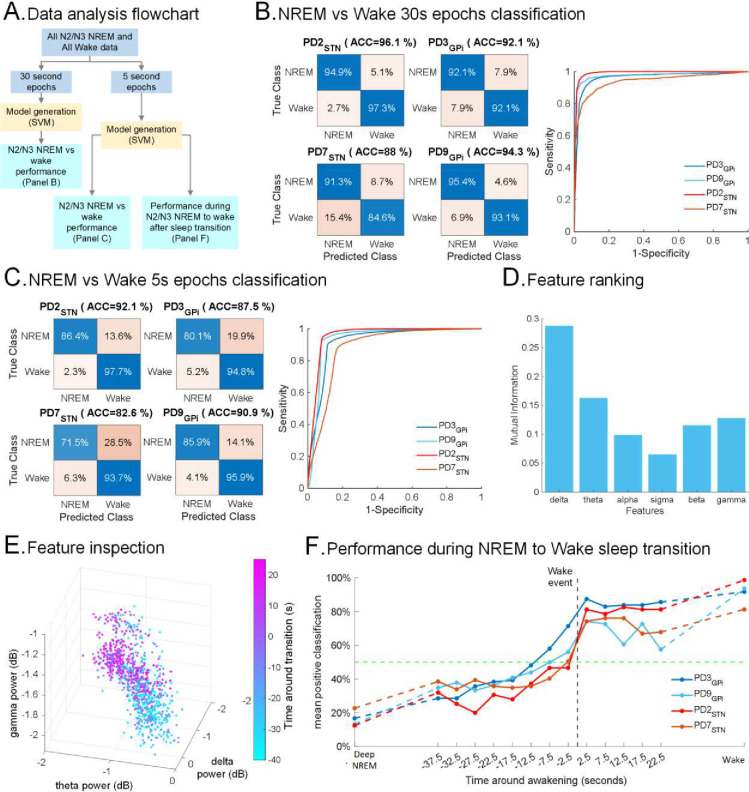
Methods: Multi-night (n=58) intracranial recordings were performed at-home, from chronic electrocorticography and subcortical electrodes, with sensing-enabled Deep Brain Stimulation (DBS), paired with portable polysomnography. Four participants with PD and one participant with cervical dystonia were evaluated to determine the neural structures, signals and functional connectivity modulated during NREM sleep and prior to spontaneous awakenings. Intracranial recordings were performed both ON and OFF DBS to evaluate the impact of stimulation. Sleep staging was then classified with machine-learning models using intracranial cortico-basal signals on classical (30 s) and rapid (5 s) timescales.

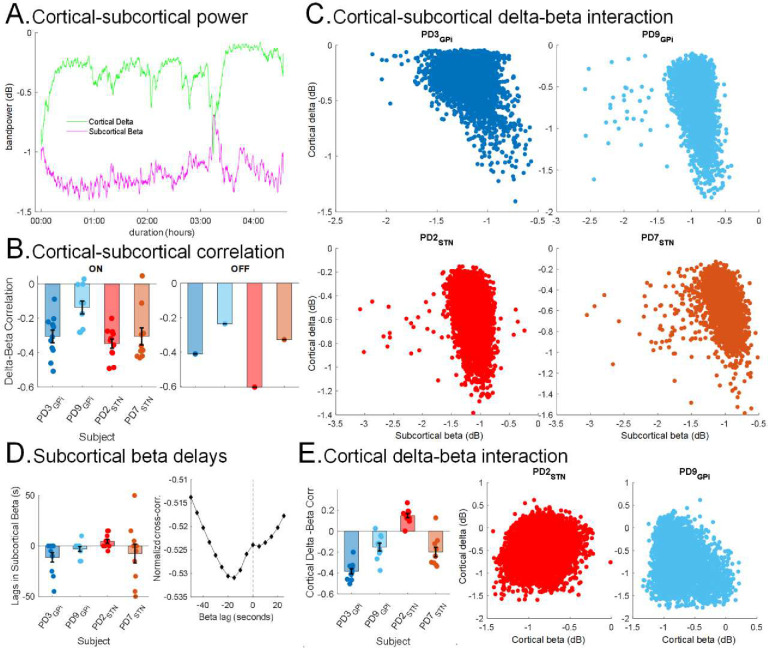
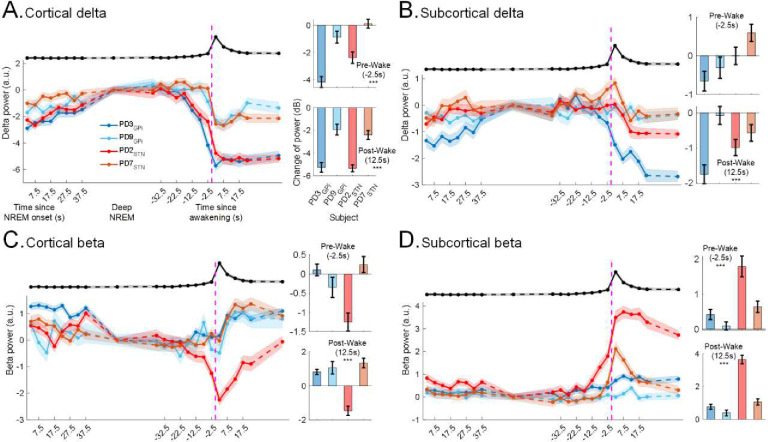
Results: We demonstrate an increase in cortico-basal slow wave delta (1-4 Hz) activity and a decrease in beta (13-31 Hz) activity during NREM (N2 and N3) versus wakefulness in PD. Cortical-basal ganglia coherence was also found to be higher in the delta range and lower in the beta range during NREM. DBS stimulation resulted in a further elevation in cortical delta and a decrease in alpha (8-13 Hz) and low beta (13-15 Hz) power compared to the OFF stimulation state. Within NREM sleep, we observed a strong inverse interaction between subcortical beta and cortical slow wave activity and found that subcortical beta increases prior to spontaneous awakenings at high-temporal resolution (5s). Our machine-learning models trained on intracranial cortical or subcortical power features achieved high accuracy in both traditional (30s) and rapid (5s) time windows for NREM vs. wakefulness classification (30s: 92.6±1.7%; 5s: 88.3±2.1%).

Conclusions: Chronic, multi-night recordings in PD reveal increased cortico-basal slow wave, decreased beta activity, and changes in functional connectivity in NREM vs wakefulness, effects that are enhanced in the presence of DBS. Within NREM, subcortical beta and cortical delta are strongly inversely correlated and subcortical beta power increases prior to spontaneous awakenings. Our findings elucidate the network-level neurophysiology of sleep dysfunction in PD and the mechanistic impact of conventional DBS. Additionally, through accurate machine-learning classification of spontaneous awakenings, this study also provides a foundation for future personalized adaptive DBS therapies for sleep dysfunction in PD.


Conflict of interest statement

Declarations of competing interest SL has received honoraria from Medtronic and is a paid consultant for Iota Biosciences. TD is founder-chairman of MINT neurotechnology, founder/CSO of Amber Therapeutics (bioelectronic medicines), and a paid advisor for Cortec Neuro. TD has research collaborations with Magtim Ltd, Medtronic, and Bioinduction Ltd.

Figures

Figure 1.
Figure 1.. Methodology, data collection and analysis procedures:
(A) Schematic of the RC+S system setup for recording intracranial cortical Field Potentials (FP) in participants (Adapted from Gilron et al. 2021). (B) Illustrations of the placement of RC+S sensing depth electrodes in subcortex for both STN and GPi (right) and cortical ECoG locations (left). Example data from PD2 and PD3 participants. (C) Schematic of the Dreem2, portable headband for recording in-home polysomnography overnight (adapted from Debellemaniere et al. 2018). (D) Illustration of a single night of sleep in a PD participant (DBS ON) with hypnogram (purple) showing sleep stages (AW: awake; RM: REM; [N1, N2, N3]: NREM) and cortical (top 2 panels) and subcortical (bottom 2 panels) spectrogram panels from both hemispheres showing multi-frequency changes across sleep stages where the x-axis is time in hours and y-axis is frequency (Hz). FP was recorded bilaterally from cortical and subcortical regions. (E) Flowchart of data analysis and preprocessing procedures for multi-night sleep dataset (n=5) and ON/OFF dataset (n=4). (F) Representative traces of the RC+S FP time series in all sleep stages from cortex (left column) and subcortex (right column; Subthalamic Nucleus). Columns share scale bars and rows share color legends (Wake, REM, N1, N2 and N3). Data from one PD participant with ON stimulation from the left hemisphere. (G) Comparisons of spectral powers of intracranial FPs among sleep stages in cortex (left) and subcortex (right) for a single participant, DBS ON. Shaded error bars indicate standard error. Shares color legend with panel F.
Figure 2.
Figure 2.. Dynamic changes in power spectra and functional connectivity between cortical and subcortical regions during N2/N3 NREM sleep:
(A) Power Spectrum changes (mean ± SEM) during N2/N3 NREM sleep with wake stage as baseline in low frequency range (1–50 Hz) for all PD participants (n=4) during ON stimulation in cortical (top) and subcortical (bottom) areas. y-axis shows the difference in power spectra between N2/N3 NREM and wake stage in decibels (dB). Thick lines show mean and shaded areas show standard errors (SEM). (B) Power in delta (1–4 Hz) increases while beta (13–31 Hz) band power decreases during N2/N3 NREM sleep compared to wake during ON stimulation in cortical (top) and subcortical (bottom) areas. Each bar shows the difference in spectral power for one participant averaged across multiple nights and each data point shows the average difference in spectral power across one night with data pooled from both hemispheres. (C) During OFF stimulation conditions, delta power increases while beta power decreases in N2/N3 NREM compared to the wake stage in PD participants (n=4) in cortical (top) and subcortical (bottom) areas. Thick lines show means and shaded areas show standard errors. (D) Difference in cortical spectral power between ON and OFF stimulation conditions in 4 participants with PD in N2/N3 NREM sleep stages (top), showing increased delta (1–4 Hz) and decreased alpha and sigma activities (8–15 Hz) while ON stimulation. Each colored line shows spectral change for one participant, thick line shows average across the participants with shaded area as SEM. The spectral power in subcortical regions didn’t show any statistically significant difference (bottom). The x-axis is frequency (Hz) and the y-axis is difference in power (ON-OFF). (E) Changes in cortical-subcortical spectral coherence (mean ± SEM) during N2/N3 NREM sleep with wake stage as baseline for all participants (n=5) during ON stimulation. y-axis shows the difference in spectral coherence between N2/N3 NREM and wake stage. Horizontal back line at 0 represents wake stage baseline. (F) Total difference in spectral coherence in delta (1–4 Hz, left) and beta (13–31 Hz, right) during N2/N3 NREM sleep compared to wake during ON stimulation. Each bar shows difference in spectral coherence for one participant averaged across multiple nights and each point shows average difference in spectral coherence across one night with data pooled from both hemispheres. (G) During OFF stimulation conditions, delta coherence increases while beta coherence decreases in N2/N3 NREM compared to the wake stage in PD participants (n=4). Data from both hemispheres were pooled for all panels.
Figure 3.
Figure 3.. Inverse relationship between subcortical beta and cortical delta FP activities during N2/N3 NREM:
(A) Example of subcortical beta (purple) and cortical delta (green) power during N2/N3 NREM in a single night from one PD participant (PD3) during ON stimulation depicting the inverse relationship in temporal domain. The delta and beta powers were smoothed with a 20-point gaussian kernel. (B) Average Spearman’s rho correlation between subcortical beta power and cortical delta power for all 4 PD participants across multiple nights in ON (left) and in OFF (right) stimulation during N2/N3 NREM. Each bar shows average correlation for one participant and each point shows correlation across one night with data pooled from both hemispheres. (C) Scatter plots depicting the correlation between subcortical FP beta (13–31 Hz) power and cortical FP delta (1–4 Hz) power during N2/N3 NREM sleep in 4 PD participants during ON stimulation; STN (brown and red), and GPi (blue, light blue). Each point represents data from one 5s N2/N3 NREM sleep epoch. Each plot is data from one night pooled from both hemispheres for one participant. (D) Normalized cross-correlation between subcortical beta power and cortical delta power showing the subcortical beta preceding cortical delta activities in PD participants during N2/N3 NREM with ON stimulation. The bar plot (left) shows lags in subcortical beta with cortical delta as reference. Each bar shows average lag for one participant and each point shows lag across one night with data pooled from both hemispheres. Example of cross-correlation showing the lag in subcortical beta as a function of time (right) in one night from PD2 during ON stimulation. The vertical dashed line shows zero-lag. (E) Interactions between cortical delta and cortical beta activities, examined as a control for cortical delta-subcortical beta during N2/N3 NREM. The bar plot (left) shows average Spearman’s rho correlation between cortical delta and beta power for all 4 PD participants across multiple nights, ON stimulation. Each bar shows average correlation for one participant and each point shows correlation across one night with data pooled from both hemispheres. The scatter plots (middle and right) show cortical delta and beta power in 4 PD participants during ON stimulation for two representative PD participants. Each point represents data from one 5s N2/N3 NREM sleep epoch.
Figure 4.
Figure 4.. Changes in N2/N3 NREM spectral power before spontaneous awakenings:
Subcortical beta increases and cortical delta decreases before spontaneous awakening. (A) Cortical delta (1 – 4 Hz) power during N2/N3 NREM to wake after sleep transition episodes for all PD participants (n=4; mean ± SEM) during ON stimulation (left). Each data point is the average for 5s data epochs and shadings represent SEMs for N2/N3 NREM to wake after sleep transitions across the recording nights for one participant. Data were pooled from both hemispheres. The vertical purple dashed line shows awakening time. x-axis (on the left) shows time in seconds since N2/N3 NREM sleep onset and time since awakening (middle, around vertical dashed line). The black line on top shows the across-subject (mean ± SEM) norm of RC+S accelerometry data for all N2/N3 NREM to wake after sleep transitions across all nights for all participants highlighting the awakening time of the episodes. Accelerometry data were rescaled (min-max normalization) in the y-axis (a.u.) for visualization. The bar plots show change in cortical delta power during immediate pre-awakening N2/N3 NREM (2.5s before the wake event, top) and early post-awakening (12.5s after the wake event, bottom) compared to the average delta power in deep N2/N3 NREM (average over N2/N3 NREM data after 40s from N2/N3 NREM onset and 40s before awakening; SWS). Each bar shows average change of power for one participant and each point shows change of power across all N2/N3 NREM to wake transitions in one night with data pooled from both hemispheres. Cortical delta power gradually increases as sleep deepens and decreases steadily before awakening. The average early post-awakening (12.5s) and immediate pre-awakening N2/N3 NREM delta powers (−2.5s) are lower than those during SWS. The average early post-awakening (12.5s) cortical delta power is lower than the immediate pre-awakening N2/N3 NREM delta power (−2.5s). (B) Same as A, for subcortical delta power showing no significant trend across participants or recording sites for both pre and post awakenings. (C) Same as A, for cortical beta power showing no significant trend across participants or recording sites for both pre and post awakenings. (D) Same as A, only for subcortical beta power illustrating spontaneous rise in N2/N3 NREM beta power before awakenings. The average early post-awakening (12.5s) and immediate pre-awakening N2/N3 NREM subcortical beta power in (−2.5s) are higher than those during SWS.
Figure 5.
Figure 5.. Classification of N2/N3 NREM vs wakefulness with cortical FP:
(A) Flowchart describing the machine learning (ML) model generation and performance evaluation. (B) Performance of participant-specific ML models for N2/N3 NREM vs wakefulness classification for all PD participants (n=4) with classical 30s epoch window in terms of confusion matrices (left) and receiver operating characteristic (ROC) performance (right). (C) Same as B, for 5s epoch window. (D) Bandpower feature importance and ranking where x-axis represents 6 bandpower features and y-axis shows average mutual information between bandpower and N2/N3 NREM and wake state across all PD participants (n=4). 5s epochs were utilized. (E) Depiction of the top three bandpower features (delta, beta and gamma) in a scatter plot for data from N2/N3 NREM to wake transitions. Data points represent 5-second epochs from a single PD participant (PD2). Color bar (left) shows the time around awakening in seconds. (F) Performance of the ML models trained on 5s epochs shown in C during N2/N3 NREM to wake after sleep transition. The x-axis represents time in seconds around awakening and y-axis is the average wake classification by the ML models across all transitions of the participant. The vertical black dashed line shows awakening time and the horizontal green dashed line represents 50% average wake detection by the models. For all panels, left and right side data were pooled. For ground truth of 5s epochs, actual awakening events within the classical 30s sleep epochs were determined with accelerometry data and then segmented into N2/N3 NREM and Wake 5s segments (see Methods and Supplementary Fig. 3).

References

    1. Videnovic A. & Golombek D. Circadian and sleep disorders in Parkinson’s disease. Exp. Neurol. 243, 45–56 (5/2013). - PMC - PubMed
    1. Barone P. et al. The PRIAMO study: A multicenter assessment of nonmotor symptoms and their impact on quality of life in Parkinson’s disease. Mov. Disord. 24, 1641–1649 (2009). - PubMed
    1. Bartolomei L. et al. Relevance of sleep quality on caregiver burden in Parkinson’s disease. Neurol. Sci. 39, 835–839 (5/2018). - PubMed
    1. Karlsen K. H., Larsen J. P., Tandberg E. & Maeland J. G. Influence of clinical and demographic variables on quality of life in patients with Parkinson’s disease. J. Neurol. Neurosurg. Psychiatry 66, 431–435 (1999). - PMC - PubMed
    1. Rutten S. et al. The bidirectional longitudinal relationship between insomnia, depression and anxiety in patients with early-stage, medication-naïve Parkinson’s disease. Parkinsonism Relat. Disord. 39, 31–36 (2017). - PMC - PubMed

Publication types

LinkOut - more resources