[Preprint]. 2023 Oct 27:2023.10.25.562925.
doi: 10.1101/2023.10.25.562925.

A spatial human thymus cell atlas mapped to a continuous tissue axis

Affiliations

A spatial human thymus cell atlas mapped to a continuous tissue axis

Nadav Yayon et al. bioRxiv. .

Update in

  • A spatial human thymus cell atlas mapped to a continuous tissue axis.
    Yayon N, Kedlian VR, Boehme L, Suo C, Wachter BT, Beuschel RT, Amsalem O, Polanski K, Koplev S, Tuck E, Dann E, Van Hulle J, Perera S, Putteman T, Predeus AV, Dabrowska M, Richardson L, Tudor C, Kreins AY, Engelbert J, Stephenson E, Kleshchevnikov V, De Rita F, Crossland D, Bosticardo M, Pala F, Prigmore E, Chipampe NJ, Prete M, Fei L, To K, Barker RA, He X, Van Nieuwerburgh F, Bayraktar OA, Patel M, Davies EG, Haniffa MA, Uhlmann V, Notarangelo LD, Germain RN, Radtke AJ, Marioni JC, Taghon T, Teichmann SA. Yayon N, et al. Nature. 2024 Nov;635(8039):708-718. doi: 10.1038/s41586-024-07944-6. Epub 2024 Nov 20. Nature. 2024. PMID: 39567784 Free PMC article.

Abstract

T cells develop from circulating precursors, which enter the thymus and migrate throughout specialised sub-compartments to support maturation and selection. This process starts already in early fetal development and is highly active until the involution of the thymus in adolescence. To map the micro-anatomical underpinnings of this process in pre- vs. post-natal states, we undertook a spatially resolved analysis and established a new quantitative morphological framework for the thymus, the Cortico-Medullary Axis. Using this axis in conjunction with the curation of a multimodal single-cell, spatial transcriptomics and high-resolution multiplex imaging atlas, we show that canonical thymocyte trajectories and thymic epithelial cells are highly organised and fully established by post-conception week 12, pinpoint TEC progenitor states, find that TEC subsets and peripheral tissue genes are associated with Hassall's Corpuscles and uncover divergence in the pace and drivers of medullary entry between CD4 vs. CD8 T cell lineages. These findings are complemented with a holistic toolkit for spatial analysis and annotation, providing a basis for a detailed understanding of T lymphocyte development.


Conflict of interest statement

Conflict of interest J.C.M has been an employee of Genentech, Inc. since September 2022. In the past three years, S.A.T. has consulted for or been a member of scientific advisory boards at Qiagen, Sanofi, GlaxoSmithKline, and ForeSite Labs. She is a consultant and equity holder for TransitionBio and EnsoCell. The remaining authors declare no competing interests.

Figures

Figure 1.
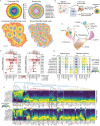
Figure 1.. Spatial and single cell atlas data and methodology.
A. Sample composition for dissociated and spatial datasets that span fetal (pcw 11 to 21) and early paediatric human life (0 to 3 years) from both newly generated data as well as data curated from recent studies. Top: Spatial datasets include IBEX 44-plex protein cyclic imaging, RareCyte single-cycle 14-plex protein imaging and 10x Genomics Visium spatial transcriptomics, along with 3 fetal Visium data sets we had published previously (Suo et al 2022). Bottom: Dissociated datasets are composed of scRNA-seq coupled with TCR-seq for TCRαβ, 143-plex surface protein CITE-seq coupled with TCR-seq for TCRαβ. Each dot represents a sample, stacked dots represent libraries from the same donor. Dot colour indicates enrichment strategy applied to cells prior to library generation. Dot border colour indicates whether TCR-seq was carried out. See Supplementary Table 1+2 for sample origin and metadata; also see Extended Data Figures 1, 2. B. TissueTag tool enables interactive (powered by bokeh), manual and semi-automated image annotation directly in a Jupyter environment allowing for unified annotation and analysis. TissueTag annotations are converted from pixel to spot grid space, where continuous distance measurements are possible. C. Components and basic workflow of the ImageSpot toolbox for complete image processing throughout this study. VisiuMator and IBEXtractor pipelines support TissueTag-derived annotations to be transferred to 10x Visium and high-resolution single-cell imaging data, respectively. Finally, OrganAxis allows generation of a landmark CCF for two or more landmarks combined and provides downstream analysis for continuous CCFs.
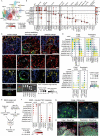
Figure 2.
Figure 2.. Relative distance-based construction of a continuous cortico-medullar morphological axis from image annotation landmarks.
A. Representative H&E image of a section from a paediatric thymus showing the major anatomical subcompartments. B. Representative H&E images (left), discrete broad level annotations (level 0)(centre), and fine structure manual annotations (level 1)(right) of fetal (top) and paediatric (bottom) Visium samples paired with gene expression-corrected UMAP embeddings with corresponding annotations. Box highlights two Visium spots showing immature Hassall’s Corpuscles in fetal samples. PVS: perivascular space, HC: Hassal’s corpuscle. C. IBEX Virtual H&E image, constructed from nuclear Hoechst (blue) and Pan-Cytokeratin (magenta). D. Broad level annotations (left) and 44-protein measurement UMAP embedding on two resolution levels – 50 μm spot grid (top) and single nuclei 3D segmentations (bottom). Manual image annotations of PVS and HCs represented on UMAPs from both data types (right). All scale bars in A-D are 1 mm E. Continuous annotations of Visium and IBEX datasets plotted on batch-corrected UMAP space coloured by the minimal Euclidean distance to the nearest edge (capsule/septa, left) or to the cortex (right). F. Schematic illustration of the construction of the Cortico-Medullary Axis (CMA) CCF (left). Discrete annotations of edge (e), cortex (c) and medulla (m) (top). Function D is visually highlighted in (E). The combination of Euclidean distances between each high-resolution spot to the nearest anatomical structure as derived from the tissue annotations serves as a basis for generation of a continuous axis from the edge of the cortex to the centre of the medulla (bottom). Projection of the CMA to Visium spot space highlighting a differential representation of discrete (level 0) annotations from the CMA that accounts for the relative size of a structure (e.g., the medulla) to be inferred as 3D depth (right). G. UMAP representation of integrated data sets coloured by CMA values to highlight the consistency across age and spatial modality. H. Sum of the Spearman correlation coefficient R of individual PCA components with the CMA and corrected for explained PCA variance of individual PCs, highlighting the similarity of captured transcriptomic variance between fetal and paediatric data sets as opposed to the technical random factor (n_genes_by_spots).
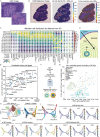
Figure 3.
Figure 3.. Mapping of fetal and paediatric thymocytes to the CMA reveals largely conserved trajectories for cells of the αβ T lineage.
A. Illustration of the continuous (left) and binned (right) CMA as a schematic and overlaid on a representative IBEX section from paediatric thymus. B. Schematic illustration of the analysis workflow. scRNA-seq references are used for deconvolution of Visium spots via cell2location. The CMA is calculated for each cell/spot and predicted cell abundances, gene and protein expression per spot are interpreted and compared by fine-grained binning of the continuous CMA. C. UMAP embedding of integrated fetal and paediatric scRNA-seq data from T lineage cells and annotation of developmental stages. D. Expression of marker genes across the main differentiation stages of the T lineage in fetal and paediatric scRNA-seq data. Total number of captured cells per stage is indicated in the associated bar graph. E. CMA mapping of the main differentiation stages of the T lineage for fetal and paediatric Visium sections. ETP and DN_early stages were plotted separately with adjusted cutoff to aid visualisation of these rare subsets. F. Chemokine and cytokine transcript gradients derived from Visium spot data. Arrows highlight cytokines/chemokines with strong differences in their expression pattern between fetal and paediatric thymus. Cytokines are clustered by spatial pattern similarity across the CMA for the paediatric thymus. Selected cytokines/chemokines that are critical for thymocyte migration and maturation are highlighted in red.
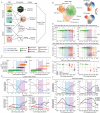
Figure 4.
Figure 4.. CMA mapping shows broad conservation in the distribution of the TECs in fetal and paediatric thymi.
A. UMAP embedding of integrated fetal and paediatric scRNA-seq data for thymic epithelial cells (TECs) with cell type annotations. B. Dot plot visualisation of RNA expression levels of TEC lineage marker genes. Boxes highlight the mcTEC and mcTEC-proliferating cells and corresponding marker genes used for validation in G. C. IBEX confocal images from 7 day old male thymus (Sample_07) showing expression of five different keratins. Scale bar: 100 μm for large insets and 25 μm for small insets. Insets are approximate. Images are representative of 8 similar datasets. Dot plot (bottom) shows transcript levels of the corresponding keratin genes in the main TEC subtypes according to the paediatric scRNA-seq data set. D. Relative cell distribution and enrichment in CMA bins for TECs based on Visium spot deconvolution. Boxes highlight mcTECs. Note that proliferating mcTECs were only found in fetal thymus and cTECIII was exclusively detected in paediatric data. Cutoff levels indicate the threshold for the minimum abundance of a cell type in a Visium spot for the spot to be included. E. Schematic overview of the workflow of KNN mapping and gene imputation of IBEX single cell segmentations based on matching IBEX cells to the scRNA-seq reference. F. Spatial distribution patterns of TEC subsets in the IBEX data after inferring the annotation of segmented cells from the scRNA-seq reference. Dot size represents the relative abundance and colour depicts the local enrichments in the CMA bin. KNNf indicates the cutoff for the fraction of KNNs that corresponded to the eventually assigned majority cell type annotation and indicates mapping quality (see Methods). G. RNAscope probe-based staining of the transcripts of mcTEC-specific markers DLK2 (purple) and IGFBP6 (yellow) as well as mTEC marker EPCAM (red) and cTEC marker LY75 (green). White arrows indicate the co-expression of all markers in the (sub-)capsular zones in the fetal thymus. Scale bar: 20 μm. H. RareCyte protein staining of fetal and paediatric thymus sections with MKI67 (red), Pan-Cytokeratin (PanCK, purple) and CD45 (green) antibodies. Arrows in the fetal image highlight a subcapsular niche in the fetal thymus with proliferating (MKI67+) non-lymphoid (CD45-) keratinized cells. Arrows in the paediatric image highlight keratinized cells in a lymphocyte-free region in the perivascular space (PVS), which do not show extensive proliferation. Scale bars: 200 μm.
Figure 5.
Figure 5.. Specialised mTECs are organised around HCs in the paediatric medulla.
A. Representative H&E Image of a thymus sample from a 7 day-old donor highlighting multiple HCs in the medulla. Scale bars full image: 200 μm, scale bar inset: 40 μm. B. Representative Visium H&E reference image (left), overlaid with minimal distance per spot to HC (plotted up to 350 μm for better visualisation, middle), and full CMA (right). C. Distribution of cells in the paediatric medulla from Visium deconvolution data. Distance to HC was split into bins of 25 μm. Absolute spot numbers are depicted on the right D. Illustration of the discrepancy between the distance to the HC as opposed to the CMA. While the CMA and medullary depth are parallel, the distance to the HC is dependent on the local spatial distribution of the nearest HC. E. Weighted mean position of medullary cells along the two axes based on deconvolved Visium data. Note that mTECIII are closest to the HC while not the deepest with respect to the CMA. F. Schematic of the workflow for identification of cell specialisation genes (SGs) and their spatial mapping based on Visium data. G. Distribution of all 851 medullary genes along the CMA and with respect to HC distance. SGs are represented by large dots, which are coloured according to the cell type they are uniquely expressed in. H. UMAP embedding for mTEC lineage with annotation of subtypes highlighting the mTECII/mTECIII branch (left). Palantir embedding and scFates trajectory analysis of the mTECII/III lineage (right). Colour indicates time. Small arrows were manually added for illustration of direction. I. Trajectory embeddings showing the expression of canonical markers of mTECII (AIRE) and mTECIII (IVL, KRT10). J. Annotation of differentiated mTECII/III states guided by skin and mucosal SGs, which are spatially enriched around HCs (see Supplementary Figure 5 for further information).
Figure 6.
Figure 6.. Multimodal high-resolution annotation and spatial mapping of CD8 and CD4 lineage cells reveals differences in the cortico-medullary migration.
A. Workflow of feature extraction and integration of multimodal datasets. Denoised surface protein levels and RNA expression from CITE-seq together with TCR-seq data were used to call T lineage maturation stages in the paediatric thymus and carry out trajectory analysis for the CD4 and CD8 lineages using Slingshot. Integrated CITE-seq and scRNA-seq data were used for cell abundance prediction in Visium data using cell2location and as a single cell reference for KNN similarity mapping and annotation of IBEX nuclei segmentations. OrganAxis mapping on paediatric Visium and IBEX sections was carried out with ImageSpot. B. WNN UMAP representation of paediatric CITE-seq data based on RNA and cell surface protein expression for conventional αβ T lineage cells from positive selection to full maturity (left) and pseudotimes for the CD4 and CD8 lineage obtained with Slingshot (right). C. Cells ordered along CD4 (right) and CD8 lineage pseudotime (left) with colour indicating discrete annotations. Four pseudotime phases were derived from the cytokine receptor expression profiles in (D); cortical (blue) and migration stage (purple) were identified using spatial mapping in (E). D. Analysis of cell surface protein levels of lineage and maturation markers along predicted pseudotimes for CD4 (right) and CD8 lineage (left). Line plots represent smoothed means and standard error of surface protein levels in cells shown in (C). E. Localisation of CD4 (right) and CD8 lineage cells (left) within the thymus lobule as predicted by integration of spatial and CITE-seq data. Top panel shows individual cells in the dissociated dataset with inferred CMA from Visium data after hyperclustering. Medians and 0.05/0.95 quantiles for CMA value and pseudotime of the discrete annotated substages are also shown. Middle panel shows individual cells in the IBEX data after CMA calculation and inference of cell annotation/pseudotime through KNN similarity mapping with the CITE-seq protein/RNA data serving as reference. KNNf = 0.5 was used as a cutoff for cells to be included. Medians and 0.05/0.95 quantiles for the discrete annotated substages are also depicted. Bottom panel provides a direct comparison of the medians/quantiles shown in the top and middle panel for Visium (circle) and IBEX mapping (diamond). F. Analysis of RNA and protein levels of chemokine receptors. Line plots represent smoothed means and standard error of surface protein or RNA levels in cells shown in (C).

References

    1. Pellicci D. G., Koay H.-F. & Berzins S. P. Thymic development of unconventional T cells: how NKT cells, MAIT cells and γδ T cells emerge. Nat. Rev. Immunol. 20, 756–770 (2020). - PubMed
    1. Van Kaer L., Postoak J. L., Song W. & Wu L. Innate and Innate-like Effector Lymphocytes in Health and Disease. J. Immunol. 209, 199–207 (2022). - PMC - PubMed
    1. Farley A. M. et al. Dynamics of thymus organogenesis and colonization in early human development. Development 140, 2015–2026 (2013). - PMC - PubMed
    1. Haynes B. F., Scearce R. M., Lobach D. F. & Hensley L. L. Phenotypic characterization and ontogeny of mesodermal-derived and endocrine epithelial components of the human thymic microenvironment. J. Exp. Med. 159, 1149–1168 (1984). - PMC - PubMed
    1. Lobach D. F. & Haynes B. F. Ontogeny of the human thymus during fetal development. J. Clin. Immunol. 7, 81–97 (1987). - PubMed

Publication types