[Preprint]. 2023 Nov 11:2023.11.10.566629.
doi: 10.1101/2023.11.10.566629.

Functional parcellation of the neonatal brain

Affiliations

Functional parcellation of the neonatal brain

Michael J Myers et al. bioRxiv. .

Update in

  • Functional parcellation of the neonatal cortical surface.
    Myers MJ, Labonte AK, Gordon EM, Laumann TO, Tu JC, Wheelock MD, Nielsen AN, Schwarzlose RF, Camacho MC, Alexopoulos D, Warner BB, Raghuraman N, Luby JL, Barch DM, Fair DA, Petersen SE, Rogers CE, Smyser CD, Sylvester CM. Myers MJ, et al. Cereb Cortex. 2024 Jan 31;34(2):bhae047. doi: 10.1093/cercor/bhae047. Cereb Cortex. 2024. PMID: 38372292 Free PMC article.

Abstract

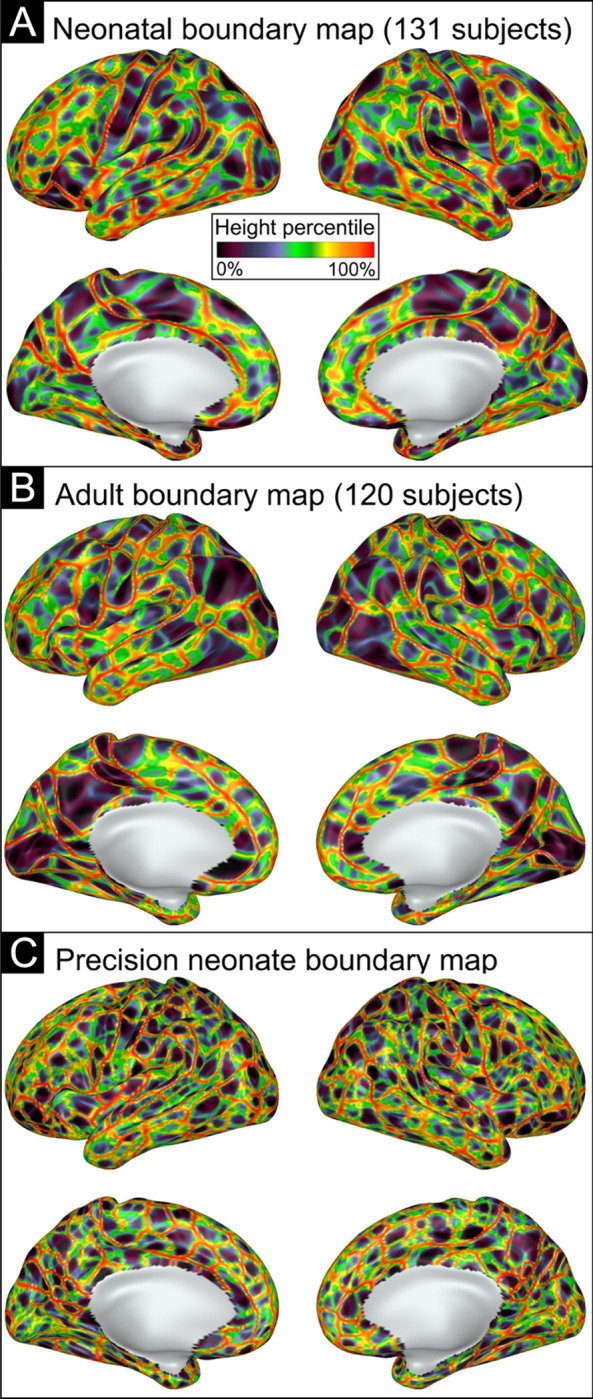
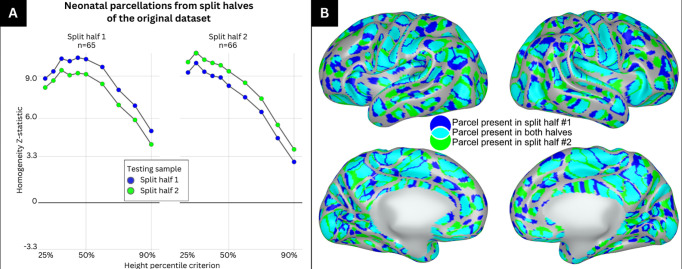
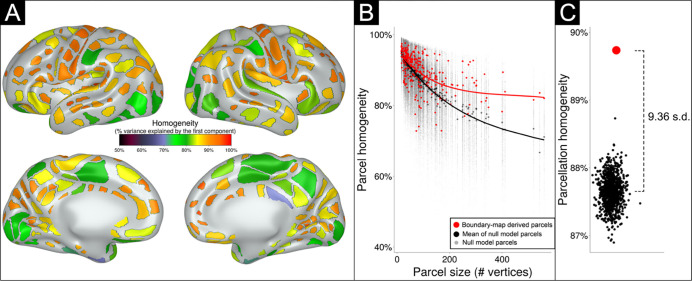
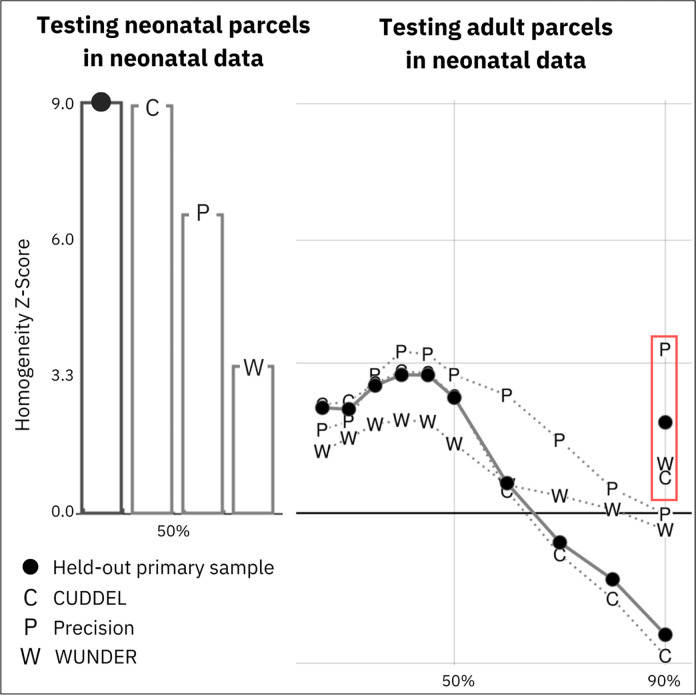
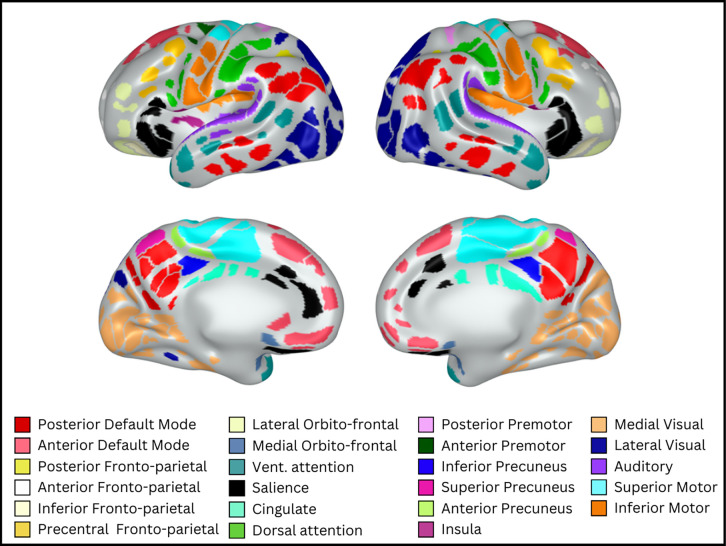
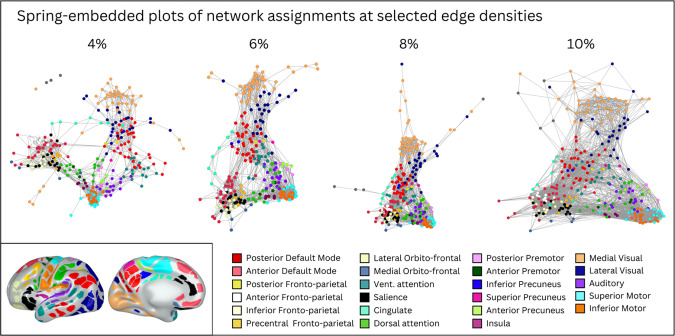
The cerebral cortex is organized into distinct but interconnected cortical areas, which can be defined by abrupt differences in patterns of resting state functional connectivity (FC) across the cortical surface. Such parcellations of the cortex have been derived in adults and older infants, but there is no widely used surface parcellation available for the neonatal brain. Here, we first demonstrate that adult- and older infant-derived parcels are a poor fit with neonatal data, emphasizing the need for neonatal-specific parcels. We next derive a set of 283 cortical surface parcels from a sample of n=261 neonates. These parcels have highly homogenous FC patterns and are validated using three external neonatal datasets. The Infomap algorithm is used to assign functional network identities to each parcel, and derived networks are consistent with prior work in neonates. The proposed parcellation may represent neonatal cortical areas and provides a powerful tool for neonatal neuroimaging studies.

Keywords: cortical areas; fMRI; functional connectivity; neonate; parcellation.


Conflict of interest statement

COMPETING INTERESTS Damien A. Fair is a patent holder on the Framewise Integrated Real-Time Motion Monitoring (FIRMM) software. He is also a co-founder of Turing Medical Inc. that licenses this software. The nature of this financial interest and the design of the study have been reviewed by the University of Minnesota, and a plan has been established to ensure that this research study is not affected by the financial interest. The other authors declare no competing interests.

Figures

Figure 1:
Figure 1:. Resting state functional connectivity (RSFC) boundary maps generated based on abrupt changes in FC.
A) Neonatal RSFC boundary map generated based on the average of all 131 subjects’ gradient maps. B) Adult RSFC boundary map based on the average of 120 subjects. C) Neonatal RSFC boundary map generated based on a single neonate’s gradient maps. Boundaries are indicated by color based on height percentile of edge density, where bright colors indicate locations where abrupt transitions in RSFC patterns were consistent across many cortical vertices, and darker colors represent areas of cortex where the RSFC patterns were relatively stable.
Figure 2:
Figure 2:. Parcels generated at the 50% height threshold from split-halves of the primary dataset highly overlap with one another.
A) The primary dataset was split into split half 1 and split half 2 and used to generate parcellations at varying height thresholds between 25% and 90%. Each split-half parcellation was then tested against the sample that generated the parcellation and the other split half. The left panel represents the homogeneity z-statistic of the parcellation generated from split half 1 tested against itself (blue) and the other split half (green) at varying height thresholds. The right panel represents the homogeneity z-statistic of the parcellation generated from split half 2 tested against itself (green) and the other split half (blue) at varying height thresholds. B) Medial and lateral view of the right and left hemisphere showing parcels which are identified in split half 1 only (blue), split half 2 only (green) and in both split halves (cyan).
Figure 3:
Figure 3:. The parcellation generated from the primary dataset (n=131) shows 283 highly homogenous parcels at 50% height threshold.
A) Parcels are colored based on homogeneity value, calculated based on percent variance explained by the first principal component of the connectivity patterns of the individual vertices comprising each parcel. B) The homogeneity of each parcel (red dots) is plotted as a function of parcel size. Black dots indicate the homogeneity of each parcel over 1000 null rotations. Note that many parcels had true homogeneity values higher than the average of null rotations, especially larger parcels. C) The performance of the entire parcellation scheme tested against 1000 null rotations. The black dots indicate the average homogeneity value across all 283 parcels for each of the 1000 null rotations. The red dot represents the average homogeneity value across all 283 parcels in the true data. The average homogeneity across all parcels was 9.36 standard deviations above the mean of the null rotations.
Figure 4:
Figure 4:. Validation of neonatal parcellations.
A) The primary dataset (n=131) was used to generate a parcellation which was tested in four datasets. The bar graph represents the homogeneity z-statistic of the parcellation generated from the primary dataset against the second, held-out half of the dataset (n=130; black dot) and three external datasets (CUDDEL+OXYGEN, C; Precision Baby, P; WUNDER, W). B) Adult ‘Gordon parcels’ were generated using the same parameters as used in generating the neonatal parcels and were applied to the primary dataset (black dots), as well as external datasets (CUDDEL+OXYGEN, C; Precision Baby, P; WUNDER, W), to test the fit of adult parcels on the neonatal FC data across height thresholds (25%–90%). Markers in the red rectangle denote testing of ‘Gordon parcels’ with original published parameters (90% height threshold; n=400 steps) on each neonatal dataset. Note that adult parcels do a poor job of capturing neonatal FC patterns.
Figure 5:
Figure 5:. Assigned functional network identities for each parcel.
Consensus network assignments for each parcel based on information across all edge densities. Colors and network names were assigned based on adult networks in similar anatomical locations.
Figure 6:
Figure 6:. Spring embedded plots of neonatal parcels across different edge densities reveal neonatal network properties.
A spring embedded layout of neonatal functional connections at various edge densities between 4% and 10%. Each colored circle corresponds to a particular parcel, colored based on consensus network assignment. Lines represent functional connections between parcels at a given edge density (e.g., at 4% edge density, only the top 4% of positive functional connections are shown). In the spring-embedded representation, stronger connections tend to pull parcels closer together, and so the proximity of parcels to each other is related to their inter-connectivity. Note that when only considering the strongest connections (e.g., 4%), parcels cluster mainly by network (color) and anatomical location (e.g., frontal networks are all near each other); but when considering weaker connections (e.g., 10%), there is some evidence of selective connections between anatomically distant parcels that end up forming the same adult network (e.g., the red and watermelon parcels draw close to each other; these parcels may be precursors of the adult default mode network). Inset shows consensus network assignment of each parcel for reference (identical to Figure 5).

References

    1. Felleman D. J. & Van Essen D. C. Distributed hierarchical processing in the primate cerebral cortex. Cereb. Cortex 1, 1–47 (1991). - PubMed
    1. Sejnowski T. J. & Churchland P. S. Brain and cognition. in Foundations of cognitive science, (pp (ed. Posner M. I.) vol. 888 301–356 (The MIT Press, xiv, 1989).
    1. Petersen S. E. & Sporns O. Brain Networks and Cognitive Architectures. Neuron 88, 207–219 (2015). - PMC - PubMed
    1. Cohen A. L. et al. Defining functional areas in individual human brains using resting functional connectivity MRI. Neuroimage 41, 45–57 (2008). - PMC - PubMed
    1. Wig G. S., Laumann T. O. & Petersen S. E. An approach for parcellating human cortical areas using resting-state correlations. Neuroimage 93 Pt 2, 276–291 (2014). - PMC - PubMed

Publication types