

This is a preprint.
Targeting GD2-positive Refractory/Resistant Neuroblastoma and Osteosarcoma with Anti- CD3 x Anti-GD2 Bispecific Antibody Armed T cells
- PMID: 37986911
- PMCID: PMC10659559
- DOI: 10.21203/rs.3.rs-3570311/v1
Targeting GD2-positive Refractory/Resistant Neuroblastoma and Osteosarcoma with Anti- CD3 x Anti-GD2 Bispecific Antibody Armed T cells
Update in
-
Targeting refractory/recurrent neuroblastoma and osteosarcoma with anti-CD3×anti-GD2 bispecific antibody armed T cells.J Immunother Cancer. 2024 Mar 21;12(3):e008744. doi: 10.1136/jitc-2023-008744. J Immunother Cancer. 2024. PMID: 38519053 Free PMC article. Clinical Trial.
Abstract
Background: Since treatment of neuroblastoma (NB) with anti-GD2 monoclonal antibodies provides a survival benefit in children with minimal residual disease and our preclinical study shows that anti-CD3 x anti-GD2 bispecific antibody (GD2Bi) armed T cells (GD2BATs) were highly cytotoxic to GD2+ cell lines, we conducted a phase I/II study in recurrent/refractory patients to establish safety and explore the clinical benefit of GD2BATs.
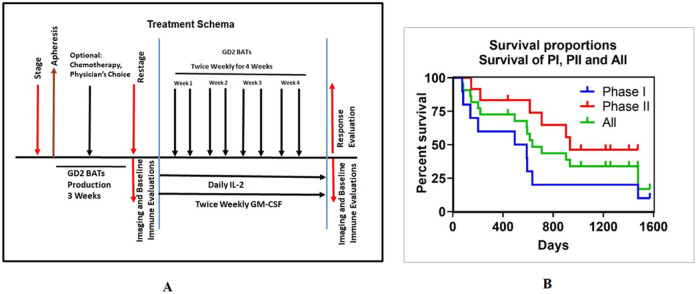
Methods: The 3+3 dose escalation study (NCT02173093) phase I involved 9 evaluable patients with NB (n=5), osteosarcoma (OST) (n=3), and desmoplastic small round cell tumors (DSRCT) (n=1) with twice weekly infusions of GD2BATs at 40, 80, or 160 x 106 GD2BATs/kg/infusion with daily interleukin 2 (300,000 IU/m2) and twice weekly granulocyte-macrophage colony stimulating factor (250 μg/m2). Phase II portion of the trial was conducted in patients with NB at the dose 3 level of 160 x 106 GD2BATs/kg/infusion but failed to enroll the planned number of patients.
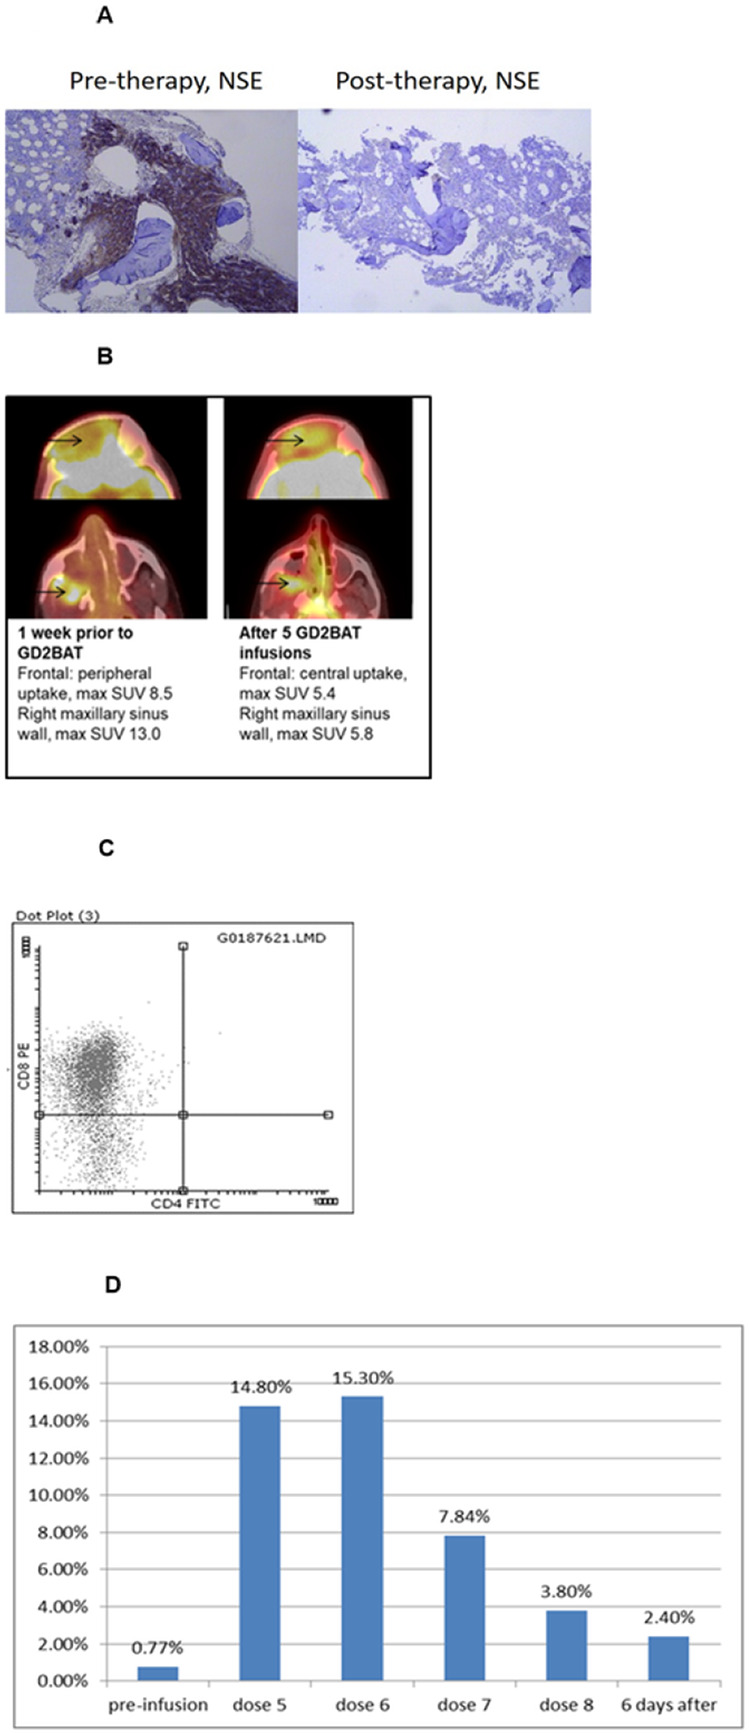
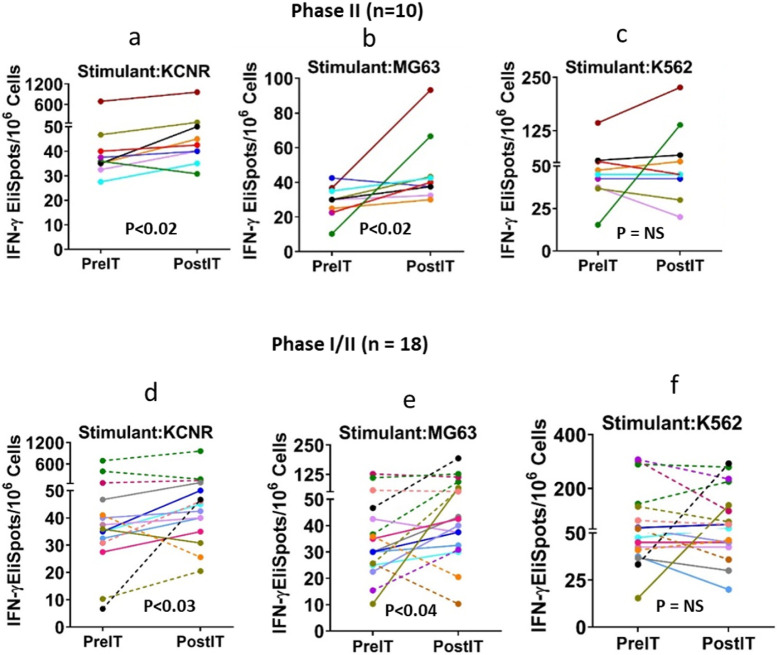
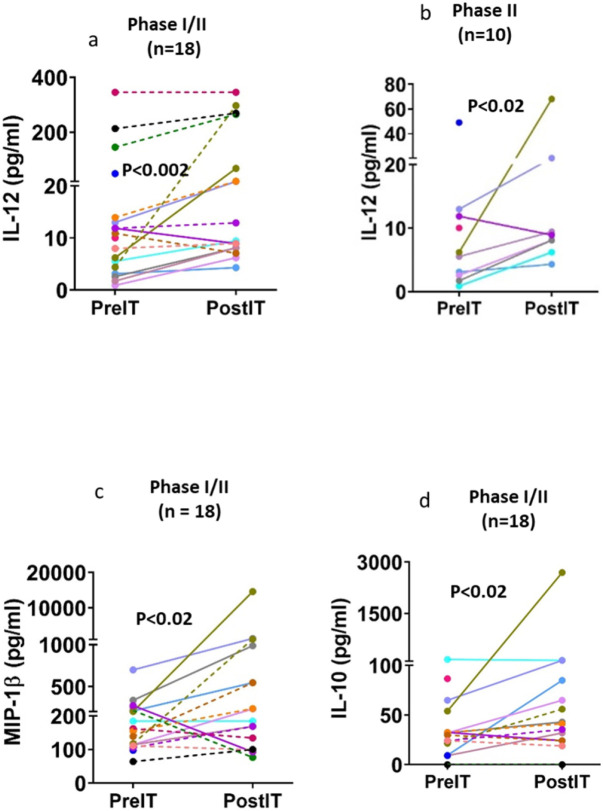
Results: Nine of 12 patients in the phase I completed therapy. There were no dose limiting toxicities (DLTs). All patients developed mild and manageable cytokine release syndrome (CRS) with grade 2-3 fevers/chills, headaches, and occasional hypotension up to 72 hours after GD2BAT infusions. GD2-antibody associated pain was not significant in this study. The median OS for patients in the Phase I and limited Phase II was 18.0 and 31.2 months, respectively, whereas the combined OS was 21.1 months. There was a complete bone marrow response with overall stable disease in one of the phase I patients with NB. Ten of 12 phase II patients were evaluable for response: 1 had partial response. Three additional patients were deemed to have clinical benefit with prolonged stable disease. More than 50% of evaluable patients showed augmented immune responses to GD2+ targets after GD2BATs as measured by interferon-gamma (IFN-γ) EliSpots, Th1 cytokines, and/or chemokines.
Conclusions: Our study demonstrated safety of up to 160 x 106 cells/kg/infusion of GD2BATs. Combined with evidence for the development of post treatment endogenous immune responses, this data supports further investigation of GD2 BATs in larger Phase II clinical trials.
Keywords: Targeted T cells; anti-CD3 x anti-GD2 bispecific antibody; bispecific antibodies; hu3F8; neuroblastoma; osteosarcoma.
Conflict of interest statement
Conflict of Interest: LGL is co-founder of Transtarget, Inc. and is a SAB member for Rapa Therapeutics, Inc. LGL is founder of BATs, LLC. LGL and AT were named as inventors in multiple patents filed by UV. Both MSK and NKC have financial interest in Y-mAbs, Abpro-Labs and Eureka Therapeutics. NKC reports receiving commercial research grants from Y-mabs Therapeutics and Abpro-Labs Inc. NKC was named as inventor on multiple patents filed by MSK, including those licensed to Ymabs Therapeutics, Biotec Pharmacon, and Abpro-labs. NKC is a SAB member for Abpro-Labs and Eureka Therapeutics. AT is co-founder of Novo-Immune. DWL holds a CAR-T related patent and his university receives clinical trial funding from KITE Pharma/Gilead.
Figures
References
Publication types
Grants and funding
LinkOut - more resources
Full Text Sources
