[Preprint]. 2023 Nov 8:rs.3.rs-3526342.
doi: 10.21203/rs.3.rs-3526342/v1.

Neuronal Glycogen Breakdown Mitigates Tauopathy via Pentose Phosphate Pathway-Mediated Oxidative Stress Reduction

Affiliations

Neuronal Glycogen Breakdown Mitigates Tauopathy via Pentose Phosphate Pathway-Mediated Oxidative Stress Reduction

Sudipta Bar et al. Res Sq. .

Update in

Abstract

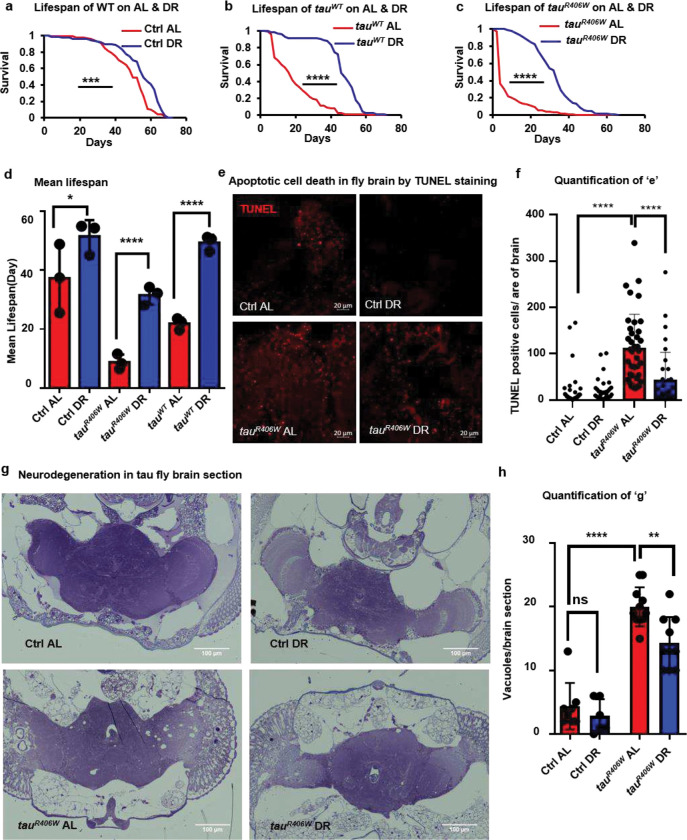
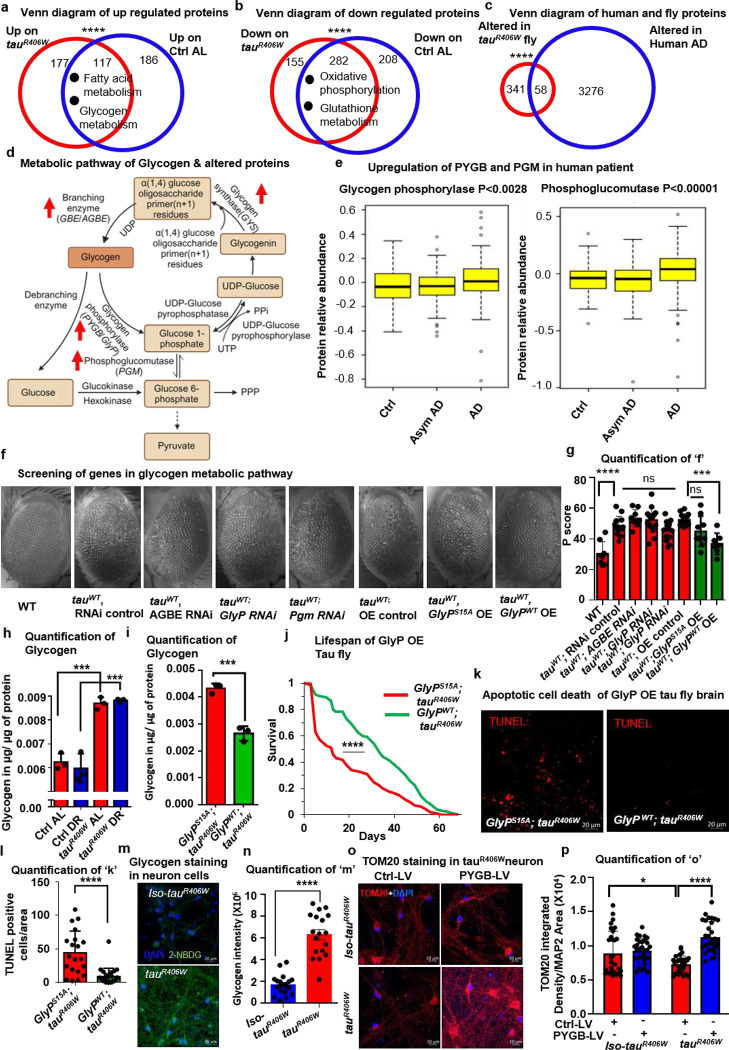
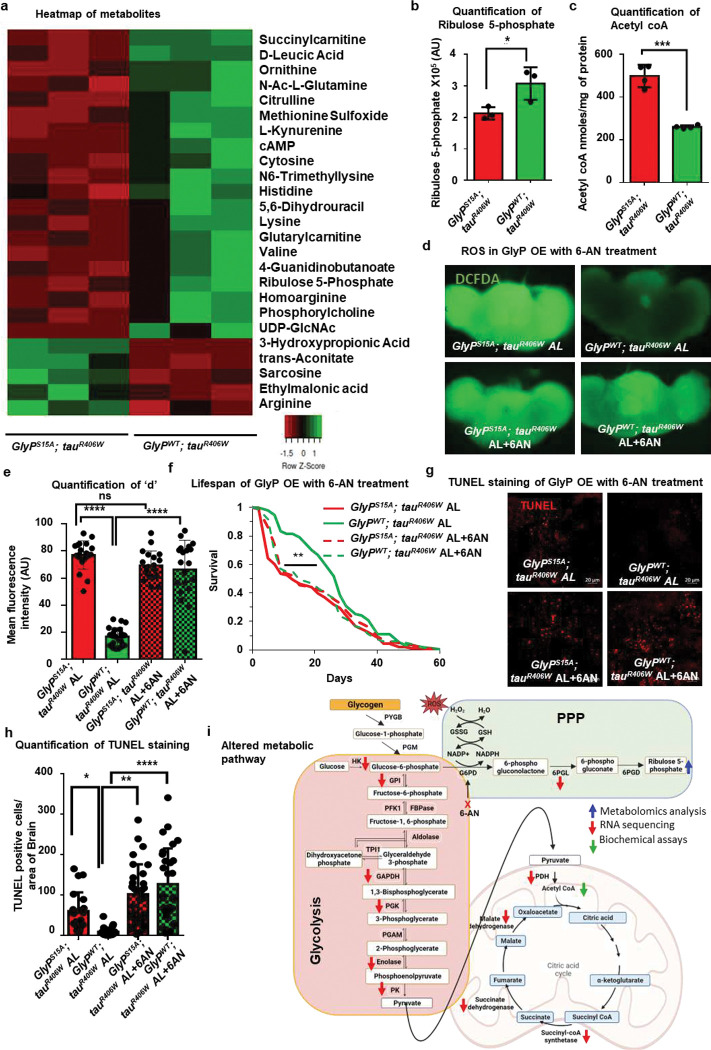
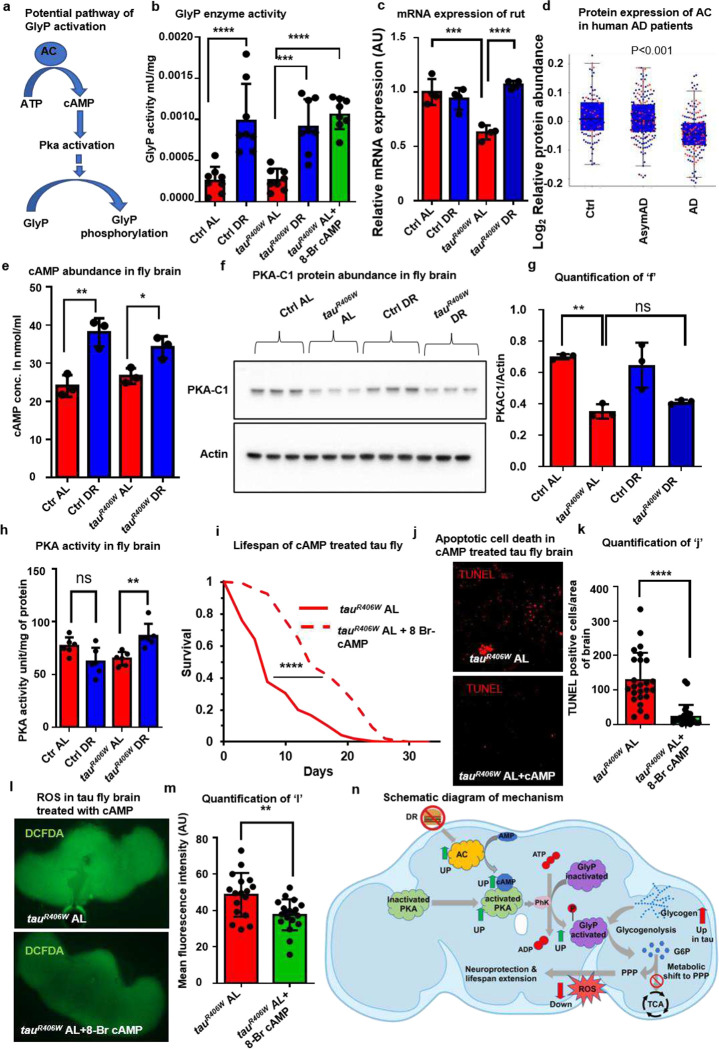
Tauopathies encompass a range of neurodegenerative disorders, such as Alzheimer's disease (AD) and frontotemporal dementia (FTD). Unfortunately, current treatment approaches for tauopathies have yielded limited success, underscoring the pressing need for novel therapeutic strategies. We observed distinct signatures of impaired glycogen metabolism in the Drosophila brain of the tauopathy model and the brain of AD patients, indicating a link between tauopathies and glycogen metabolism. We demonstrate that the breakdown of neuronal glycogen by activating glycogen phosphorylase (GlyP) ameliorates the tauopathy phenotypes in flies and induced pluripotent stem cell (iPSC) derived neurons from FTD patients. We observed that glycogen breakdown redirects the glucose flux to the pentose phosphate pathway to alleviate oxidative stress. Our findings uncover a critical role for increased GlyP activity in mediating the neuroprotection benefit of dietary restriction (DR) through the cAMP-mediated protein kinase A (PKA) activation. Our studies identify impaired glycogen metabolism as a key hallmark for tauopathies and offer a promising therapeutic target in tauopathy treatment.


Conflict of interest statement

Competing interests PK is a founder and a member of the scientific advisory board at Juvify Bio. Other authors have no conflicts of interest.

Figures

Fig 1.
Fig 1.. DR increases lifespan and protects against neurodegeneration in tau flies
a, Lifespan of control (Ctrl) flies, elav-Gal4/+ on AL (red) & DR (blue) diets, show extension on DR. b, Lifespan of flies expressing tauWT in the neuron shows extension on DR. c, Lifespan of flies expressing tauR406W in the neurons shows extension on DR. d, Mean lifespans of control, tauWT and tauR406W flies are increased on DR over flies raised on the AL diet. This experiment represents the mean values of three independent experiments. e, TUNEL staining of control & tauR406W fly’s midbrain on AL & DR. Red dots indicate TUNEL-positive nuclei, which are increased in tauR406W on AL diets and rescued by DR diet. f, Quantification of TUNEL staining show that the number of TUNEL-positive cells per area of the tauR406W fly brain increases on AL diet and is rescued by DR. Dots represent individual fly brains. See also Figure S1. g, Semi-thick sections of tauR406W fly brain stained with toluidine blue shows increased vacuoles in tauR406W, which is rescued by DR. h, Quantification of vacuoles per brain section showing that DR rescues increased vacuoles in tauR406W. Data in panel D represents 3 independent experiments. An asterisk (*) indicates a significant difference between experimental groups and controls, with the level of significance denoted by the number of asterisks p < 0.05 for *, p < 0.01 for **, p < 0.001 for *** and p < 0.0001 for **** by log-rank test (a, b, and c) or by one-way ANOVA (d, f, and h). Data in bar graphs are presented as mean ± SEM.
Fig. 2
Fig. 2. Glycogen metabolism is altered in tauopathy, and glycogen breakdown prevents neurodegeneration in Drosophila and iPSC-derived neurons
a, Venn diagram of the number of proteins upregulated in tauR406W (red circle) as well as in control on AL diets (blue circle). Dots represent enriched pathways of overlapping proteins, including fatty acid and glycogen metabolism. b, Venn diagram shows numbers of proteins down-regulated in tauR406W (red circle) and control on AL diets (blue circle). Dots represent enriched pathways of overlapping proteins, including oxidative phosphorylation and glutathione metabolism. c, Venn diagram of the overlapping genes altered in humans and flies. The red circle represents altered protein with a human orthologue, and the blue circle represents altered protein in a human AD patient’s brain. d, Schematic diagram of glycogen metabolism with upregulated proteins marked with red upright arrows. e, Correlation of glycogen phosphorylase and phosphoglucomutase protein abundance with AD diagnosis. Asym AD represents asymptomatic AD f, Images show eye degeneration by overexpression of tauWT in the eye driven by GMR, a constitutively active stable regulator rescued by GlyPWT overexpression. Either RNAi or overexpression construct was activated by elav Gal4. g, Quantification of the phenotypic score derived from either RNAi or overexpression flies shows GlyPWT overexpression rescues the phenotypic score of eye degeneration. h, Quantification of glycogen (in μg/μg of protein) in tauR406W or control on both AL and DR diets shows increased glycogen in tauR406W fly brain. The red bars represent flies on the AL diet, and the blue bars represent flies on the DR diet. i, Quantification of glycogen (in μg/μg of protein) of control (tauR406W expressing mutant GlyPS15A) and overexpression of GlyPWT in tauR406W fly brains show a reduction in GlyPWT in tauR406W. j, Increased lifespan of GlyPWT; tauR406W (green) compared to control GlyPS15A; tauR406W flies(red). k, TUNEL staining of whole mount fly brains of GlyPS15A; tauR406W and GlyPWT; tauR406W. Red dots represent TUNEL-positive cells reduced in the midbrain of GlyPWT; tauR406W flies. l, Quantification of TUNEL staining shows that the number of TUNEL-positive cells per brain area is reduced in GlyPWT; tauR406W. Dots represent individual fly brains. m, Images represent glycogen staining with fluorescent 2-NBDG in patient iPSC-derived tauR406W neurons and isogenic control cells(iso-tauR406W). n, Quantification of glycogen as fluorescence intensity shows an increase in tauR406W neurons (red) compared to isogenic control neurons(blue). o, Immunocytochemistry of mitochondria labeled with TOM20 (red) counterstained by DAPI (blue) in iso-tauR406W and tauR406W neurons with either control lentiviral transduction or PYGB overexpressing lentivirus. p, Quantification of mitochondrial density normalized with MAP2 area shows that reduced mitochondria in tauR406W neurons are rescued by PYGB overexpression. Each dot represents an image field from n=3 coverslips per condition for N and P. See also Table 1 in supplementary, Figure S2, supplementary data 1, and supplementary data 2. An asterisk (*) indicates a significant difference between experimental groups and controls, with the level of significance denoted by the number of asterisks p < 0.05 for *, p < 0.01 for **, p < 0.001 for *** and p < 0.0001 for **** by Fisher’s exact (a, b, and c), by one-way ANOVA (e, g, and h), by Two-way ANOVA (p), by Student’s t-test (i, l, and n) or by log-rank test (j). Data in bar graphs are presented as mean ± SEM.
Fig 3.
Fig 3.. Glycogen breakdown shunts glucose to the pentose phosphate pathway and reduces oxidative stress
a, Heatmap of significantly (p<0.05) altered metabolites compared between GlyPS15A; tauR406W and GlyPWT; tauR406W. The green spectrum represents upregulated metabolites, and the red represents downregulated metabolites. b, Quantification of Ribulose 5-phosphate shows its abundance is higher in GlyPS15A; tauR406W (red) than control GlyPWT; tauR406W (green). c, Quantification of acetyl coA shows a reduction in GlyPS15A; tauR406W (red) fly brain compared to GlyPWT; tauR406W (green). d, Images show ROS staining by DCFDA in the wholemount brains of GlyPS15A; tauR406W, and GlyPWT; tauR406W fly with and without 6-AN treatment. e, Quantification of fluorescence intensity of DCFDA staining shows a reduction in GlyPWT; tauR406W (green) compared to GlyPS15A; tauR406W (red) and increased in 6-AN treatment (green hatched bar). f, Lifespan extension of GlyPWT; tauR406W (green) compared to GlyPS15A; tauR406W (red) is abrogated with 6-AN treatment (green dashed line). g, Images represent TUNEL staining of wholemount brain of GlyPS15A; tauR406W and GlyPWT; tauR406W with and without 6-AN treatment. Red dots represent TUNEL-positive cells. h, Quantification shows reduced TUNEL positive cells in GlyPWT; tauR406W (green) than GlyPS15A; tauR406W (red) and an increase with 6-AN treatment (green checkered bar). i, Schematic diagram shows that glycogen catabolism induces the pentose phosphate pathway and reduces the glycolysis and TCA cycle. Arrows represent altered pathway intermediates or enzyme expression. See also Figure S3, Supplementary Data 3, Supplementary Data 4. An asterisk (*) indicates a significant difference between experimental groups and controls, with the level of significance denoted by the number of asterisks p < 0.05 for *, p < 0.01 for **, p < 0.001 for *** and p < 0.0001 for **** by Student’s t-test (b and c), by one-way ANOVA (e and h) or by log-rank test (f). Data in bar graphs are presented as mean ± SEM.
Fig. 4
Fig. 4. DR activates GlyP by activating the cAMP/PKA pathway
a, Schematic diagram of upstream activator of GlyP. b, GlyP activity in brain lysate of control and tauR406W on DR and with 8-Br-cAMP treatment on AL diet. Throughout the figure, red, blue, and green colors represent AL, DR, and AL + 8-Br-cAMP. c, Relative mRNA expression of the rut gene (normalized with RP49) in tauR406W is downregulated in AL and rescued in the DR diet. d, Protein abundance of AC is reduced in AD patients. e, cAMP concentration is increased in control and tauR406W flies on the DR diet compared to the AL diet. f, Western blot of PKA-C1 and actin of brain tissue lysate of control and tauR406W on AL and DR. g, Normalized densitometric analysis of western blot shows decreased abundance of PKA-C1 of TauR406W on AL h, PKA activity increases with tauR406W reared on DR than AL i, Lifespan of tauR406W flies reared on AL is extended with 8-Br-cAMP treatment (dash red). j, Images show TUNEL staining of tauR406W fly brains with and without 8-Br-cAMP treatment. Red dots represent TUNEL-positive cells in the midbrain. k, 8-Br-cAMP treatment decreases TUNEL positive cells in tauR406W flies. Dots represent individual brains. l, Images show ROS stained with DCFDA in tauR406W treated with 8-Br-cAMP. m, ROS are reduced in tauR406W fly brains treated with 8-Br-cAMP. Dots represent individual brains. n, Schematic diagram of the mechanism of DR-mediated neuroprotection and lifespan extension by activation of GlyP via cAMP-mediated PKA activation. An asterisk (*) indicates a significant difference between experimental groups and controls, with the level of significance denoted by the number of asterisks p < 0.05 for *, p < 0.01 for **, p < 0.001 for *** and p < 0.0001 for **** by Student’s t-test (k and m), by one-way ANOVA (b, c, d, e, g, and h) or by log-rank test (i). Data in bar graphs are presented as mean ± SEM.

References

    1. Goedert M., Eisenberg D. S. & Crowther R. A. Propagation of Tau Aggregates and Neurodegeneration. 10.1146/annurev-neuro-072116-031153 40, 189–210 (2017). - DOI - PubMed
    1. Kovacs G. G. Tauopathies. Handb Clin Neurol 145, 355–368 (2017). - PubMed
    1. Brunden K. R., Trojanowski J. Q. & Lee V. M. Y. Advances in tau-focused drug discovery for Alzheimer’s disease and related tauopathies. Nature Reviews Drug Discovery 2009 8:10 8, 783–793 (2009). - PMC - PubMed
    1. Ji C. & Sigurdsson E. M. Current Status of Clinical Trials on Tau Immunotherapies HHS Public Access. Drugs 81, 1135–1152 (2021). - PMC - PubMed
    1. Costantini L. C., Barr L. J., Vogel J. L. & Henderson S. T. Hypometabolism as a therapeutic target in Alzheimer’s disease. BMC Neurosci 9, 1–9 (2008). - PMC - PubMed

Publication types

LinkOut - more resources