[Preprint]. 2023 Nov 7:rs.3.rs-3479973.
doi: 10.21203/rs.3.rs-3479973/v1.

Imaging-based chromatin and epigenetic age, ImAge, quantitates aging and rejuvenation

Affiliations

Imaging-based chromatin and epigenetic age, ImAge, quantitates aging and rejuvenation

Martin Alvarez-Kuglen et al. Res Sq. .

Update in

  • ImAge quantitates aging and rejuvenation.
    Alvarez-Kuglen M, Ninomiya K, Qin H, Rodriguez D, Fiengo L, Farhy C, Hsu WM, Kirk B, Havas A, Kaufman C, Feng GS, Roberts AJ, Anderson RM, Serrano M, Adams PD, Sharpee TO, Terskikh AV. Alvarez-Kuglen M, et al. Nat Aging. 2024 Sep;4(9):1308-1327. doi: 10.1038/s43587-024-00685-1. Epub 2024 Aug 29. Nat Aging. 2024. PMID: 39210148

Abstract

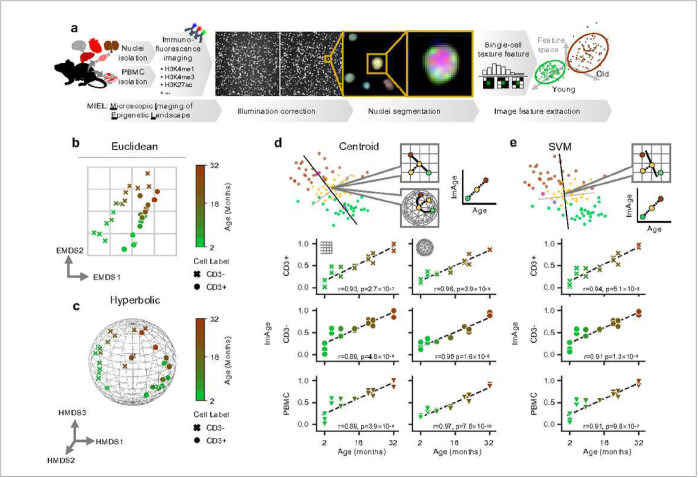
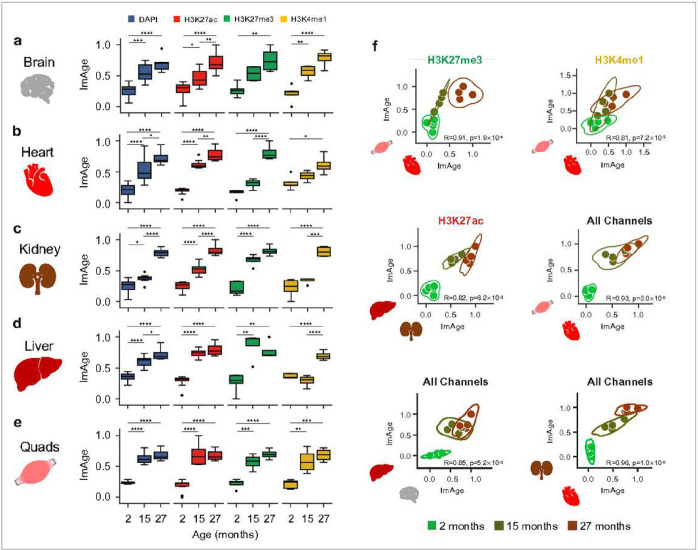
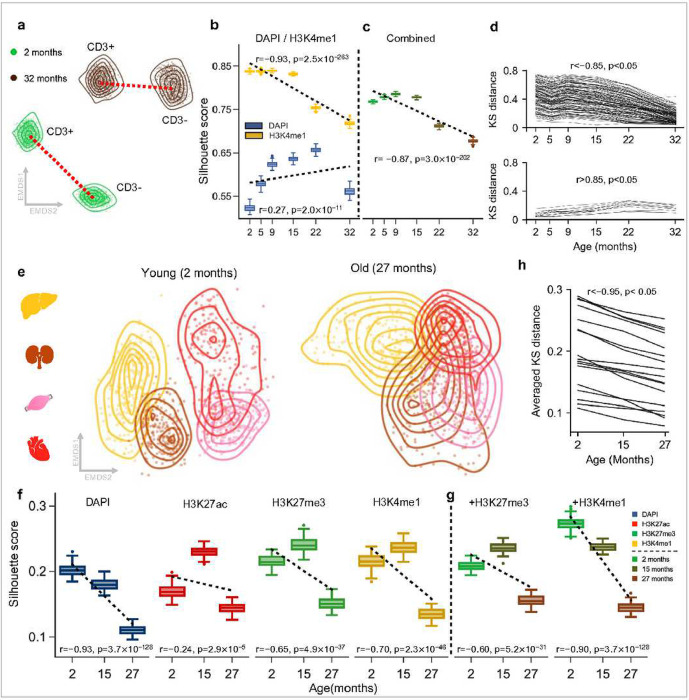
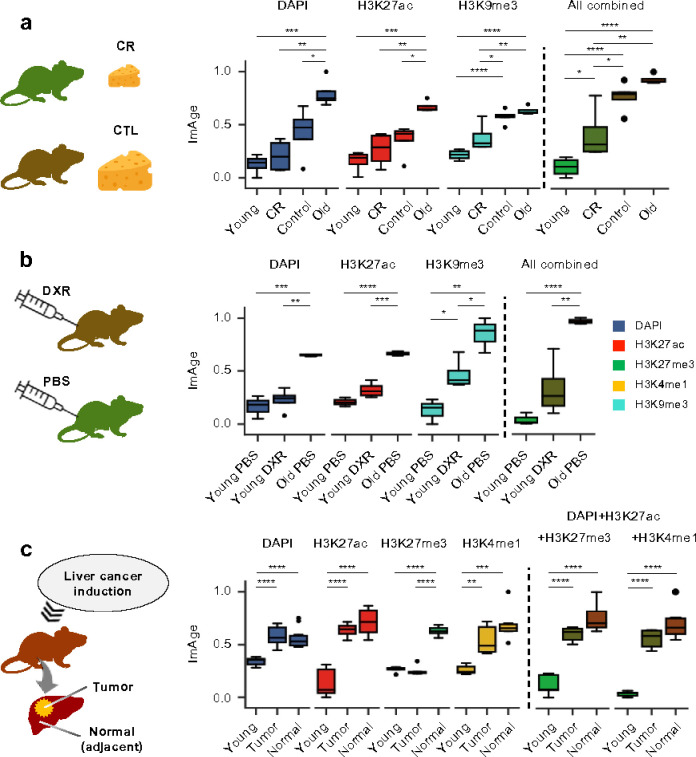
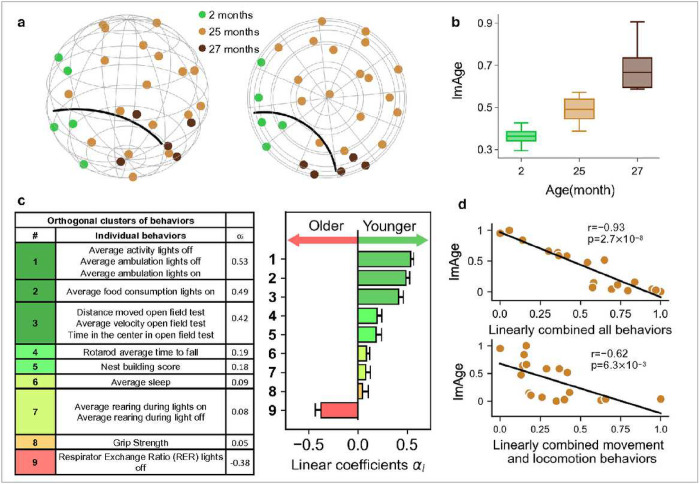
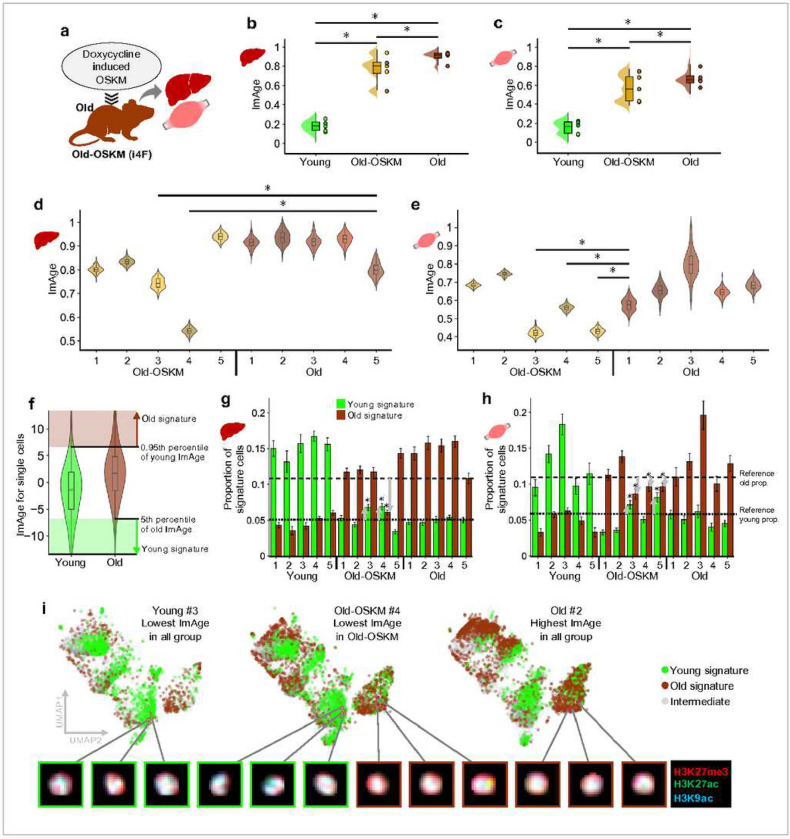
Biomarkers of biological age that predict the risk of disease and expected lifespan better than chronological age are key to efficient and cost-effective healthcare1-3. To advance a personalized approach to healthcare, such biomarkers must reliably and accurately capture individual biology, predict biological age, and provide scalable and cost-effective measurements. We developed a novel approach - image-based chromatin and epigenetic age (ImAge) that captures intrinsic progressions of biological age, which readily emerge as principal changes in the spatial organization of chromatin and epigenetic marks in single nuclei without regression on chronological age. ImAge captured the expected acceleration or deceleration of biological age in mice treated with chemotherapy or following a caloric restriction regimen, respectively. ImAge from chronologically identical mice inversely correlated with their locomotor activity (greater activity for younger ImAge), consistent with the widely accepted role of locomotion as an aging biomarker across species. Finally, we demonstrated that ImAge is reduced following transient expression of OSKM cassette in the liver and skeletal muscles and reveals heterogeneity of in vivo reprogramming. We propose that ImAge represents the first-in-class imaging-based biomarker of aging with single-cell resolution.


Conflict of interest statement

COMPETING FINANCIAL INTERESTS The authors declare no competing financial interests.

Figures

Fig. 1.
Fig. 1.. Emergence of chromatin trajectories of aging.
a, Graphical representation of the MIEL workflow: Nuclear isolation, immunofluorescence imaging, image preprocessing, nuclear segmentation, texture feature extraction, and downstream analysis. b-c, ImAge calculations and regression analysis of CD3+ and CD3− subsets of PBMCs from C57BL/6NJ males aged from 1.7 to 32 months (1.7, 2.2, 5.3, 8.7, 15.1, 21, 22.3, 32.2) (n=2 per age group). b, 2-dimensional EMDS of texture features. c, 3-dimensional HMDS of texture features. d-e, Graphical representation of the method of ImAge axis construction above scatterplots of the resulting ImAge measurements versus age for the CD3+ subset (top), the CD3− subset (middle), and the whole population (PBMC) (bottom). d, ImAge using the geodesic connecting the centroids of the youngest and oldest groups in Euclidean or hyperbolic space. e, ImAge using Linear SVM fit to the youngest and oldest groups. PBMC: peripheral blood mononuclear cells. E/HMDS: Euclidean/hyperbolic multi-dimensional scaling, respectively.
Fig. 2
Fig. 2. Age-related ImAge progression in multiple solid organs.
a-e ImAge measurements and accuracy calculations on isolated nuclei from quadriceps (quads), liver, kidney, cardiac muscle (heart), and brain collected from three differentially aged cohorts of mice: 2 months (n=5) 15 months (n=4) and 27 months (n=4). Two plates were analyzed, both immunolabeled with H3K27ac+DAPI and then with either H3K27me3 or H3k4me1. Data for overlapping channels (DAPI & H3K27ac) were combined for computations. Boxplots minmax normalized 0–1 test set of bootstrapped data is shown. Differences of means were calculated via Tukey’s HSD. f, Consistent correlations were observed between skeletal muscle & heart (top row, bottom left), as well as brain & liver (bottom center), and heart & kidney (bottom right). Spearman’s R and p-values with Bonferroni correction for multiple comparisons. Significance values for all tests shown represent: * = p < 0.05, ** = p < 0.01, *** = p < 0.001, **** = p < 0.0001
Fig. 3.
Fig. 3.. Age-related loss of cell type-specific chromatin and epigenetic information.
a, A 2-dimensional EMDS of young (1.7 months) and old (32.2 months) CD3+ and CD3− subsets of PBMCs. b, c, Silhouette scores of CD3+ and CD3− subsets at indicated ages for individual marks (b) or their combination (c) using the information distance metric (based on mutual information and Shannon entropy, see Methods). d, the Kolmogorov-Smirnov (KS) distance analysis of CD3+ and CD3− subsets across indicated ages performed on significant features. e, A 2-dimensional EMDS of young (2 months) and old (27 months) liver, kidney, quads, and heart. f, g, Silhouette scores of 5 organs at indicated ages for individual marks (f) or their combination (g) using the information distance metric. d, the Kolmogorov-Smirnov (KS) distance analysis of 4 organs across indicated ages performed on significant features. Significant features were selected based on: 1) statistically significant (p < 0.05, Pearson |r|>0.85) KS distances between cell types and 2) a statistically significant (p < 0.05, Pearson |r|>0.95) correlation between KS distance and age.
Fig. 4.
Fig. 4.. Diet, chemotherapy, and cancer affect ImAge.
a-c ImAge calculations separated by epigenetic marks and several marks combined for indicated conditions for Caloric Restriction (CR), Doxorubicin (DXR), or induced hepatocarcinomas (tumor). a, young (3 mo., n=4) and old (24 mo., n=4) control mice were used to construct an ImAge axis upon which CR (7 mo., n=4) and control (7 mo., n=4) ImAge values were measured. b, young (1 mo., n=3) and old (27 mo., n=3) control mice treated with PBS were used to construct an ImAge axis upon which young DXR-treated mice (1 mo., n=4) ImAge values were measured. c, liver tissue from old mice (8 mo., n=3) with induced tumors was separated by the presence or absence of tumors. Normal old tissue along with young control mice (2 mo., n=3) were used to construct an ImAge axis upon which old tumor ImAge values were measured. In (c), two plates were analyzed, both immunolabeled with H3K27ac+DAPI and then with either H3K27me3 or H3k4me1. Data for overlapping channels (DAPI & H3K27ac) were combined for computations. Significance was calculated using Tukey’s HSD. All ages shown are in months. p-value cutoffs are as follows: *: 0.01 < p <= 0.05; **: 0.001 < p <= 0.01; ****: p <=.0001.
Fig. 5.
Fig. 5.. Locomotor activity is a salient correlate of ImAge in chronologically identical mice.
a, A 3-dimensional representation of the 9-dimensional Hyperbolic embedding (HDMS) and its 2-dimensional projection (view from the top) of the young (2 months) and old (27 months) mouse quadriceps samples utilized as references to obtained centroids for the ImAge axis. Quadriceps samples from chronologically identical (25 months) mice from the behavioral cohort were co-embedded with reference mice to obtain (b) their ImAge distribution between the reference samples. c, the 9 orthogonal clusters of behavior with the coefficients for linear optimization correlating behavioral/functional readouts and ImAge. The direction of ImAge association with each cluster (older, younger) is proportional to the cluster’s αi. d, Correlations between ImAge and a linear combination of all behavioral readouts (top) and locomotor activities only, clusters 1, 3, 4, and 7 (bottom).
Fig. 6.
Fig. 6.. ImAge revealed heterogeneity of partial reprogramming in vivo.
The chronological ages of young and old mice are 3.2 and 13.8 months, respectively. a, Evaluating the degree of reprogramming after doxycycline-induced OSKM factors (i4F mice, old-OSKM) in the liver and muscle. b, c, Distribution of ImAge (100 iterations of the test is shown) in the liver (b) and muscle (c). Dots on the right side of violin plots are the mean ImAge of individual mouse samples. d, e, Violin plots representing the distribution of the ImAge within individual samples in the liver (d) and muscle (e). Statistically significant differences were assessed between all old-OSKM samples and the old mice sample with the lowest ImAge (the “youngest” old mouse). f, Distribution of ImAge at a single-cell level. The mean accuracy of the young and old segregation was 0.620±0.001 (100 iterations). The young and old signatures are defined by the threshold of ImAge readout at 5th (and lower) and 95th (and higher) percentile values of old and young single cell ImAge readout, respectively. g, h, The proportion of young/old ImAge signatures in the liver (g) and muscle (h) for each animal. The gray arrows indicate an increase in young and a decrease in old signatures compared to the “youngest” old mouse defined in comparison of ImAge distributions (d and e). The dotted and dashed lines indicate the reference proportions of young and old signatures, respectively, in the “youngest” old mouse. i, Uniform manifold approximation and projection (UMAP) of single-cell texture features obtained from the liver samples. The green and brown data points represent the single cells with young and old ImAge signatures, respectively. The intermediate single cells are in grey. p<0.05 Mann-Whitney U-test.

References

    1. Zampino M. et al. Biomarkers of aging in real life: three questions on aging and the comprehensive geriatric assessment. GeroScience 44, 2611–2622 (2022). - PMC - PubMed
    1. Baker G. T. & Sprott R. L. Biomarkers of aging. Experimental Gerontology 23, 223–239 (1988). - PubMed
    1. Wagner K.-H., Cameron-Smith D., Wessner B. & Franzke B. Biomarkers of aging: from function to molecular biology. Nutrients 8, 338 (2016). - PMC - PubMed
    1. LaPierre T. A. & Hughes M. E. Population aging in Canada and the United States. in International handbook of population aging 191–230 (Springer, 2009).
    1. Control, Centers for Disease & Prevention. Trends in aging--United States and worldwide. MMWR. Morbidity and mortality weekly report 52, 101–106 (2003). - PubMed

Publication types

LinkOut - more resources